SPX another rejection of the broken supportThis is what is holding me off from being aggressive or just being long into FOMC.
Im hedged and waiting for the announcement
Spx500short

SPX 500 Short out of Rising ChannelLooking at the Liquidity pull off the top of structure... Rising channel has probed all liquidity gaps and swept highs... Looking at the Pattern to play out and extend down for a NEW LOW.. Bearish Divergence on MACD and RSI

SPX one more big bear channel visualizationA slightly lower into my 3802-17 level will be a perfect hit of the lower trend channel.
NQ already broke its on to the downside! Important to note
A right shoulder fake rally will be perfect before it really drops into Oct/Nov lows
Also dont be surprised if it breaks, then look for the retest of the broken trend channel from below
P.S. Dont forget to like (click star-ship button) my posts, so it gets pushed up on TV for others to see as well.
Thanks in advance!

SPX possible H&S pattern targets 3500 or soI have changed the color theme on my chart and removed everything I could to make it clear for those who are having troubles reading my charts.
Look what I just saw!
Let me introduce a possible pathway after tomorrows FOMC announcement.
On June 15th we have spike up and had a big range day. Then next day the price gaped down and made new lows.
I see kinda similar pathway were we either make a new low in am - 3802-17 and maybe 3795, then rally up to 3925-65SPX level to make a right shoulder. (I prefer 3955-65 in case we see low of 3800 in am)
Then the price can start moving fast and get below 3700 even by Friday, bottoming on the 27th in Tuesday turn around structure.
That low can be as deep as 3500! I have fibs supporting this possible move down from 3680 to 3500
So my plan for tomorrow, exit shorts (partly) in am and go long for a FOMC squeeze. Then short the close and hold into the 27th low.
Please do your own risk management as the price can be very volatile and will take both sides in stops (been there done that)
22nd is a reversal day of whatever day we get tomorrow and should bottom or top on the 27th. So if in fact we see selling after the FOMC, then I will be looking for a long at the end of the day instead of shorting the hole.
- 3802-17, 3752 and 3721 are the support levels to watch!
I will leave this right here.
Feel free to share this update with anyone.
P.S. (Sometimes Im getting interesting comments like my charts make people seizures (those people dont even follow me).
Just want to make it clear, that Im not here to make it pretty, Im not selling a anything to anyone or make money out of my posts. I do post my updates just to share with those who will appreciate that work and use it for their own homework. So please no need to even follow or see my charts if you cant read them, that means you're very new to the markets and need to do more study and learn simple stuff like moving averages, support/resistance lines as well as trendlines etc. All my charts are working progress, please respect that as well as my time)

SPX to retest broken trendline from the bottomMain resistance for the SPX is:
- 3942
- 3952-60
Support cluster is still the same:
- 3802-3817
- 3750-55
and much lower (check my last SPX update)
Im currently long ES and some SPY calls and will be adding to my swing short NQ position tomorrow and ideally on Wednesday.
- 3955 and 3975 are the 2 numbers where I will be adding to my short position.
In case of a super bullish case (like the one in NQ going to 12700), next resistance level to short is:
- 4025-35
So far Im looking for lower level, again please see my latest SPX update (link above)
And I think there is one big move down is coming up very soon.
Ideally we bottom on the 27-29th and rally hard into early Oct where we should see lower prices printed before this is over and another 11-14% rally starts
Have a good night
P.S. Dont forget to like (click star-ship button) my posts, so it gets pushed up on TV for others to see as well.
Thanks in advance!

sell short for pullback 1 or 2 target up to youoverbought short term
up much coz of coolinginflation while the fED SAID NOTHING ABOUT

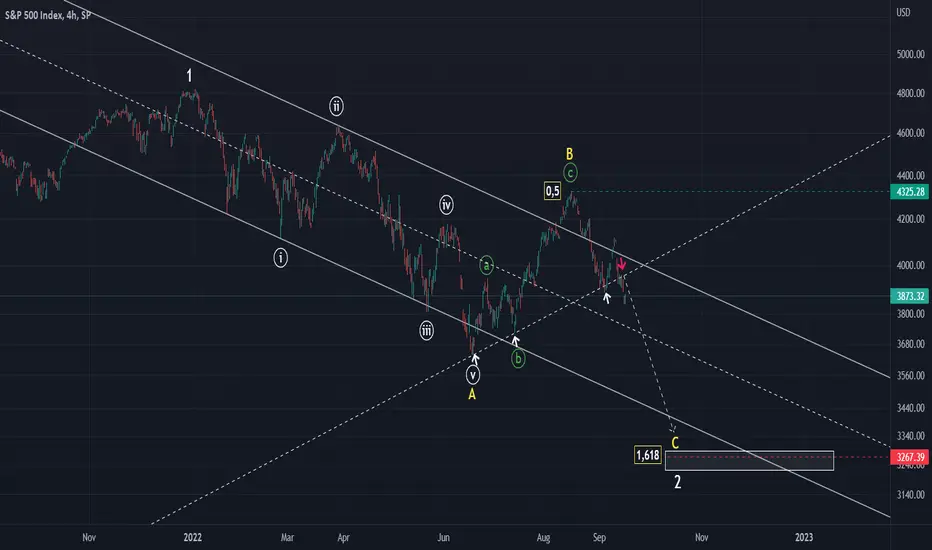
SPXSPX is at the end of a cycle and assuming that the crisis will continue, it is in a C wave in my opinion. My estimated target price for wave C is as I have shown.
SPX500 Breakout Short!SPX500 was trading in an uptrend
Along the rising support
But now we are seeing a bearish breakout
Of the support confluence
Which is now a resistance cluster
From where a further move down
It to be expected After retesting an area 3908.77

Posted this on the 12th of Sep, playing out so well!!!I did post this warning on Sep 12th as well as emailed to those who are on my email list.
Check the MACD on that day and now! It created a hook and continued lower, bearish!
Some people noted and didnt get trapped on that day, it was daily high close
DO NOT GET TRAPPED Today!!!
Dont short this red whole!
Have to leave, will be back in few hours, again dont get trapped on the short side today!
P.S. Dont forget to like (click star-ship button) my posts, so it gets pushed up on TV for others to see as well.
Thanks in advance!

Watch for S1 to hold on closing level!S1 is right at first gap to fill 3831, can act as a very good support.
So again, its a day when I will be buying longs, question is from what price.
Ideally I buy at 3802-18 level, but might buy at higher price if I see that S1 holding into the close and no new lows.
Please note
Futs can always extend into AH's session
DO NOT GET TRAPPED Today!!!
Dont short this red whole today!
P.S. Dont forget to like (click star-ship button) my posts, so it gets pushed up on TV for others to see as well.
Thanks in advance!

SPX500 continues to kill the cryptocurrency market!Hello trader Today I prepared a new idea for you. Like and subscribe to the channel there is a lot of useful information✅
After the release of the results on the consumer price index from the FOMC, the downward movement continues, what to expect next?
Speaking from the technical side, the asset has broken through the global trendline, which was a strong support, I expect the next stop in the zone of 3700-3750
Also, do not forget that next week the FOMC is expected again on the key rate, there will be results of an increase by 0.75 bp, we should expect again volatility in the stock market!

SPX Sep 16th updateThe price has broke down and Im waiting for 3880-86SPX to be lost.
Ideally we gap down below 3880-86 and it becomes a resistance.
Futs already down and below those numbers if convert to SPX.
My pathway for tomorrow is to buy a gap down to 3802-18 for at least a day or 2 bounce.
- There is nothing but air after 3880-86 is lost, all the way to the numbers above.
- If we loose 3800, next support is not there till 3750-52SPX
Im looking for a low in am and reversal into the close and Monday/Tue high
On the other hand we held 3888 level today, close enough to my support zone, so if it gaps up, it could be quite a big squeeze imo. But I give low odds for the gap up scenario.
Its a weekly closing, important numbers to watch are:
- Weekly support is at 3720-22SPX
- Next weekly support is at 3635-40SPX
- Weekly resistance is at 4018-20SPX
We should bottom next week, ideally at or after FOMC decision, then rally up in another bear market rally into second week of Oct and continue lower into Oct final low for this year.
- Next week low is expected to hit 3750 or 3680SPX
Final low I have is at 3580SPX. i was looking for 34-35 handle to get hit, it should get there sooner then later imo
If it gets hit next week, then we will see 32 handle in Oct
The trend is down till it's not!
Have a good night, rest and get ready for tomorrow...
P.S. Dont forget to like (click star-ship button) my posts, so it gets pushed up on TV for others to see as well.
Thanks in advance!

S&P with dotcom overlay - is the S&P heading for a 50% fall??The chart shows the current S&P price action with an analog overlay of the dotcom bear market.
Scenarios;
1/ Near term support at 3900
2/ Mid term support at 3600
3/ Longer term support at 3200
A break of all 3 of these support areas could possibly see a fall to 2345 or even covid19 lows.

SPX Sep 15th mid day updateI was sleeping in today, no point to trade this market but hold swing short position.
Mid Bollinger or 20MA crossed 110MA on daily, not a good sign for the bulls. MACD is still making new lows.
This seems to get to 3680SPX by the FOMC decision or right after.
Main resistance now is at 4030-45SPX
Mid resistance is at 3970-85SPX and I think we wont get above on any test, like it came short yesterday.
I will short 3970-85 level for a continuation of this move down
So far its breaking down here to my eyes and should follow through soon.
Main support is at 3880-86 now! On closing level
I will be trying long at 3880-86SPX tomorrow am, but its OPEX day and all the quarterly hedges will be off the lines and this can unleash much bigger swings in both directions, but main direction is down.
After the FOMC meeting 3680 should produce a good size bounce and ideally we see lower in Oct, 35-34 handle is very doable imo.
So need to over trade this as it chops both sides!

2HR - ES1 WENT HIGHER THAN SPY/SPX - NEXT WEEK SHORT I wont rattle off the fundamental reasons this was all a A FOMO RALLY to retrace the last sell off..
Now we are done and can see a Red Week
C.P.I number will be a catalyst ....and since the FEDS are signaling another .75% hike next following week
So to all my bearish friends
-------------
And the solid candles' red glare, the gamma bursting in air,
Gave proof through the night that our SHORT was still there.
O say, does that open position yet wave
O'er the land of the free and the home of the brave?

Short SPX H & S Neckline retest D1A potential short setup is forming on the SPX as the price action rallies up into a neckline retest. the area is also a bearish order block with an imbalance (dragon fruit).
Entry is around 4130 | Stoploss 4315 | Takeprofit 3766

SPX500 Going to $3890? I just want to point out that there is is Divergance on the chart with the MACD. So get ready to short.
I don't have much else to say about this for now. I just wanted to post what I can see for now.
Good luck with those trades 👍


SPX MACD hook formation - warned Monday amI did warn about this possible outcome early Monday am
All we need is to gap down tomorrow (which has a high probability now as we closed below 3955 and especially 3935)
Then the downside targets will be 3775 and even 3680. It can even stretch to 3450 if Jun lows are broken.
Only a gap up tomorrow can save from this pathway for now.
Dont pay attention to the chart, but the MACD
P.S. Dont forget to like (click star-ship button) my posts, so it gets pushed up on TV for others to see as well.
Thanks in advance!

SPX faile to even touch 4k zone - 3955SPX is nextSo far so good for lower levels
- 3945-55 must hold and I think it will not go lower today.
If we close at the lows, there is a potential of gaping down below 3935 tomorrow, which will make 3885 next target.
Main target on the downside to hold is 3800-20 as a must hold on any test.
Below 3800 we will see 3720 and 3635-40!!!
Watching the close, riding short from 3992SPX
P.S. Dont forget to like (click star-ship button) my posts, so it gets pushed up on TV for others to see as well.
Thanks in advance!

SPX500 Short setup +200 pips- We can see clearly a bearish impulsive movement from 4200 supply zone.
- Price started to consolidate 3900 (sign of Reversal).
- Price Started to rise and broke last highs with a slow bullish movement.
- We will wait for the price to reach 4200 then we may short it to 4000.

SPX can extend to a higher high before the 21st or fail hardIts all about 4125-35, 4150-60 and 4202SPX now.
All 3 are resistance levels!
Support is at 4085-90 and 4025, below it we should see 3955SPX
Im not sure about the exact pathway, so my game plan is to short 4145-60 and 4202 zone. If we breakout I will flip for a trip back to 4285-92 and even over 4300SPX
Please note, that this can even extend to 4425 just to screw everyone out on both sides and then sell hard.
So regardless of the situation, I will be short (if we make a new high) or long (if we make a higher low) on the 20-21st or before the FOMC.
Ideally we spike up to 4125-35 and even 4145-60SPX tomorrow and sell off into Fri OPEX low. That low should produce a good setup for a few days rally before the FOMC decision on the 21st.
One certain thing is that the Oct low should provide a good buy and hold setup going into EOY high.
Ideally we make a new low in Oct and then higher low in Nov (before the Midterms) and then off we go together with Santa.
Jan (in case of the above scenario) should mark the high and then we should see lows in Apr.
Levels of importance tomorrow:
- 4145
- 4160-62
Closing above those levels will get us back to 4195-4205SPX by Fri.
Im going to short tomorrow's gap for the crap scenario. Ideally we hit 4125-35 or even 4145-60 in am and crap from there.
Have a good night
P.S. Dont forget to like (click star-ship button) my posts, so it gets pushed up on TV for others to see as well.
Thanks in advance!

SP500 entering sell zone. 1:3 R:R sell tradeLast week I said that SP500 is drawing a nasty picture and although we can have a rebound from the recent ascending trend line, this will not change the longer-term bearish perspective.
Indeed, we had this rebound and now the SP500 index is trading in a very strong sell zone that is set between 4100 and 4200.
In my opinion, a reversal to the downside will follow from this zone and traders should look for selling opportunities.
This outlook is intact as long as the price is under 4300 and bears can target the previous low for their sell short trades.
