SPX500 Will Fall!FOREXCOM:SPX500 is trading in a
Downtrend and the indice
Is making a pullback
From the horizontal resistance
Of 5771.33 from where
We will be expecting a
Further move down !
Spx500short

SPX500 Potential Short!SPX500 made a strong
Move upwards and the indice
Will soon retest a horizontal
Resistance of 5859.42 from
Where we will be expecting
A local bearish pullback
And a move down !

SPX500 Will Go Down!SPX500 is going down
Now after the bearish
Breakout of the rising support
So after a potential local
Pullback we will be
Expecting a further move down

SPX Grand Super Cycle- Possible Target $ 6000 to 7000There is no denial for a short-term pullback in the market, which will be healthy for the market.
Also lots of speculation/leverage in the current market
So the market maker may shake out the weak hands soon.
If we see SPX in the quarterly chart Wave 1 started in 1976 and ended in 2000 which was around 26 years.
Wave 2 was from 2001 to 2009. Total nine years for wave two corrections.
Wave 3 started in 2009 and correction in 2020 March was quick just two months correction (Most probable it should not be wave 4 correction). This can be a nest (each wave is built of smaller waves and, at the same time, each wave is a part of a bigger wave) and wave II of a second nest.
In my opinion, there would be two probable scenarios, the first one is SPX is still in wave three and it will go to 6000/7000 in this decades.
As if we go with SPX Grand Super Cycle then- possible targets can be 4700 to 5000 or more before a major crash (Wave 4 correction multi-years) happen and after the wave 4 correction wave 5 targets can be 6000 to 7000 or more
The second one is to complete wave 5 around 4600 to 5300 and 60-80 % crash to 1500 - 2000
So just remember a sharp correction/crash wouldn’t be the end of the world, it will be an opportunity to invest for the long term
Trend-based fib extension support the first scenario.
This is just my view please share your views in the comment section.
Thank you
Disclaimer
This idea does not constitute financial advice. It is for educational purposes only,

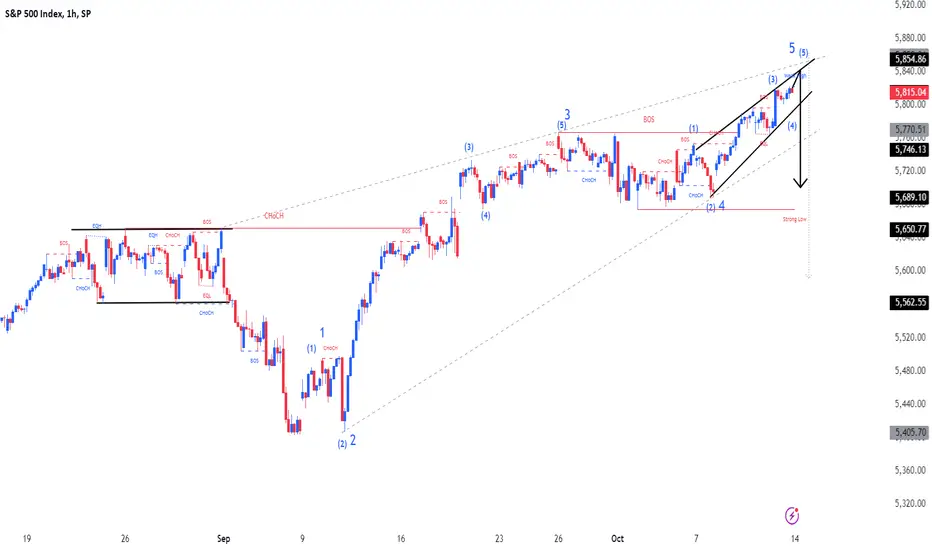
SPX500Pair : SPX500 Index
Description :
Completed " 12345 " Impulsive Waves
Break of Structure
RSI - Divergence
Rising Wedge as an Corrective Pattern in Short Time Frame and Long Time Frame
Demand Zone
spx &nasdaq in an iminent drop of valuespx showing an iminent short going in value, where it can go? last time i tryed to do the math it would go arround 2700 but without any sure, the major stock whealtiest did a 3x wealth since covid drop, this could be another timer that can quintuple the value, or make more 15x time the value that they had before covid, it is an iminent drop coming, in my opinion, good for everyone even for world economies, to triple their whealth and put the profits in their balance sheet and put time their gdp growth, is a question of timing, after covid drop, that in my opinion, didnt had too much growth in manufactories and jobs, only people gowing ther whealth by the 'inflation' fault,
anyway, there is an iminent drop in the stock market in the western countries, at least, im not into asian market but american indexes are in an eminent significant drop, in my POV.

SPX500 Resistance Ahead!SPX500 keep growing in
An uptrend but the index
Will soon hit a horizontal
Resistance of 5645.15 and
After the retest we will
Be expecting a local
Bearish reaction!

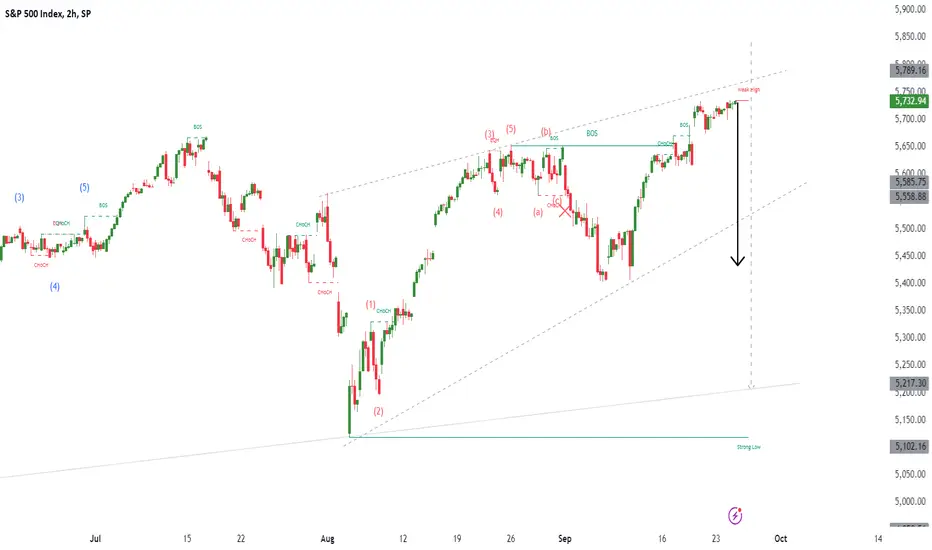
SPX500Pair : SPX500 Index
Description :
Completed " 12345 " Impulsive Waves
Break of Structure
RSI - Divergence
Rising Wedge as an Corrective Pattern in Short Time Frame
Resistance Level
Major Top Forming on SPXHello Everyone, a simple analysis of the RSI and current price action appear eerily similar to the 2022 peak. During the 2022 top we had financial experts and the media claiming victory stating that this bull market will continue, however we crashed soon after. Now the SPX is currently forming a topping process, this could be done or we could go a little higher before the bear market continues. It's clear that the SPX is making new highs while NDX and IWM fail to make a new high suggesting that this is the top.
If this economy is doing so good, then why does the FED need to cut interest rates? The fed is cutting interest rates because we are either in a recession or we are very close to one. There is no such thing as a soft landing. The truth is we may already be in a recession and it wouldn't be declared until we are deep into one.
If anything we are no longer going into a recession, we are going into a depression. Do not get lulled into a false sense of security like many others during the 2000 and 2008 top.

SPX - SHORT [Capital]50 BPS cut is just ridiculous, we are facing dark times. Are you sure it is a bull market now?
Old man Warren already answered this.
Stay tuned.

SPX500 / US500 Bank Money Heist Plan On Bullish SideBonjour My Dear Robbers / Money Makers & Losers, 🤑 💰
This is our master plan to Heist SPX500 / US500 Bank based on Thief Trading style Technical Analysis.. kindly please follow the plan I have mentioned in the chart focus on Long entry. Our target is Red Zone that is High risk Dangerous level, market is overbought / Consolidation / Trend Reversal / Trap at the level Bearish Robbers / Traders gain the strength. Be safe and be careful and Be rich.
Attention for Scalpers : If you've got a lot of money you can get out right away otherwise you can join with a swing trade robbers and continue the heist plan, Use Trailing SL to protect our money 💰.
Note: If you've got a lot of money you can get out right away otherwise you can join with a swing trade robbers and continue the heist plan, Use Trailing SL to protect our money.
Entry : Can be taken Anywhere, What I suggest you to Place Buy Limit Orders in 15mins Timeframe Recent / Nearest Swing Low
Stop Loss 🛑 : Recent Swing Low using 30m timeframe
Warning : Fundamental Analysis news 📰 🗞️ comes against our robbery plan. our plan will be ruined smash the Stop Loss. Don't Enter the market at the news update.
Loot and escape on the target 🎯 Swing Traders Plz Book the partial sum of money and wait for next breakout of dynamic level / Order block, Once it is cleared we can continue our heist plan to next new target.
Support our Robbery plan we can easily make money & take money 💰💵 Follow, Like & Share with your friends and Lovers. Make our Robbery Team Very Strong Join Ur hands with US. Loot Everything in this market everyday make money easily with Thief Trading Style.
Stay tuned with me and see you again with another Heist Plan..... 🫂

SPX500 Resistance Ahead!SPX500 is making a bullish
Correction and will soon
Hit a horizontal resistance
Level of 5492.01 from where
We will be expecting a
Further move down !

S&p 5400 coming Ai bubble popping as we speak 9/5 2024 NVDA books reflect sales to companies that now are under scrutiny geopolitics hot oil choppy avgo missed earnings rate cut drama the cooks at the BLS continue to chef it up with wild swings in reports and revisions all with the last US election in the rear view mirror

SPX500 Will Fall! SPX500 made a swift
Bullish recovery from the
Lows but the Indice is now
Retesting a horizontal
Resistance level of 5555.01 we will be
Expecting a local
Bearish correction!

SPX forming a top?US500 - 24h expiry
Levels above 5630 continue to attract sellers.
The 161.8% Fibonacci extension is located at 5544 from 5650 to 5585.
Bespoke support is located at 5540.
Selling spikes offers good risk/reward.
Economic figures could adversley affect the short term technical picture.
We look to Sell at 5630 (stop at 5665)
Our profit targets will be 5540 and 5470
Resistance: 5630 / 5650 / 5680
Support: 5545 / 5540 / 5470
Risk Disclaimer
The trade ideas beyond this page are for informational purposes only and do not constitute investment advice or a solicitation to trade. This information is provided by Signal Centre, a third-party unaffiliated with OANDA, and is intended for general circulation only. OANDA does not guarantee the accuracy of this information and assumes no responsibilities for the information provided by the third party. The information does not take into account the specific investment objectives, financial situation, or particular needs of any particular person. You should take into account your specific investment objectives, financial situation, and particular needs before making a commitment to trade, including seeking advice from an independent financial adviser regarding the suitability of the investment, under a separate engagement, as you deem fit.
You accept that you assume all risks in independently viewing the contents and selecting a chosen strategy.
Where the research is distributed in Singapore to a person who is not an Accredited Investor, Expert Investor or an Institutional Investor, Oanda Asia Pacific Pte Ltd (“OAP“) accepts legal responsibility for the contents of the report to such persons only to the extent required by law. Singapore customers should contact OAP at 6579 8289 for matters arising from, or in connection with, the information/research distributed.

SPX500 Local Short!SPX500 has hit a horizontal
Resistance level of 5637.19
And we are already seeing a
Bearish reaction so we will
Be expecting a further
Bearish correction !

SPX Just about to start the bear.Looking at the day we are as bearish as we can begin to be.
pay attention to what happens next.

S&P500 Prediction: is it forming double top??Is S&P500 forming Double top?
A low-volume rise is a telltale sign.
Deep valley below the double top meets criteria.
Beware of large red candles, as they signal confirmation of the reversal.
What's your opinion about it?

SPX500 Resistance Ahead!SPX500 keeps going up
Now in a local uptrend
But the Indice will soon
Hit a horizontal resistance
Of 5574.53 and after
The retest we will be
Expecting a local
Move down !

S&P 500 Index (SPX) Analysis: Key Levels and Expectations.SP:SPX My Take:
Looking at the 4-hour chart of the S&P 500 Index, it's clear that we're approaching a critical juncture. The price recently rallied up to the $5,630 - $5,655 resistance zone, which has been a significant barrier in the past. However, this level has proven to be tough for the bulls to break through, and we're now seeing signs of potential exhaustion.
Key Levels:
Resistance:
$5,620 - $5,630: This is the zone where the price is currently facing resistance. It’s a crucial area to watch because a failure to break above it could result in a pullback.
Support:
$5,480 - $5,440: If we see a rejection from the current resistance, I'm expecting the price to retrace towards this support zone. This area has acted as a strong floor in the past, and it's likely where buyers might step in again.
Trendline Support:
The upward trendline, originating from the lows earlier this year, is still intact. This trendline could provide additional support around the $5,280 level if the price breaks through the aforementioned support zone.
Expectations:
Pullback Potential:
Given the current price action, I wouldn’t be surprised to see a pullback from this resistance zone. The first area I'll be watching for potential support is the $5,480 - $5,440 zone. A break below this could bring us down to test the trendline around $5,280.
Continuation of the Uptrend:
If the bulls manage to push through the $5,620 - $5,630 resistance zone, we could see a continuation of the uptrend with a possible target towards $5,700 and beyond. But for now, I’m leaning towards the possibility of a short-term pullback before any further upside.
Food for Thoughts:
Right now, I’m closely watching how the price reacts around this resistance zone. A pullback could offer a good buying opportunity, especially if it holds above the $5,480 - $5,440 support area. On the other hand, a strong breakout above $5,630 would signal that the bulls are in control and could push the market to new highs.
Stay tuned for more updates as the situation develops! Happy Trading from Deno Trading!

SPX500 Will Go Down! SPX500 is going up
To retest a strong horizontal
Resistance level of 5401.12
And as the indces is in the
Downtrend we are bearish biased
So after the retest we will be
Expecting a bearish continuation !

Is this a SELL SIGNAL for S&P 500 this week???Technical speaking, we have predicted that last week, the s&p 500 might started to rebound, since we've seen three to four bearish candles before trend reversal in the past pullbacks, and last week was the forth candle of this pullback. And it just moved as we've predicted.
And for now, the price is still rebounding from overall bearish market. So this week, we might pay close attention to the ending signal of this rebound, for example, the price be rejected by the resistance of previous low.
Key macroeconomic dates include the U.S. releasing the July PPI on August 13, the July CPI on August 14, and the so-called "dreaded" July retail sales data on August 15.
Also, Japan will release its Q2 GDP, likely stirring the pot again with yen carry trades.
In political news, the latest Financial Times poll shows Harris with a 1% lead over Trump in the presidential race.
I think from economic reports to the election, all could drive more volatility in U.S. stocks. Investors should keep a close eye on market movements and manage their risks accordingly.

SPX500 Rising Wedge !SPX500 is trading in a local
Downtrend and the price
Has formed aRising Wedge
pattern and we are
Already seeing a bearish
Breakout so we are
Bearish biased and we
Will be expecting
A further move down !
