Spx500short

SPX500 Short Setup$SPX500 Long Setup
🔵 Entry Level: $4560.0
🟢 Take Profit: $4500.0 (2.31R)
⛔ Stop Loss: $4586.0
Reasons:
- Reached upper trendline in a descending channe

S&P 500 (SPX) | Best point for sale🎯Hello traders, S&P 500 in daily timeframe , this analysis has been prepared in daily timeframe but has been published for a better view in 2 day timeframe.
In the wave count of this index, we are in wave 5 or one of the microwaves of wave 3, and we examined this wave or microwave.
This wave completes its main waves 1, 2 and 3 and is now inside wave 4.
We considered the possibility of the formation of wave 4 from this region according to the Fibonacci range of wave 3 relative to wave 1.
This wave 4 will be deeper than wave 2 and will be medium in time.
The probability of correction to Fibo 0.618 is very high.
In general, to confirm wave 4, we prioritize breaking the trend line.
🙏If you have an idea that helps me provide a better analysis, I will be happy to write in the comments🙏
❤️Please, support this idea with a like and comment!❤️

SPX S&P500 Black Friday Discount ?This chart looks like a giant rising wedge pattern.
This pattern shows up in charts when the price moves upward with pivot highs and lows converging toward a single point known as the apex, suggesting a reversal pattern frequently seen in bear markets.
Looking forward to read your opinion about it.

SPX to 5000, then big correctionFollowing weekly chart.
There was a big cup & handle formation that takes 16 years. After breakout in the beginning of 2017, target was 3350 and.
After hitting the target, covid broke out!
Actually it was a big corection of this 4 years trend.
Then, a new cup & handle formation formed and it broke the resistance at January 2021.
Target is 5000 and we're really close to this target. After that, my plan is to short till red line.
But important part is there is still a GAP in 2574 and what if we hit there?

S&P500 Short SetupSPX500 Short Setup
🔵 Entry Level: $4714.3
🟢 Take Profit: $4632.6 (2.61R)
⛔ Stop Loss: $4745.6
Reasoning:
1) Resistance level
2) Expecting divergence in the RSI Candles indicator
3) Yet to test the lower trendline of the ascending channel

S&P 500 – crash is incomingHello, everyone!
The largest risk is incoming for all markets – traditional, crypto and other. The euphoria on SPX is going to the end. I analyzed the weekly timeframe and found the strongest price reversal signal. We can see that the divergence with the MACD histogram began to form for a long time, but now the MACD almost flashed the signal to reverse: the divergence appeared even on MACD line. In this case we should wait for the first decreasing bar of the histogram and short the market. It can appears already on the next week. Be very careful!
Moreover the price is approaching the yearly R2 pivot. This is another evidence of the potential reverse!
DISCLAMER: Information is provided only for educational purposes. Do your own study before taking any actions or decisions at the real market.

SPX500 US500The s&p500 is still looking very frothy today as we still see weak sentiment with no bids above 4660.0 after euro session close i see a deeper sell off into yesterdays low for as long as we don't break 4660 and hold above that price.

winter is commingbased on the chart and my fundamental analysis, the s&P 500 won't have a good year in 2022 and it's gonna be mostly falling. I think the falling will start with the technology sector and continue to others. I will post my fundamental review soon so follow me to get notified.

3,70% could be the next move down Expect we will reach lower from the ATH - First step could be 3,70 % the cumming week. But stay safe, we´re running the Q3
Could be a db top or IHS
What do you think?

SPX500 Short SetupS&P500 Short Setup
🔵 Entry Level: $4577.3
🟢 Take Profit: $4532.0 (1.31R)
⛔ Stop Loss: $4612.0
Reasoning:
1) We formed a double top and while the Risk-Reward-Ratio is not very favorable (just 1.3) the setup does provide for quick scalping.
2) With that being said, considering the spread on the platform you are trading (or commission) and the weekend fees (if the target doesn't get hit which is very likely) this trade wouldn't make too much sense, but I decided to share my thoughts just in case.

US500/SPX: Correction NeededWhat a year for SPX, this was by far the most incredible bull run I have witnessed.
The bull run can continue however I would like to see a correction in the price for discounts to buy.
Now that the majority of sellers have been taken out of the market, it could be time to start seeing those retracements in price as illustrated.
What is your view? Don't forget to leave a like and a comment.

THE GREAT CRASH IS COMING! This Fractal Pattern Tells Us Why!Hello friends! It's been a while. Many apologies for that. Life has been busy so I haven't been able to dedicate much time to T.A on TradingView.
I have recently pulled out of Crypto, just waiting to see if Bitcoin decides to break-through or crash. Patience is key here - keep cash handy. You want to be sure of your investments (easier said than done in these very strange financial times).
I have been researching the U.S Economy lately. How is it that in that there is no correlation between the workforce economy and the stock market?
The U.S have recently averted default (when you're unable to make a repayment) by once again - lifting the debt ceiling to 28.9 trillion US dollars (yes, that is correct). This situation, better known as Cockroach Motel is a game that has never been played to this extent before. Keep avoiding a recession by printing your way out of it. Negative consequences? Yes. Many.
Here is a dump of my notes and why the US isn't in as good as a position as you may believe:
✓ Uncontrollable Inflation due to the U.S's printed economy.
✓ Debt highly leveraged across all trading firms.
✓ Feds left with no further tools due to 0% interest rates.
✓ Commercial property vacancies increasing.
✓ Energy shortage crisis in Europe and China.
✓ Rising expenses, declining incomes.
✓ Gas and oil prices at an all time high in Europe.
✓ Commodity prices at highs not seen since 2011.
✓ Irresponsible government spending and federal policies. (Yes, the Biden Administrations 'Build Back Better' agenda is a little too pricey for their current situation)
✓ Evergrande and Fantasia Holdings on the brink of bankruptcy in China.
✓ 2008 GFC was the housing bubble crash. Every asset is currently in a bubble. We are in a debt crisis.
✓ 40% of the money in the US economy has been printed in the last 12 months - now more. Feds have printed their way out of the 2008 and 2020 COVID-19 recession and made the debt bubble larger.
✓ Effective Federal Funds Rate is down to 0.8% - cheap money.
✓ Post 2008 recovery is an ongoing untried experience.
✓ Market is currently parabolic, as seen in 1929 crash which results in 90% drop.
✓ Wealth gap is increasing due to printed money. Asset prices increase as yearly salary stagnates/decreases due to inflation. This makes the rich richer and the middle class and poor poorer.
✓ No correlation between the economy and the stock market. Money is staying in the investor market.
✓ Velocity of money is plummeting. People are not spending. The Chinese economy is growing while we are stuck with a massive debt.
✓ Saving going up and spending going down. Debt/GDB ratio is extremely high.
✓ Huge underemployment.
✓ Massive social unrest. Fed and treasury haven't invested in the working class.
✓ Superannuation is going to crash which will force many to convert their portfolio to liquid money.
✓ Armed the Taliban in Afghanistan. Weapons will be used against our only ally, Israel.
✓ Yallan and Powell work for the Fed and treasury which is essentially a communist organisation.
✓ Bullish Gold, Silver and BTC
✓ Michael Burry and Robert Kyosaki predicts crash of 90% and American financial system collapse
✓ The US Government is inviting inflation with its MMT tinged policies, brisk debt/GDP ratio, M2 increases while retail sales, PMI stage V recovery. Trillions more stimulus and reopening to boost demand as employee and supply chain costs skyrocket
✓ Consumer price index reaching all time highs.
✓ Biggest speculative market of all time - Robinhood generation
✓ Real-estate is currently experiencing hyperinflation.
Back to the Chart:
I found a fractal pattern from the 2008 GFC which is quite similar to this crash. I wouldn't compare it to the Dot Com bubble as that was far more speculative. This crash is similar due to greed - the belief that the economy will never crash and just continue in the upwards direction despite increasing debt at levels never seen before.
Enjoy this fractal and better yet, enjoy the rest of your day.
Love, peace, Seb.

SPX S&P500 double top?After calling the dip of SP500 here:
Now SPX just hit a strong all time high resistance that can turn into a double top from which we can expect a pullback to 4430usd.
Let`s not forget also that one of the FAANGs just lost 42.5Bil in post market because of a rival platform, TRUTH social, owned by former president Donald Trump.
And who knows how much they will lose tomorrow!
I`m looking forward to read your opinion about it.

SPX500 Short SetupS&P500 Short Setup
🔵 Entry Level: $4539.1
🟢 Take Profit: $4482.8 (2.16)
⛔ Stop Loss: $4565.2
Reasons:
- I'm expecting a test on the $4522, flipping resistance into support
- Then potentially a double top can form at the entry level, which would open an opportunity for a short

SPX500 Short SetupSPX500 Short Setup
🔵 Entry Level: $4486.0
🟢 Take Profit: $4426.9 (1.28R)
⛔ Stop Loss: $4532.1
Reasons:
- Reaching resistance level at $4485
- Expecting either divergence or highly overbought level on the PVS Indicator by the time price reaches that level.
Game plan: If the price flips this resistance into support (tests it), I may close the trade prematurely and open a long trade until the next resistance level is reached at $4548

S&P500 CORRECTION SEQUENCE IIWave ''A'' completed as 3 wave as ZIGZAG subsequently, Wave ''B'' completed as FLAT.
Wave''c1'' corrected above 38,2%of Wave'A' (minimum requirement of wave 'c') and wave c2 is yet to finish by 15th OCT
If it halts at either4407 (61.8% of c1) or 4431(100%of c1) as per NEO wave logic we can expect c3 will unfold .
Hence short positions can be taken below 4327

SPX 4250A break below the 4250 level would be very bad!
SPX broke below the long term support line on Sept 16 and after retracing and getting rejected by the same trendline on Sept 24, now forming a H&S pattern.

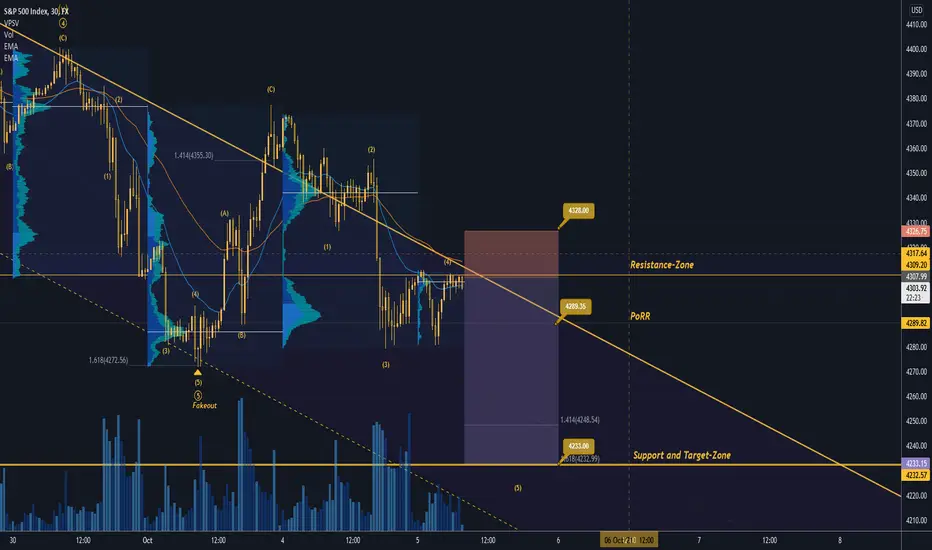
SPX500 SELL IDEAHey tradomaniacs,
welcome to another free trading-setup. After a successfull LONG I`m planning to short this baby for a pullback or to follow the current trend!
SPX500: Daytrade-Preparation
Market-Sell: 4308.28
Stop-Loss: 4328.00
Point of Risk-Reduction: 4289.35
Take-Profit: 4233.00
Stop-Loss: 190 pips (19 points)
Risk: 0,5% -1%
Risk-Reward: 4,0
LEAVE A LIKE AND A COMMENT - I appreciate every support! =)
Peace and good trades
Irasor
Wanna see more? Don`t forget to follow me
SPX500 SELL IDEAHey tradomaniacs,
welcome to another free trading-setup. After a successfull LONG I`m planning to short this baby for a pullback or to follow the current trend!
SPX500: Daytrade-Preparation
Market-Sell: 4357.00
Stop-Loss: 4370.00
Point of Risk-Reduction: 4341.00
Take-Profit: 4283.50
Stop-Loss: 130 pips (13 points)
Risk: 0,5% -1%
Risk-Reward: 6,0
LEAVE A LIKE AND A COMMENT - I appreciate every support! =)
Peace and good trades
Irasor
Wanna see more? Don`t forget to follow me

S&P 500 update after the Evergrande crisisHello everyone, as we all know the market action discounts everything :)
_________________________________Make sure to Like and Follow if you like the idea_________________________________
China Evergrande Group has missed a second bond coupon payment in as many weeks, renewing concerns over its ability to repay over $300 billion in liabilities.
This Showed an instant effect on the market, the S&P 500 by dropping almost 2% today it went from 4377.41 to 4301.01 and because Evergrand seems to be heading into default and the grace period of 30 days has started, This could be the start of a big market crash that is similar to the Lehman brothers crises that caused the 2008 crash.
Possible Scenarios for the market :
Scenario 1 :
The markets seem to be heading in a Bearish way that will cause a further drop in the market and the first stop will be the support level located at 4248.77 and from there the market will have a chance to stabilize but for that to happen the Bulls need to step in and gain control over the market in hope to prevent a further drop.
If the Bulls were able to gain control then we will see a bounce of that support level that will lead the price back near the 4347.83 level.
Scenario 2 :
After the market reaches the first support at 4248.77, The bears most likely will not allow the Bulls to gain any control which will lead to a breakout of that level that will lead into a further drop possible leading into the 4191.93 levels which could be an early warning signs for a crash in the Economic world.
Technical indicators show :
1) the market is below the 5 10 20 50 100 MA and EMA indicating a Bearish short/mid trend, and still above the 200 MA and EMA that indicates a Bullish Long-trend.
2) The RSI is at 34.17 showing weakness in the market with a strong chance that the indicator will go into the overbought zone.
3) The ADX is at 30.35 showing that the market is trending, with a negative crossover between DI+ (12.33) and DI- (36.94).
Weekly Support & Resistance points :
support Resistance
1) 4352.12 1) 4512.31
2) 4248.77 2) 4569.15
3) 4191.93 3) 4672.50
Fundamental point of view :
Asian equities followed Wall Street sharply lower and bonds rallied on Friday, as risk sentiment soured amid growing worries that inflation may persist even after global growth has peaked.
U.S. stock futures pointed to a 0.60% decline for the S&P 500, following a 1.19% drop in the index overnight that punctuated its worst month since March of last year.
Federal Reserve Chair Jerome Powell said on Wednesday that resolving "tension" between high inflation and high unemployment is the Fed's most urgent issue, acknowledging a potential conflict between the U.S. central bank's two goals of stable prices and full employment.
China has proved another particular worry for investors: the economy took a hit from regulatory curbs in the tech and property sectors and is now grappling with a power shortage that threatens to push up energy prices globally. According to reuters
Concerns over China Evergrande Group have put investors on edge and added to recent worries over economic growth from the Delta variant.
This is my personal opinion done with technical analysis of the market price and research online from Fundamental Analysts and News for The Fundamental point of view, not financial advice.
If you have any questions please ask and have a great day !!
Thank you for reading.

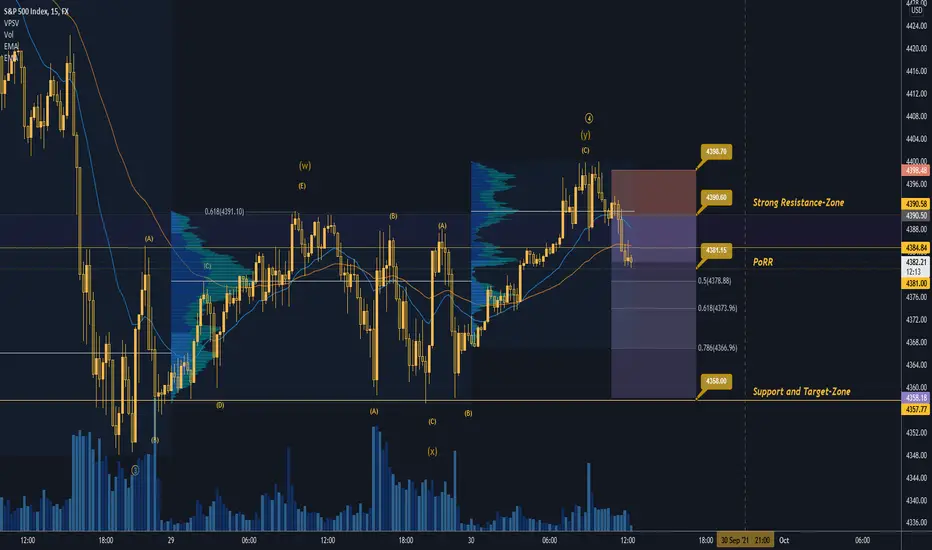
SPX500 SELL IDEAHey tradomaniacs,
welcome to another free trading-setup.
Notice: Volatility during US-Openign very likely. Rather stay out then with tight Stop-Loss!
SPX500: Daytrade-Preparation
Market-Sell: 4390.60
Stop-Loss: 4398.70
Point of Risk-Reduction: 4381.15
Take-Profit: 4358.00
Stop-Loss: 81 pips (8,1 points)
Risk: 0,5% -1%
Risk-Reward: 4,0
LEAVE A LIKE AND A COMMENT - I appreciate every support! =)
Peace and good trades
Irasor
Wanna see more? Don`t forget to follow me
The most important crossing since Covid's low, Golden Cross !!!!What Is the Cboe Volatility Index (VIX)?
The Cboe Volatility Index (VIX) is a real-time index that represents the market's expectations for the relative strength of near-term price changes of the S&P 500 index (SPX). Because it is derived from the prices of SPX index options with near-term expiration dates, it generates a 30-day forward projection of volatility. Volatility, or how fast prices change, is often seen as a way to gauge market sentiment, and in particular the degree of fear among market participants.
The index is more commonly known by its ticker symbol and is often referred to simply as "the VIX." It was created by the Chicago Board Options Exchange (CBOE) and is maintained by Cboe Global Markets. It is an important index in the world of trading and investment because it provides a quantifiable measure of market risk and investors' sentiments.
KEY TAKEAWAYS
The Cboe Volatility Index, or VIX, is a real-time market index representing the market's expectations for volatility over the coming 30 days.
Investors use the VIX to measure the level of risk, fear, or stress in the market when making investment decisions.
Traders can also trade the VIX using a variety of options and exchange-traded products, or use VIX values to price derivatives.
