S&P 500 - Standard & Poor's 500 IndexThis will be my final analysis on the Standard & Poor's 500 Index until the market bottoms out.
I urge all investors that have extreme long exposure to exit the market due to economic uncertainties and political agendas
Vaccinations leading to a 3rd wave has created an economic situation we have never experienced before.
Markets are currently topped out and in an extremely overbought territory!
Most stocks are in bearish momentum
If anyone is looking for trading assistance you can contact
maverickassociates.wixsite.com
Spx500short

Entering Danger ZoneMultiple Fibonacci indicators overlay right around this red zone.
Large area of resistance.
RSI is very overbought now, similar to other peaks.
But whatever... Just keep buying it if you want. Money printer go Brrrr.
I bought more puts. What can I say? I like hurting myself.
I don't care anymore, and am a very depressed bear today.
Hopefully these feelings indicate that we're near the top, cause I feel like giving in to the bulls, but I'd rather go bankrupt at this point.
Or... is it since I think that about my feelings that that means those feelings are right..?..uhhh....
I would curse, but then they'll block my post because you know, censorship. I need a smoke.
(Not financial advice. Just what I see.)

S&P500 US500 Short IdeaWe have seen a very bullish move from the US500 lately, with the past 10 days seeing 9 bull candles, and the only bear daily candle at 18 points down in a 220 point tear creating new ATH's.
What Now? Is it time to short? Will this keep going higher? Is it risky to sell here?
The answer to all these questions in my opinion is Yes. In my view, it is time to short purely based on the fact that NFP is now out of the way, EOM done, and earnings season is upon us. Profit takers have been holding off due to the bullish move, however we know that moves like this don't last long, and we are due a correction candle.
From this level, I would be looking for a 50 point+ correction to the downside, before we continue towards the 4400 zone. My target zone for TP on shorts are 4260 and lower, primarly due to the sole reason we must return back here.
Could this be another move similar to the one we saw late march to mid april? Yes but it's unlikely as that was a very very good run. It was however EOM and end of the quarter, so we at least know that if this is following in the same steps then we are approaching the top before a large correction, however as I mentioned, it is unlikely this has more gas in the tank to continue before stopping and refuelling. We have gone through the 4200 level far too quickly.
THe S&P 500 will continue to move up, there's no reason for it not to. Everyone is prepared for a market crash and we all know a crash never happens when everyone is prepared.
If you enjoy the analysis please leave a like and give me a follow for more!

SPX500 ANALYSIS - IS THE BULL RUN LOSING STEAM ? HELLO TRADERS
WE'VE NOTICED SOME WEAKNESS AND BEARISH PRICE
ACTION ON SPX500
COULD SEE A DOWNSIDE MOVE TO CLOSE OUT THE WEEK!
AS ALWAYS, ONLY RISK WHAT YOU'RE WILLING TO LOSE!
THE TRADING REGIME.
OANDA:SPX500USD

SPX500: double entry intraday tradeHi Traders,
This is my view on this pair for the next few days
#SPX500
Double entry (wait for evidence after NY opening)
SELL 4255
SELL 4257
SL 4262
TP 4240
I remind you that this is only a forecast based on what current data are.
Therefore the following signal will be activated only if specific rules are strictly respected.
If you follow my strategy you will be able to identify the right filters and triggers to enter correctly the market and avoid fake signals.
I really hope you liked this video and I would like to know what do you think about this analysis, so please use the comment section below this video to give me your point of view.
Thank You
———————————
Pietro from Trading Kitchen

Selloff StartedWe've broken the major support line for our uptrend, implying that the bulls are no longer in power. Watch the weekly candle that will close soon. It looks like a bearish engulfing weekly candle that could engulf the last 2-3 weeks.
I am a bear. Keep that in mind, BUT, look at it!
(Not financial advice)

S&P500 O TEST 4133 ENDING DIAGONAL OF 5 TH WAVE ENDED AT 4257.
CORRECTIVE WAVE ABC BEGINS
Wave "C"of ABC correction bring s&p 500 INDEX TO 4133 as C= 1.618 of A

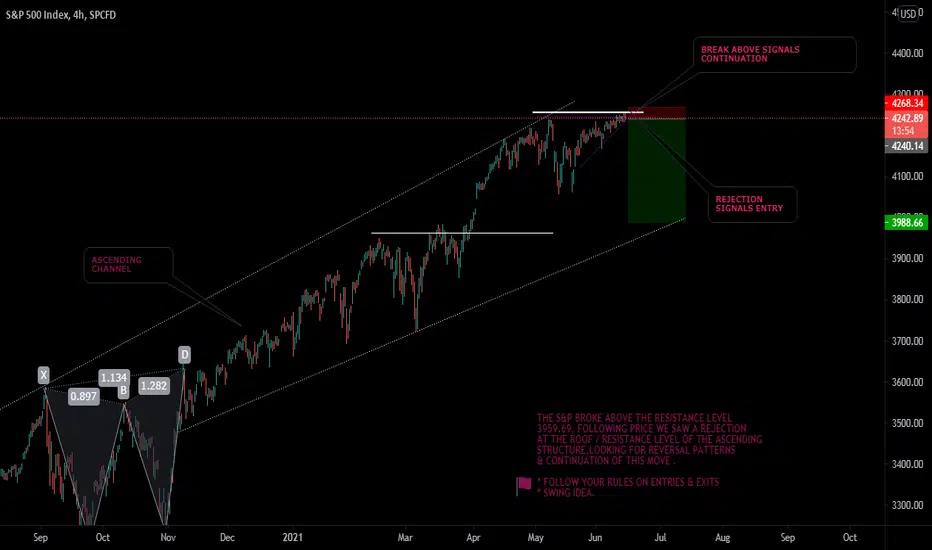
SPX 4244.28 - 0.25% SHORT IDEA * PRICE ACTION & STRUCTUREHELLO EVERYONE
HOPE EVERYONE IS DOING GOOD HAVING A GOOD ONE, READY FOR THE MARKET THIS WEEK, HERE'S A LOOK AT THE SPX 500 INDEX FROM THE 4 HOURLY CHART.
The index is currently at a significant resistance level, will be watching price for reversal patterns and or breakout patterns.
IF THIS IDEA ASSISTS IN ANY OR IF YOU LIKE THIS ONE
SMASH THAT LIKE BUTTON & LEAVE A COMMENT.
ALWAYS APPRECIATED
____________________________________________________________________________________________________________________
* Kindly follow your entry rules on entries & stops. |* Some of The idea's may be predictive yet are not financial advice or signals. | *Trading plans can change at anytime reactive to the market. | * Many stars must align with the plan before executing the trade, kindly follow your rules & RISK MANAGEMENT.
_____________________________________________________________________________________________________________________
| * ENTRY & SL -KINDLY FOLLOW YOUR RULES | * RISK-MANAGEMENT | *PERIOD - SWING TRADE

potential bearish crab on $spyJust a crab... not a blind short call, still been wary of a correction to come soon, as long as these recent highs not taken meaningfully the potential for a dive (and likely a fast one is here).


SP500 - SHORT; Nothing but Shorts (SELL!!) here!A ~25% decline from here should be rather quick and uneventful. However, such a decline is likely to be just the first leg on a long road to a full ~70% decline by the end of this full cycle. - Which would be nothing more than a garden variety return to the Historic Norm ! The same goes for all US Indexes and those who are historically informed (or reviewed the evidence, presented in virtually every single recent post) should not be surprised at all.
The Carry Trade Currencies - and equivalents relative to the VIX post;

Short S&P 500Hello everyone, one of my best analyzes. We are near the end of a cycle, it should end before 2027. The fibonacci retracement follows the crash of 1929, which is also the start of the uptrend. We can see that we have only exited the yellow channel twice. Once from 1997 to 2001 and again from December 2020 to today. The bullish trends inside the bullish channel end when the white support line is broken. The second bullish base lasts about 70% of the time of the first, if we project that the third bullish base should last around 6500 days. When we have been above the 2 years * 1.2 EMA there has been a decline each time, we are currently above that moving average. The RSI: We can see that every time we hit or cross the 77, it follows a decline. Crashes are preceded by a bearish divergence, there is currently an unconfirmed bearish divergence. The crashes lasted 2250 days and 3100 days, each time we returned to the previous level of fibonacci and the channel support. If this is repeated we can expect a drop of more than 35% from the current level.

STOCKS with a fake-rally?Good evening guys!
Damn.. what a sudden pump in the equitiy-market today ignoring all resistance-zones.
"Wall Street's main indexes opened higher on Thursday after weekly jobless claims hit their lowest level since the start of a pandemic-led recession."
To be honest: When I saw the jobless claims I was pretty confident for our trades as good economic data should increase the likelyness for a tighter monetary policy in the future and did not even consider to early exit.
That is by the way what I`ve mentioned with "it is tricky" as we don`t know how the market is going to react.
When I look at the entire market I expect this move to be a trap for "liquidity-monkeys" giving big players good prices to distribute more of their positions.
NZD/USD () aswell as AUD/USD () are both looking bearish to me not really following the todays risk-on-mood.
The volatility in the crypto-market is also showing less risk-appetite as Bitcoin moved up to 43.000 is currently below 40k, of course also caused by news from the USA (worries about the anonymity, money laundering etc.)... All very fishy to me...
However, EUR/USD is closed with -25 pips (-1%) aswell as NAS100 -160 point (-1%), while AUD/JPY and NZD/JPY are both still active looking goos for now as major supply-zones are holding.
For now I will observe how the market acts at the current highs and will check the volume before I execute any further trades.
Fundamentally it`s clear to me: Inflation aswell as the provided liquidity pushed equities and caused the entire rally.
More positive news from the USA should hurt the stockmarket and boost the demand for the US-Dollar as many shaky hands are sitting on their profits!
Crazy market! ;-D

SPX500: my multi-timeframe analysisHi Traders,
This is my long-term overview of SPX500 on a Wyckoff point of view
I remind you that this is only a forecast based on what current data are.
Therefore the following signal will be activated only if specific rules are strictly respected.
If you follow my strategy you will be able to identify the right filters and triggers to enter correctly the market and avoid fake signals.
I really hope you liked this video and I would like to know what do you think about this analysis, so please use the comment section below this video to give me your point of view.
Thank You
———————————
Pietro from Trading Kitchen

$SPX - memeline shortMemeline supporting uptrend has broke
Backtest of underside of SR
Seems a good bet especially with growing inflation concerns
Close through the SR box would make me re-evaluate and likely close though!

S&P Fast Recovery Can it Continue?S&P500 has seen a quick recovery after last week's sharp sell-off. We're currently facing some resistance right now. Will the bullish momentum continue?

S&P 500 Could face a serious troubleFrom bottom to top SP500 received almost 95%, optimism could be observed across capital markets including cryptocurrencies.
From my point of view, it is possible to observe several signs of potential threats that can be validated over days or even weeks.
First of all I would like to point out triple bearish divergence on WEEKLY timeframe . In this case I would look for a potential break down and then retest back the trendline. For me it would mean a small '' breath in '' before a possible crash. Also 1,618 was hit (size of correction movement back in 03/2020). If you look at past crisises these levels were everytime hard to break up, and corections were often.
Secondly VIX seems so ready to shoot, validation of trendline is real and for me potential minimum target is around 33 points. More in screen:
Gold and TLT might reached possibly their bottoms, since these could work as hedge - makes sense some investors rotate to these instruments. On TLT graph you can see an increase in volume , and also TLT / JNK broke the trendline from 03/2020
Gold and Silver YTD haven't reached some nice profits yet in contrast, other commodities did. Gold seems ready to potential breakout.
And finally the irrationality on cryptocurrencies reaching full new dimensions (doge, shiba, elonsperm etc ..) - Everyone has crypto and its so easy to profit from that. Reminds me 2017 so much and history tells that when BTC reached new all time high, there is space for ETH, LTC and other altcoins to reach their new ATHs. Everytime BTC moved sidewaves - theoretically for distribution purposes. So for me this is the sign of a peak of bulltrend.
Overall the break on SP500 would possibly strand for validation this idea otherwise its irrelevant.

SPX500: Will price finally DROP harder?Hey tradomaniacs,
It is getting a little bit tricky now for the stockmarket with the so called "stagflation" showing higher prices for assets and consumer goods (inflation) while the economy stagnates. 👉 An example is the yesterdays weak U.S ISM Index while prices generally rise (Wood,Wheat,Coffee,Gas etc.)❗️
So the question is: How can the central banks continue with an ongoing inflation in order to support the economy to stop the stagnation? Is more stimulus possible even though prices seem to explode? Or is the bubble ready to pop soon and we see a correction and a strong US-Dollar?
The mood is overall upbeat in terms of corona as the investment rate in the USA is really high indicated by a margin-debts but the U.S.-Stockmarket is overall not really moving upwards anymore, which could be a typical "buy the rumor sell the fact" scenario. Also keep in mind that many private-investors are currently invested providing a great opportunity for biggies to take profits / distribute volume.
Is the best of all possible worlds price in? However, I will be very cautious right now and watch the market carefully and focus in short-term-opportunities.
LEAVE A LIKE AND A COMMENT - I appreciate every support! =)
Peace and good trades
Irasor
Wanna see more? Don`t forget to follow me

#S&P500 CAUTIOUS !#S&P500 cautious!
- Now it has gone too far.
- In order for the SPX uptrend to be sustainable, 2 correction cases should occur.
+ Case 1. Back to the MA50 green line, the yellow support line confluence.
+ Case 2. Back to the MA200 red line, the yellow support line confluence.
#S&P500: time frame weekly, cautiously with 2 candlesticks on the top , The RSI is in the overbought zone, the increase is not much.
#S&P500: time frame daily, a sign of a bearish divergence?

SP500 Final Top??... Only SHORT Entries from here!!Expecting an initial -25% drop, then an additional -60%. (For a total of -70%, minimum - full cycle!)

UVXY. P-Modeling Pt E. Binary Transmutation of DecayWelcome Hyperspace Travelers,
This is my first public UVXY Macro Time-Series Analysis in a very long time.
This ETF is going to change lives. Of course though, you are going to doubt every word spoken below. Because who would believe such nonsense?! I hear you mate. I here you. :) But let's talk and walk into the unknown for a moment.
VIX is a First Order Derivative (FOD)
UVXY is a Second Order Derivative (SOD).
Pegged Derivatives MUST have a Function (^)
Every (FOD) and (SOD) must be pegged to a 'mother analog'. In this case that would be the { S&P 500 Index }.
The (FOD) and (SOD) are (^)'s of Volatility within the S&P 500 Index.
UVXY being a derivative of a derivative means these step cycles are intricately woven in the data pool using simple Standard Deviation topography that are noise free.
Decay is step-cycled compression based on 30-day rolling contract averages of the First Order Derivative (FOD) - VIX
The Kinetic Energy is stored over longer Time-Frames from (FOD) step-cycled decay in the Second Order Derivative (SOD) - UVXY.
Unraveling Compressed Decay is straightforward based upon the Order of Derivative (OOD).
These are IF .. THEN statements.
IF...2:1 VIX unravel = THEN... $270.00
IF... 8:1 SPX unravel = THEN... $800.00
Furthermore,
The (SOD) is a primary function of the S&P 500 Index. That function is Volatility to the Second Order.
In order for UVXY to hit $270 or $800 we have to have comparable targets for the S&P Index.
You can find the SPX Time-Series here--->
Micro_45 Minute Time-Series Snapshot. Fractal Error Time 7 Days:
SPX strike: $1080.00 could = 2:1 VIX unravel and/or 8:1 UVXY unravel
UVXY strike: $215.
UVXY strike: $270.
UVXY strike: $360.
UVXY strike: $500.
UVXY strike: $800.
4 STD strike potential: $1200.00
________________________
UVXY-->>
Cycle of 390 days, Event Trigger 30 days.
IF.. we followed the same cycle pattern.. THEN.. we should see events take place that trigger waves of volatility in FOD and SOD against mother analog SPX.
Time-Series Snapshot of Cycle Breakdown with compression mechanic.
SPX-->>
Wavefunction Compare between 2000-2008 and 2021.
Euclidean 80 year top boundary backtest.
-75% to SPX Index in 2021.
One of the Catalysts:
2nd Global Shutdown due to Covid-19.
Understand the view brought forth is mine and mine alone. It is the work of creativity and thinking outside the box. You are correct not to trust a word I say. But what if?...
This proposition is very experimental in every sense of the word. Understand that. With that understood, the risk is extraordinary, but so is the reward.
High Risk = High Reward.
Only the crazy change the world. And baby, I am a whole lotta crazy.
The fractals provided that path the sequence shown for UVXY is a rough estimate. I do not expect exact actualization of fractals but merely something similar. There are a variety of possibilities of course.
99% of you doubt. Please doubt. But also be open minded to metrics unseen by the classical viewpoint.
The error of fractal placement is 7 days.
Maybe I am wrong...
Maybe I am right...
Either way..
Good Luck!
That is the fun thing about binary decoding.
The cat is alive and dead at the same time.
Welcome to the 4th Industrial Revolution
Welcome to the Cybernetic Era of Advancement
Welcome to the Depths of Hyperspace
Welcome to the Roaring 20's,
Thanks for Pondering the Unknown with Me,
Glitch420
