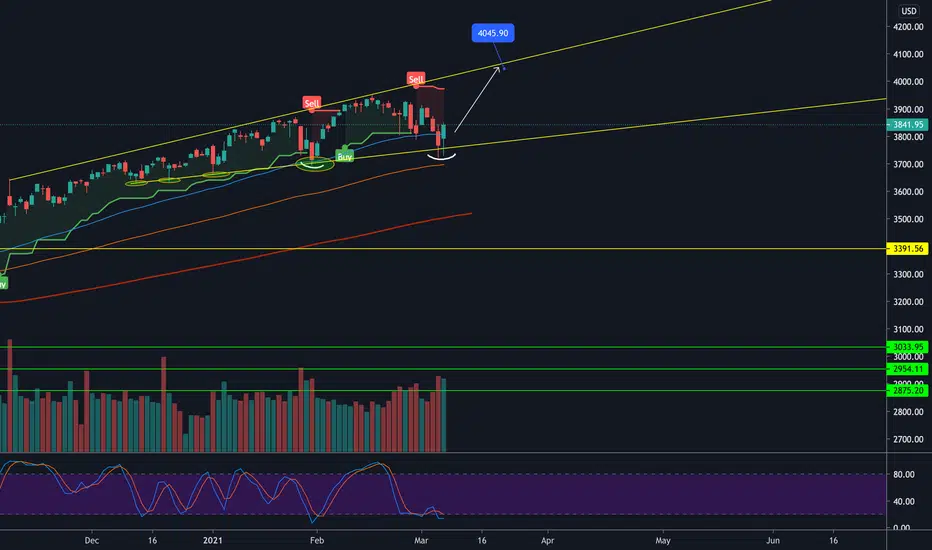
SPX500- Bullish Megaphone Pattern (or Bull Trap)Please do your DD.
Watch out for the bounce from the trend line which will confirm the bullish megaphone pattern and trap a lot of shorts.
But if it breaks the trend line to the downside then we could be going down to 2000 on SPY
Be careful out there and do your DD before investing.
Spx500short


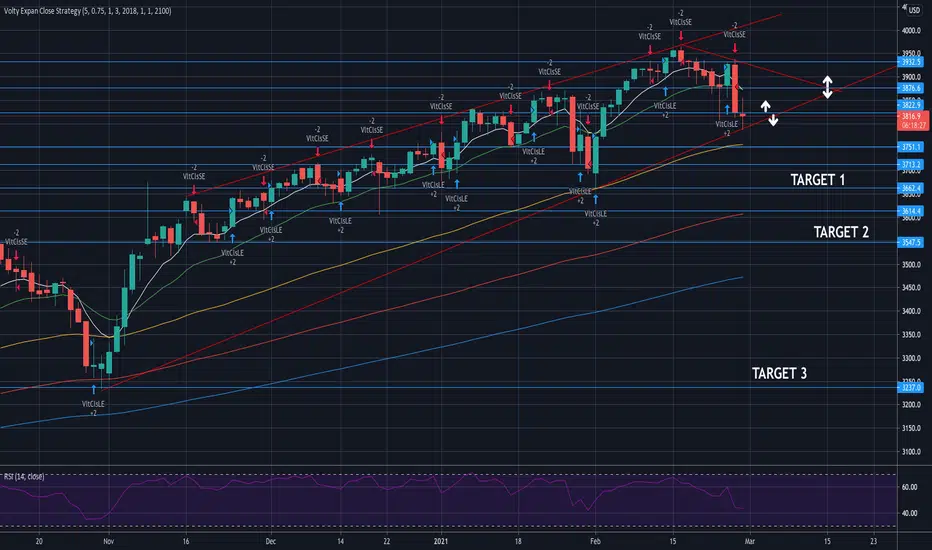
$SPX - Short Now 3835Just an Idea I have marked up on the charts that once it reached this level 3835 to short.
If you want to stretch out the chart, the orage lines signify areas to watch for either taking profit or possible pivoting to the bullish side. So this could be some scalping and not a long term move. But I have a feeling there's a liquidity draw further down around 3720 which could make this a longer term move.

SPX500 going to 1.618 Fibonacci ExtensionWe could likely see a 1.618 fibo extension top and then the start of a bearish trend due to debt collapse.

SPX BearishBased on the fundamentals, we believe the stimulus has already been priced into the markets. Technically, we are seeing lower highs and lower lows. Both the technicals and fundamentals give us reason to be short SPX (only for short term). If you have heard the famous saying, "buy the rumor, sell the news" then you can tell that this may be one of those instances. The stimulus news came after Biden alerted the country that stimulus checks will be sent out. That is when assets started seeing some volatility and we believe the volatility will increase as the week progresses, mainly to the downside. Adding hedges such as puts may be a great decision in times of uncertainty. We believe the uptrend will resume when SPX hits either one of the bottom targets. Trade safe. - HH

It doesn't get much more obvious than this.Chances are good that the charts for AMEX:SPY and TVC:SPX will continue to print repeated patterns. They have been doing so for an entire year, so I don't expect them to suddenly change trajectory. I honestly expect the market to crash within a week--if not tomorrow--judging by this fractal. And although it is not shown in this post, there is also major bearish divergence on the RSI for the weekly and monthly charts and bullish divergence on the same timeframes for the VIX . It sure will be interesting to watch. Good luck to all.

SPXLooks like a back test that was successful & now resistance has become support. If not then lower EMAs can be targeted 3795 3600 etc. But with stimulus talks tomorrow at the White House 1.9T is on the table, markets should love this news IMO.

S&P 500 corrective wave (A) pullback, New Butterfly A move back into 3900 would suggest the S&P is unfolding into a corrective wave (A) pullback. Moving away from the analysis that wave (5) still has room to go, we are looking to establish a Put Debit Butterfly 3930/3750/3735 expiring March 19th 2021 to capitalize on this short term pullback while remain long on our portfolio for longer term upside exposure.

S&P500 Short SetupS&P500 Short Setup
🔵 Entry: $3,934.7
🟢 TP & RR: $3,903.0 (1.46)
⛔ Stop Loss: $3,956.4
Trade Reasons:
✔️ 1.618 Fib Extension
✔️ Reached previous resistance level

Short term perspective: Will SPX continue its fall?Markets have been driven by interest rate move in recent days. Expecting SPX to continue its weakness over the next few days.
But could there be bottom-fishing? I think it is likely.
Looking for price to retrace down to 3830 levels before rebounding back to 3900.
Let me know your thoughts.


SPX500 price movement target are right ?"Trading is not gambling
It is the games against the system"
You have any hesitation above the chart
Have any glitch on the BATBTC days chart ? i hope traders can properly indentify my charting glitch !
SPX500 expectation is rights?
SPX500 mine own perspective so what's your opinion on the SPX500 price movement please comment in the below section .

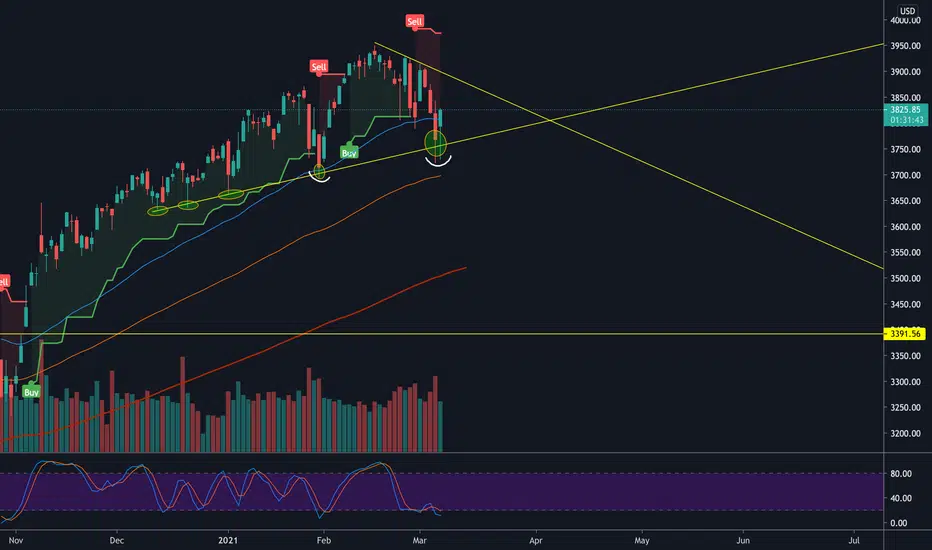
SPX500 could move UP! Hey tradomaniacs,
Looking at SPX500 we can see a good rally after the expected fakeout#5 from yesterday 👉
As you can see we are currently re-testing the previous trendline of the entire weird and volatile correction.
If this level holds market could continue with its previous breakout and start a new rally!
If not.. SHORT IT ;-D
LEAVE A LIKE AND A COMMENT - I appreciate every support! =)
Peace and good trades
Irasor
Wanna see more? Don`t forget to follow me


SP500 - SHORT; Look for a Short Entry, right here!Like the title says...
... and the Nasdaq100
... and the NDX/US30 (Nadaq/Dow)
... and the Dow/Gold from this post;

DOGE is just another PnD.Like it or not , but Doge have no intrinsic value or good fundamentals (crypto style : like limited supply at least at btc) and just another Pump and Dump scheme.
This is the cherry on the cake that still was not eaten like $GME, $AMC, $TLRY and bunch of other penny stocks.
All of this remind me a bit of 1929, 2000 when retail fomo is so insane , that they long everything and shoe shining average Joe gives you trading advice about markets. Why this is happening? Probably corona virus and money printing.
Will it last long? No. Frenzy will be over right when there will be no more lockdowns(will be frontrunned probably few months in advance. I'd say spring/summer 2021 most likely), and all this new tik-tok traders will end up devastated and bankrupt. Bankers will force gov to hike rates on dxy and collect that credits back forcing people into another finance depression.
Yes , it's a bubble burst scenario and it will happen sooner or later. Ponzies ain't lasts forever and you're all know it.

Short MarketThe market has reached its all time high creating a new higher high which can be treated as a resistance @3941.1 for now. The RSI suggests that the market has been heavily overbought on 30m chart and a recorrection is to be expected.
On 4hr chart the support level 3896.8 is constantly being tested and looks like the market will test this level one more time before making yet another bullish move. If bears break the supp levels expect the market to test zone @3877.7 to 3868.5 supp level.
Else the long move is to be assumed go up to 4017.0.
Supp levels:
3918.0
3894.5 --> getting weak
3877.7 to 3868.5 --> strong supp zone

PULLBACKS AND CORRECTIONS 2009 TO DATESWell, the chart speaks for it self. i Might have missed one or two :-).

SP500 & Channel.As you can see on these charts-the price is once again beating the channel resistance (purple dotted line). Perhaps the price will have to adjust to the level of $1950, equal to the Fibonacci correction of 0.618%. There is another more positive and desirable scenario for everyone - if there is very good news, the price will be able to gain a foothold above the purple line and go even higher-up to the pink dotted line.

Shooting Star forming W chartHi everyone,
It is too early to confirm it but if this candle close like this next friday on the W chart in Shooting Star or Gravestone we will have something to worry about.
Best to you !
