S&P500 Daily Lower Low - Correction is Now UnderwaySee related links below
RISK DISCLAIMER
Information and opinions contained with this video are for educational purposes only and do not constitute trading recommendations. Trading Forex on margin carries a high level of risk and may not be suitable for all investors.
Spx500short

SPX Correction Likely in the Weeks Ahead - Video Explanation RISK DISCLAIMER
Information and opinions contained with this video are for educational purposes only and do not constitute trading recommendations. Trading Forex on margin carries a high level of risk and may not be suitable for all investors.

SPX - 50% Correction from Recent Upswing is LikelyMight not happen this week, but I suspect once we get the next weekly lower low - look out!
RISK DISCLAIMER
Information and opinions contained with this video are for educational purposes only and do not constitute trading recommendations. Trading Forex on margin carries a high level of risk and may not be suitable for all investors.

VIX Adv formationHi traders
Vix gartley \ bat advenced formation.
If it gets to 28 - 28.6 area i will look for short.
While it climes up there the us market will go RED.
Lets watch
Drive safe


SP500 (Y20.P4.E2)Macro.Bullish channelHi All,
From a monthly perspective, all looks bullish.
On the daily, there is a 2 scenarios, both are bullish:
a) a breakout to the upside from here and
b) more ranging movement in this area, chart below before breaking up to the upside. completing an elliot ABCDE symmetrical triangle of some sort.
Hence a medium macro bull flag or consolidation just under the main resistance.
Note: USD is more bearish tone than bullish in the short term. Chart below.
From a weekly perspective we have the following:
Daily chart, (a.chart)
Note: DXY, USD has pulled back recently which gives gains for stocks. Still in sync with my original post, link below
Please give me a like or tick for this posting;
Regards,
S.SAri

S&P500 ShortIf the daily candle closes below the upper trend line we would like to short with confirmed price action on lower timeframes.

SPXUSD SELL TP_2.798_18.92%_651.20pips_SL_3.490_1.42%_48.90pipsSPXUSD SELL TP_2.798_18.92%_651.20pips_SL_3.490_1.42%_48.90pips

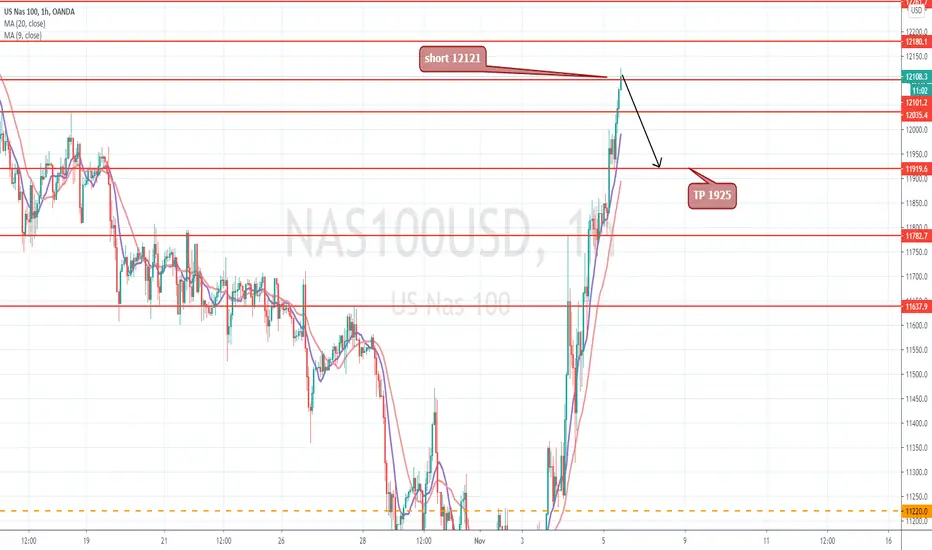
SHORT INTRADAY AT 12121 AND TAKE PROFIT AT 11925SHORT INTRADAY AT 12121 AND TAKE PROFIT AT 11925
mARKET UP ON bIDEN wIN BUTR REMEMBER HE WANT TO UP THE TAX ON TECH
ANYWAY I ONLY PLAY THE PULLBACK FOR NOW BEFORE THE FOMC/FED OR ANY NEWS ABOUT SENATE OR HOUSE FOR ELECTION
WHILE HE WILL TOUCH MY TP I WILL NOT CUT BUT MADE A TRAILING STOP
SO I ENTER WITH 2 X1 LOT
THE FIRST LOTR I WILL CUT ATR AROUND 12000 FOR FULL PROFIT AND THE OTHER I WILL PUT A STOP AROUND 12080 AND EVERYTIME IF HE DOWN I WILL ADJUST IT
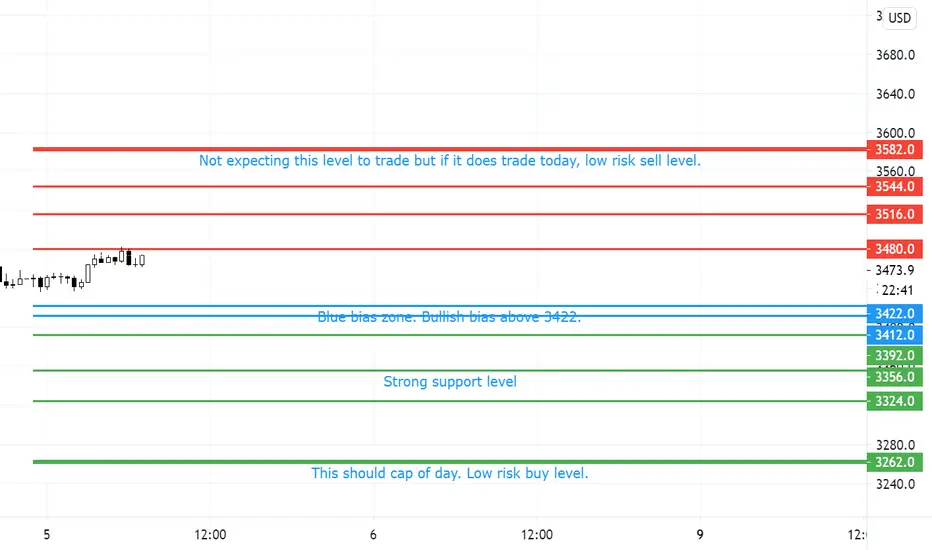
05/11/2020 #SPX #ES_F Bullish yes but pullback will be healthy
Yesterday was US Presidential Elections Day. Outcome still not known but seem like Biden is going to win it. Lots of up down in between and fake downs but bulls win it.
No doubt price is bullish but based on price action, pullback is possible today. Price now at my 1st R and pullbacked 20pts. See if this level will hold.
Bias still up above 3412-22. But in the event that this breaks, look for 3392, 3356 (strong support level) to trade. If 3324 breaks, look for reaction at 3324. In the event 3262 trades today, it will be a low risk buy level.
SPX Alternative wave countAlternate wave count shows if resistance do hold at 3425, we might see lower levels on the S&P. This subdivision of wave (2) suggest wave (B) rebound is complete and a potential short term pullback into wave (C).


The USA is in danger i dont think it matters who wins (I'm talking stock wise) the USA has been printing more then ever before + an overwhelming amount of covid cases. Bossiness cant be taking and taking without giving back the money. there are so many factors to what is going wrong with and in America but the stock market doesn't look too good either the 12M is on a TD green 9 meaning its maxed out and needs to fall.
this is the wall for now
good luck trading

SPXUSD TP_3.134_7.04%_237.30pips_SL_3.470_2.95%_99.30pipsSPXUSD TP_3.134_7.04%_237.30pips_SL_3.470_2.95%_99.30pips

SPXSPX coming into the election week looking rough as we just broke a long outstanding bullish trend line that may take the SPX to its recent low of $3209. I personal do not believe that we will break our first floor of resistance on its first try but elections and the "Big tech Armageddon" may drag this lower. This week will be extremely volatile and we will see how the priced in "Biden" win levels will hold.
Reasons for Bearish move:
1. Elections are coming up Tuesday being the biggest and most controversial election yet.
2. Long time up trend line has been broken and could be possibly be heading lower
3. Big tech is being hit and being one of the biggest market movers the "FANG" group if goes lower will drag the SPX down as well.
4. Double top pattern looking quite valid.
Preparation:
If you are looking to capitalize on the markets dropping, look into inverse or bear SPX and DOW stocks.

Get Ready For November 3rd (S&P 500)Uncertainty will cause a minor drop. But things should pick back up as long as D.J.T stays president. This is how I'm looking to play things if you disagree let me know why I'd love to hear from you.
This is a MACRO trend analysis so I'm leaving some room for breaking news and price action.

SPX 500 expected to retrace about 50% in couple of days.It moved down too quickly. Looking to about 50% retracement in a couple of days.

Global Insolvency CrisisES1! Near Term. Purple rays represent possible resistance.
This is not about elections.
This is not about COVID.
We are in the midst of a Global Insolvency Crisis.
Bills are due...


SPX Hourly Chart , Impulse 5 waves to the DownsideOn the minor time frame hourly chart, looking for a minor rebound into wave ii resistance at 3350-3370 to deploy some downside hedge. So far, this wave count is suggesting a deeper corrective wave that could take us through Nov-Dec.

28/10/2020 #SPX #ES_F looking for more sell, till I am wrongYesterday (27 Oct) #SPX #ES_F closed at the lows. It is still ranging now. Normally if we are to pullback, it should come quickly from open, but not so yet, thus probably we will sell in Europe session. But do note that 3402-3406 is a valued area of yesterday, there is always a probability we might pullback to there. That will present a low risk short level.
Purple lines 3382 and 3390 are probably R. If you want to trade the pullback you can trade level to level, but as per my plan, the upside (above the blue zone) is limited - 3412 and 3420.
Below support are 3364.8, 3350.8. If 3323.8 hits, it should present a low risk long level.

How to trade SPX today.US500 - Intraday - We sold at 3410 (stop at 3426)
A Doji style candle has been posted from the high.
We are trading at overbought extremes.
This is negative for sentiment and the downtrend has potential to return.
Preferred trade is to sell into rallies.
Levels close to the 38.2% pullback level of 3420 found sellers.
Further downside is expected although we prefer to sell into rallies close to the 3410 level.
Our profit targets will be 3365 and 3300
Resistance: 3507 / 3588 / 3690
Support: 3300 / 3210 / 3000

27/10/2020 SPX ES_F Let the sell continueMy post yesterday was titled "Let the crash begin?"
Probably will be more apt without the ?
We had a 100pts downmove then a pullback of 50pts. I still see further down; as I tweeted yesterday, no news is bad news.
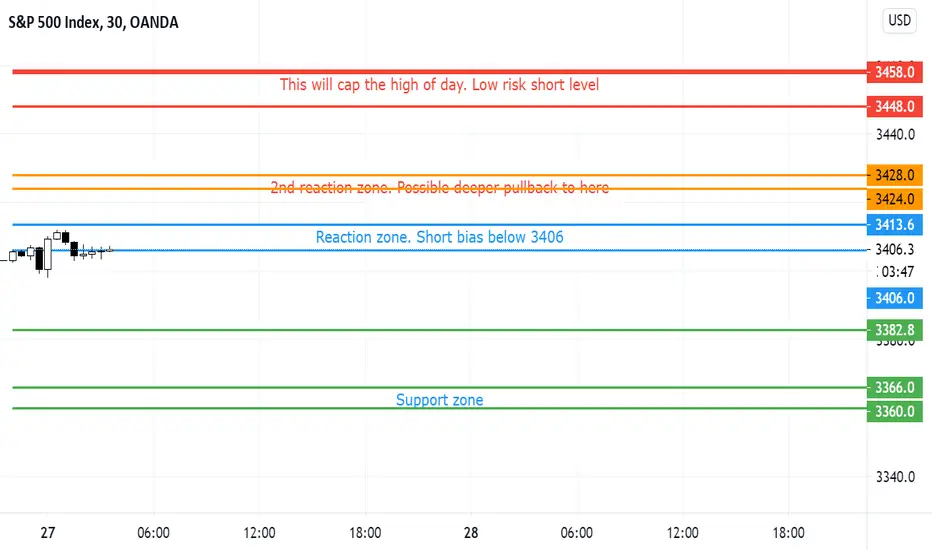
Blue zone is usually my buy/sell level.But given the large movement yesterday, I actually put in an orange zone.
Be short below 3406 target 3382.8,3360-66 and even 3318. 3272, if we somehow reach there, will offer low risk buy level.
Do nothing between 3413.6 and 3424. If price pullback to this deeper levell, 3424-28 is the level to hold. If rejected, lower targets as mentioned above will be in play.
I will only want to look for longs above 3428, targetting 3448. 3458 should cap high of day - low risk sell level.