Why the Biggest Crash Is Nearing (Beyond Fundamentals) - Part 2The SPX (SNP500 Index) monthly chart has been giving clear signals in the past with regard to overall changes in trend. With all of those trends taken into consideration, we can see an extremely similar situation with the current price action. As we also take into account for current political, geopolitical, COVID-19, and tech stock inflation factors, we can assume that no rally is sustainable without a correction. Keep in mind, this is only an observation by using the simple bearish and bullish divergences. A bearish divergence occurs when the price action by candles, shows a higher high, while the oscillator for the RSI shows a lower high - indicating that price momentum has died off. I also show in the chart that it's possible to identify key points when the market is showing demand for the stock market even if it's in a downtrend, where the general public might assume the major crash is coming - this is a bullish divergence
- The 2008 recession was signaled by a clear bearish divergence on the weekly, and even the monthly. This took months to play out, but with each rise, you could have bought in and still profited with a high average. Following the financial crisis, the 2009 bottom and reversal into a 9 year bull market was signaled by a strong bullish divergence on the weekly.
- When many thought the market was crashing in early 2016, a strong bullish divergence showed that selling momentum was done and that a bullish continuation would resume. This was due to the confirmation of a bullish divergence on the price action. It meant that there was CLEAR demand for cheaper prices.
Current Sentiment shows that a large bearish divergence on the monthly chart is forming and we may be in a bear market until proven otherwise.
Spx500short

S&P500 3356.8 - 0.66 % SHORT IDEA * PRICE ACTION, PULL BACK TRADHELLO EVERYONE
Here's an idea on the S&P500 which is currently in an uptrend on higher time-frames but saw some losses in momentum in the last couple of days, targeting this pull back from higher time-frames.
On the DAILY time-frames the index broke the 50 M.A and is currently retesting this moving average and support level now resistance level 3401.8 now will be looking for a continuation of this pull back with the bears on the index. hope this idea assists in anyway on your trading of the S&P 500.
LET'S SEE HOW IT GOES..
HAPPY TRADING EVERYONE
_________________________________________________________________________________________________________________________
ENTRY & SL - FOLLOW YOUR RULES
RISK-MANAGEMENT
PERIOD - SWING TRADE
__________________________________________________________________________________________________________________________
If this idea helps with your trading plan kindly leave a like definitely appreciate it.

S&P 500 Analysis UpdateSnp Reached the daily strong resistance we might be looking for shorts in this area
Please Share your Thaughts In A comment and don't forget to drop a like


Bearish Sign S&P 500 E-Mini Futures: Rising Wedge in DowntrendS&P 500 E-Mini Futures is forming rising wedge like patterns which is a bearish sign.
If the below trendline of the Wedge pattern breaks, then you might consider it may go down.

S&P 500 4H-TIMEFRAME ANALYSIS 💡S&P 500 4H-TIMEFRAME ANALYSIS 💡
Hello ladies and gentlemen
This is my new idea for the S&P 500
My idea is that SPX will continue to downtrend
I hope my idea is clear
Support me by like and share
Good luck💰💯

S&P500 - Sell validS&P500- sell position now valid.
The entry price, SL and multiple TPs are shown on the chart.
Our back testing and money management strategy itself is holding until a reverse signal to ride a big trend, but as you will not see the next signal - manage the trade as you wish should you decide to enter.
What is our strategy?
Our strategy is a trend following strategy, can be used on any instrument and time frame. However, we have hard coded specific parameters for when trading the H1 time frame, so we can back up over 4200 previous trades to confirm our edge from previous data. This gives us confidence in execution and belief in our trading strategy for the long term.
The strategy simply sits in your trading view, so you will see exactly what we see - the trade, entry price, SL and multiple TPs (although we hold until opposite trade as this is the most profitable longer term plan), lot size, etc.
This could be on your phone trading view app, or laptop of course.
The hard work is done, so we have zero chart work time, no analysis, no time front of the chart doing technical analysis - technical analysis is very subjective - you may see different things at different times - how do you have a rigid trading plan on a H&S shoulder pattern? Your daily routine, diet, sleep, exercise can affect what you 'see' and your decision making, this doesn't happen when a strategy is coded like this; what we do have is a mechanical trading strategy...
What does this mean?
It means, we are very clear on our entry and our exit and use strict risk management (this is built in - put in your account size, set your risk in % or fixed amount and it will tell you what lot size to trade!) so we have no ego with our position and we are comfortable with all outcomes - its simply just another trade. This free's our mindset from worry and anxiety as we take confidence from knowing our edge is there and also that we have used sensible risk management.
The strategy itself can be used as a live trading journal too - how cool is that? The strategy will confirm and support every open and closed position - so its quite easy to follow.
We just have to do what Percy does.
Please see our related ideas below for more information to explain what we do and how it can help you.

Volatility S&P 500 index 1D-TIMEFRAME ANALYSIS 💡Volatility S&P 500 index 1D-TIMEFRAME ANALYSIS 💡
Hello ladies and gentlemen
This is my new idea for VIX
My idea is that VIX will go long to 55 Target
TRUMP TESTS POSITIVE COVID_19 MARKETS DROP
I hope my idea is clear
Support me by like and share
Good luck💰💯

S&P At Unsustainable Levels???For the past 9 years the S&P 500 has not been able to live outside of this channel for long, eventually it's pulled back inside like a metal to a magnet.
Zooming out and viewing from a macro scale I would say we are going to revisit the channel soon possibly after the next leg up around the election or shortly after..


DAX SHORT POSITION/MASSIVE PULLBACK BY GERMAN ECONOMY Hi guys.
Today i'm going to explain why do i expect a massive pullback in German economy.
Technicaly :
* Daily MACD bearish
* Weekly bear crossover projected to happend in a matter of weeks and manifest " in no time" so to say, because DAX index shows signs of SERIOUS WEAKNESS having on mind level (12.7xx index points).
* Wall Street so called " experts" claim that it's impossible to predict time frame, but that's their opinion and it's wrong, that's why I'm the one holding 4 WORLD RECORDS REGARDING STOCKS :)
-2676 billion $ SHORT on SPX
- 5000 billions $ SHORT on SPX
-25.000 billion $ SHORT on SPX
-40.000 billion $ SHORT on SPX
Here is 25.000 billion USD SHORT on S&P500 posted on January 30th (few days before collision from 3400---->2200 index points).
REGARDLESS OF HOW MUCH THEY ARE PAID, they don't have a clue and everything they do is "scalping" with large margins and nothing but that :)
YES, I CAN LAUGH THEM AT THE FACE AND PROVE THAT I M NUMBER 1 IN THE WORLD WITHOUT BEING MODEST, BUT ONLY OBJECTIVE AS ALWAYS.
Short your positions with marging which could go up to X10 (but super "safe play") is X4, X5 leverage.
Don't exagarate, don't blow your margins.
Once again, German economy is in front of massive collision (we've seen signs of serious weakness in March) when DAX sank to 8000 index points).
ECB in Frankfurt is trying to maintain liquidity with stimulative package of 750 billion euros + additional 250 billion euros which is only delaying of IMMINENT collision.
Please, don't buy on top, clear your positions and you will be more than good.
Thanks for reading and good luck to everyone following my Technical and Fundamental analysis.
Don't listen to guys who tell you it's " buy time" because ITS NOT !!!
Cheers.
From Serbia with love

Rocky Roads Ahead for SPXFor every one that wants a quick analysis. Basically, SPX is going to be bouncing in this 3400-3205 range for a little while. I believe that we are entering into a consolidation period before a big move. To early to tell which way it is going to go.
For everyone that wants a more detailed analysis here it is. SPX broke through its major support line, the grey line on the graph, which then made the pink line the new support. However, it broke through that new support which created a nice price channel, represented in purple, which was somewhat quickly broken through. The break through was very bullish. As seen it was a big gap up and closed very green. However, since then it has been fighting the new support, now resistance, and the 50 MA. On top of that we also have a strong resistance area at 3400. Now today we tested getting over that pink line resistance, the 50 MA, and almost tested 3400 but it failed. This in my opinion is not a great sign. I'd put my money on a pretty bearish day tomorrow. We are going to stay in this new horizontal price channel, represented by green, for possibly up to a few weeks if there is no clean break out soon. I'd expect it to be very consolidated unless some miraculous news comes out. If you are trading keeps those stop losses tight.
Happy trading

S&P500 Potential Supply Area 1 Hour Chart 28 Sep 2028 September 2020
Fresh Potential
Supply Level
If Price Pulls
Back. S&P 500
1 Hour Chart OANDA:SPX500USD

SPX500 CLEAR SELLWe have SPX500 for a clear sell, as a downtrend occured from multiple time frames.
TP: 3300 OR BELOW

SPY SPX Short term short tgt 3289seems as if the market may not be finding fair value at current levels. looking for 3280 on break of 3322. long if daily close above 3280 to break 3363 resistance

S&P 500 Shorting Opportunity Short-TermShorting Opportunity in S&P 500 if price rejects the red downward trendline.
Even, price is also at 23.60% fibo retracement level which might act as resistance.
If S&P open below red downward trendline and green upward trendline, then adopt shorting strategy.


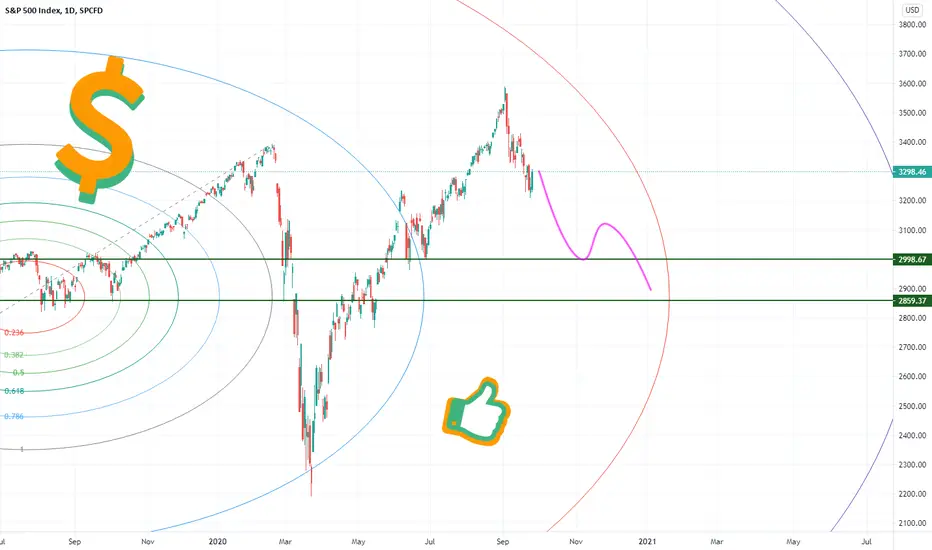
S&P 500 1D-TIMEFRAME ANALYSIS 💡S&P 500 1D-TIMEFRAME ANALYSIS 💡
Hello ladies and gentlemen
This is my new idea for the S&P 500
My idea is that SPX will continue to downtrend
Targets
3000
2850
I hope my idea is clear
Support me by like and share
Good luck💰💯
SP500 (SPY) Hard SELL off of 3440-3500. Good for 400 points!Let's hope it gets up there, first! (Currently scalping/long for bounce.)

S&P 500 Trade Setup (Easy Money)This one is pretty black and white or green and purple in this case lol Show me the chart I'll tell you the news.... Lately I been trying to master 2 indicators S/R Zones and Tend-lines lets make this money $$$


S&P 500 1W-TIMEFRAME ANALYSISS&P 500 1W-TIMEFRAME ANALYSIS
Hello ladies and gentlemen
This is my new idea for SPX
the price will test 3130 daily support
My idea shows the possibility of breaking this support
But be relaxed
Real support is between 2970 and 3030 It would be good to test it
From there we will start the bull market
I hope my idea is clear
Support me by like and share
Good luck

SPX500 and ANOTHER DIP before it goes UP!Hey tradomaniacs,
SPX500 is testing a very great zone to sell as we might see lots of bearish confluence here.
Orderbook still showing bulls to protect the previous buy-zone but now we see more sell-stackings incoming.
We might see another dip down before it actually goes up again.
I still trade SPX500 with my hedge-strategy and use these chances to stack shorts before I go long again if we get confirmation for this idea.
LEAVE A LIKE AND A COMMENT - I appreciate every support! =)
Peace and good trades
Irasor
Wanna see more? Don`t forget to follow me.
Any questions? PM me. :-)
