S&P500’s Bullish Island Turns Risky: Elliott Wave Says “Top”The S&P500 Index( SP:SPX ) started to rise and even created a new All-Time High(ATH=$6,428) with the help of the Bullish Long Island Pattern , as I published in my previous idea on May 14, 2025 .
The S&P500 Index is currently moving near the Potential Reversal Zone(PRZ) , upper line of the ascending channel , the Important Resistance line , and the Yearly Resistance(1) .
In terms of Elliott Wave theory , the S&P500 Index appears to be completing microwave 5 of microwave 5 of the main wave 5 .
Also, we can see the Regular Divergence(RD-) between Consecutive Peaks .
I expect the S&P500 Index to correct at least -4% and fall to the lower line of the ascending channel .
First Target: $6,233
Second Target: $6,033
Note: Stop Loss(SL) $6,513
Do you think S&P500 Index can create a new ATH above $6,500 !?
Please respect each other's ideas and express them politely if you agree or disagree.
S&P 500 Index Analyze (SPX500USD), Daily time frame.
Be sure to follow the updated ideas.
Do not forget to put a Stop loss for your positions (For every position you want to open).
Please follow your strategy and updates; this is just my Idea, and I will gladly see your ideas in this post.
Please do not forget the ✅' like '✅ button 🙏😊 & Share it with your friends; thanks, and Trade safe.
US SPX 500

SPX500 Dips Ahead of NFP as Tariff Risks RiseSPX: S&P 500 Dips to Close July — Still Positive for the Month Amid Tariff Tensions & Fed Uncertainty
The S&P 500 retreated in the final session of July, weighed down by renewed tariff concerns and lingering uncertainty around the Fed’s next move. Despite the late pullback, the index remains positive for the month overall.
Looking ahead, non-farm payrolls (NFP) and U.S. jobs data are expected to have a strong impact on market direction. In addition, August 1st marks a key date for potential tariff developments, which could trigger further volatility.
Technical Outlook – SPX500
The index has dropped approximately 2.5% since yesterday and maintains a bearish bias as long as it trades below 6283. If the price continues to slide, the next downside target is 6246, with further support at 6223.
However, if the price manages to close above 6289 on the 1H timeframe, it could trigger a bullish recovery toward 6320 and 6341.
Pivot Line: 6283
Support Levels: 6246 • 6223
Resistance Levels: 6320 • 6341

SPX500 Will Go UP!
HI,Traders !
#SPX500 made a retest
Of the horizontal support
Level of 6277.78 and we
Are already seeing a
Bullish rebound so we are
Locally bullish biased and
We will be expecting a
Further bullish move up !
Comment and subscribe to help us grow !

SPX500 Bearish Bias!
HI,Traders !
#SPX500 broke both the
Rising and horizontal
Support line which are
Now resistance areas
And the breakout is
Confirmed so we are
Bearish biased and we
Will be expecting a
Further bearish move down !
Comment and subscribe to help us grow !

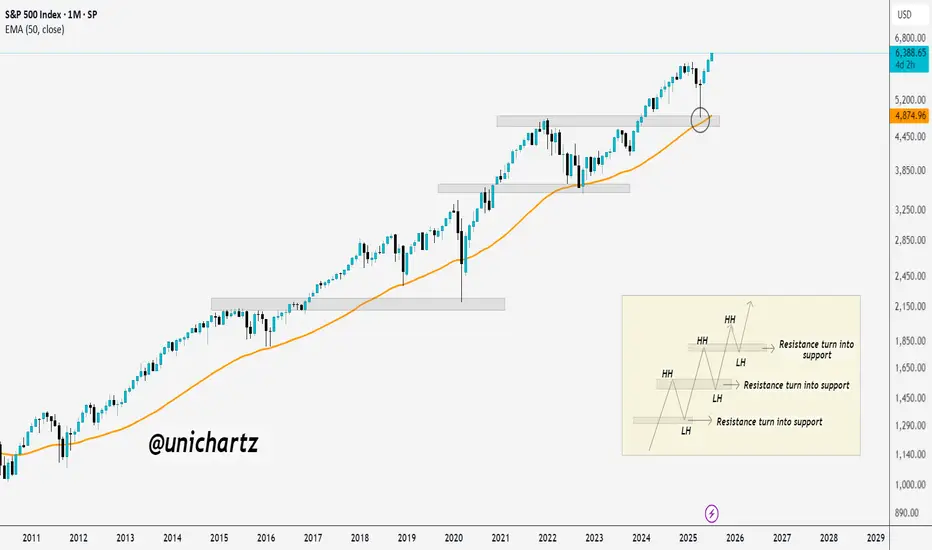
New All-Time Highs for S&P 500 – No Resistance AheadThe S&P 500 is officially in price discovery mode, printing new all-time highs with clean higher highs and higher lows.
Each old resistance flipped into strong support—textbook bullish market structure.
As long as this trend holds, there's no ceiling in sight. Bulls are fully in control.
Rob the Rally SPX500: Enter Before Resistance Catches You🦹♂️💰**“SPX500 Street Heist” – Thief-Style Robbery Plan for Bulls!**📈💸
(Powered by Thief Trader's Market Robbing Tactics – Scalp | Swing | Day Trade Edition)
🌍Hello, Global Money Hunters!
📣 Salaam, Bonjour, Ola, Hola, Hallo, Marhaba & Welcome to the heist floor! 🎩💼
Thief Trader is back again with a loaded plan to rob the market clean — this time targeting the mighty SPX500 / US500 🎯. Based on a fusion of technical setups, macro sentiment, and the Thief Trading System, we’ve set our sights on the next breakout vault of Wall Street.
🎯 The Gameplan – Heist the Resistance Vault
The index is entering a high-risk resistance barricade — overbought, consolidated, and heavily guarded by bearish robbers (sellers). This is the zone where the market police lurk and trend reversals often get triggered. However, smart thieves always plan with precision.
Here’s the mission briefing:
🔓Entry Zone (Break-in Point)
💥 “The vault is open — grab the bullish loot!”
Enter Long anywhere close to market price or on pullbacks near recent swing lows/highs.
Preferred timeframes: 15-min to 30-min for sniper-level accuracy.
Deploy DCA-style limit orders (layered entries for maximum control).
🛑Stop Loss (Escape Hatch)
Base SL on recent swing low candle wicks on the 4H timeframe.
Suggested: ~6250.00 — but adapt based on your risk appetite, lot size, and position stacking.
📈Target / Loot Location
🎯 Primary Take-Profit: 6450.00
Or… pull out early if you spot resistance fighters guarding the vault.
Use trailing SL to secure gains and manage getaway.
⚡Scalper’s Notice
Only Long-side allowed!
Got big capital? Jump in now.
Running low? Tag along with swing traders and follow the robbery protocol.
Always protect your bag with dynamic trailing stops.
🧠Fundamental Fuel Behind the Plan
Bullish sentiment across major indices
Macro trends, COT positioning, sentiment outlook, and intermarket analysis all greenlit
Geopolitical and Fed tone supportive — tap into real data before entering
👉 Always analyze: News, Fundamentals, Sentiment, COT reports, and macro conditions.
🚨NEWS ZONE ALERT – No Loud Moves!
Avoid entry during major economic news drops
Use trailing SLs to guard profits
Don’t let your open trades get caught in the chaos of news releases!
💥Let’s Boost the Thief Army!
Smash the BOOST button 💖 to power up the robbery crew.
Support the strategy, share the love, and stay ahead of the game using Thief Trading Style. Every trade is a step closer to freedom from financial traps. 🚀💰🎉
📌Disclaimer: This is a general market analysis for educational purposes and should not be considered personal financial advice. Please evaluate your own risk management strategy before placing trades.
📌Markets shift fast — stay flexible, stay alert, and always rob smart.
🔥Stay locked in for the next heist plan — Thief Trader signing off for now…
💸💼📈 Trade smart. Rob harder. 🤑🦹♂️📊

US500 Bulls Assemble | Breakout Heist Strategy📈🚨 MASTER HEIST PLAN: “SPX500 ROBBERY – THIEF TRADING STYLE 🔥💸” 🚨📈
(The Ultimate Long Strategy Blueprint for Smart Day/Swing Traders)
🌍 Greetings to All Market Bandits, Bullish Burglars, and Chart Snipers!
Hola! Bonjour! Ola! Hallo! Marhaba! 🙌
🦹♂️This is your friendly chart thief checking in with the latest SPX500/US500 masterplan!
This isn’t just a trade—it’s a heist 🎯. We’re not here to participate, we’re here to dominate! Welcome to the Thief Trading Style, where we map, trap, and snatch those pips with ruthless precision. 🧠🔍💰
🚀 THIEF TRADE SETUP - SPX500/US500
A mix of technical sniper entries + fundamental black ops analysis = 💸 Maximum Extraction. 💸
🎯 ENTRY PLAN: THE BREAKOUT HEIST
📍Buy Entry Zone: Wait for the clean breakout + candle close above 6270.00.
"The vault opens once we clear that wall. Let the bullish getaway begin!" 💥🚪📈
🛠️Thief Tips for Entry:
Use Buy Stop Orders above resistance levels.
OR layer in Buy Limit Orders near recent pullbacks (15/30m swing zones) using DCA Style (Dollar Cost Average layering like a pro).
Want stealth mode? Set that alert (alarm), and strike when the breakout sings. 🔔🎯
🛑 STOP LOSS – PROTECT THE LOOT
🧨Set your SL smart—beneath the nearest swing low using the 2H timeframe for stronger structure.
💬 “Look, don’t gamble. A thief knows when to run. Set that stop where I showed ya, or risk losin’ the bag.” 💼💣
❗Your SL should reflect your risk per trade, lot size, and number of entries. It’s your getaway plan—don’t mess it up.
💥 TARGETS – WHERE WE CASH OUT
🏴☠️Primary Take Profit (TP1): 6310.00
🏴☠️Secondary Take Profit (TP2): 6370.00
💹 Scalp Traders: Stick to the Long Side Only. Ride the momentum, but use trailing SL to lock it in.
🔍 THIEF FUNDAMENTAL INTEL: WHY THIS IS OUR MOMENT
Current SPX500 bullishness driven by:
✅ Positive macro & geopolitical tailwinds
✅ Institutional positioning (COT reports)
✅ Intermarket analysis showing strong correlations
✅ Momentum building with sentiment and volume
📌 Stay sharp—check all your fundamental reports, news catalysts, and sentiment tools before executing your move. Smart thieves plan every detail. 🎓📊
⚠️ NEWS RELEASE REMINDER
📢 News = Chaos. Don’t get caught in the spray:
🔒Avoid entering trades just before big announcements.
🚀 Use Trailing SL to secure profit if you're already in.
Stay agile. Stay smart. Stay rich. 💼🚁
❤️ SUPPORT THE HEIST – HIT THAT BOOST BUTTON!
👊 Liked the plan? Hit the Boost to join the elite robbery crew.
Every boost fuels the mission. Every like sharpens the strategy. Let's build a team of smart, profitable traders. 🚀💸🔥
🧠 Remember: This is general analysis – not financial advice. Manage your risk like a true thief. Stay updated. Adapt fast. Don't get caught. 🕵️♂️
🎉See you in the next Heist Plan! Keep your tools sharp, your charts cleaner, and your profit bags fatter. 🤑🔥

S&P 500 (CASH 500) SHORT - Double top H8Risk/reward = 4.1
Entry price = 6343.3
Stop loss price = 6365.3
Take profit level 1 (50%) = 6268.1
Take profit level 2 (50%) = 6232.1
Still waiting on some variables on checklist to be confirmed before I enter the trade.

Expect Correction august/septemberMarkets MUST correct, everything is overbought and sentiment is Extreme greed. RSI points to extreme overbought territory, VIX very low and not going any lower (reached bottom).
Usually august/september the market corrects. so i expect a correction around 5-8%.
Be prepared, dont chase FOMO. Be careful.
SP:SPX TVC:SPX CBOE:SPX CBOE:XSP AMEX:SPY

BTC/USD Fake out before Pump | Bullish Flag formationBTC/USDT (1D) Market Outlook – July 1, 2025
Introduction
BTC is currently consolidating within a bullish flag pattern after printing a swing high at 108.9K and a recent swing low at 98K. The price sits just below a major supply zone.
Context 1: Key Zones
Supply: 104.6K – 112.1K
Demand: 74.4K – 82.5K
Fair Value Gaps (FVG): 3 zones below price, with one near 88–90K
Context 2: Technical Confluence
Liquidation Zone: 106.2K
Golden Pocket (Fib 0.618): 102.1K
Psychological Levels: 105K and 110K
Context 3: Market Structure
Pattern: Bullish flag
Trend (LTF): Sideways/consolidation
Volume Profile: Heavy activity near 105K–110K
Bullish Scenario
Breaks above 106.2K (liq zone)
Pulls back to 102.1K (golden pocket), forms higher low
Retests resistance for continuation
Alt scenario: clean breakout above resistance → ATH retest
Bearish Scenario
Breaks below 106.2K and flag support
Fills FVG, breaks prior low at 98K
Triggers macro downtrend toward 88–90K zone
Summary
BTC is at a decision point inside a bullish flag, facing supply. A break above 106.2K favors upside continuation, while rejection and a lower low could trigger a deeper retracement. Watch key levels closely.

SPX500 Short From Resistance!
HI,Traders !
#SPX500 is trading in an
Uptrend but the price will
Soon hit a horizontal resistance
Area around 6285.44 from
Where we will be expecting
A local bearish correction !
Comment and subscribe to help us grow !

This is just my Elliott Wave Analysis not financial Advice. $SPThis is just my Elliott Wave Analysis not financial Advice. SP:SPX #SPX SP:SPX
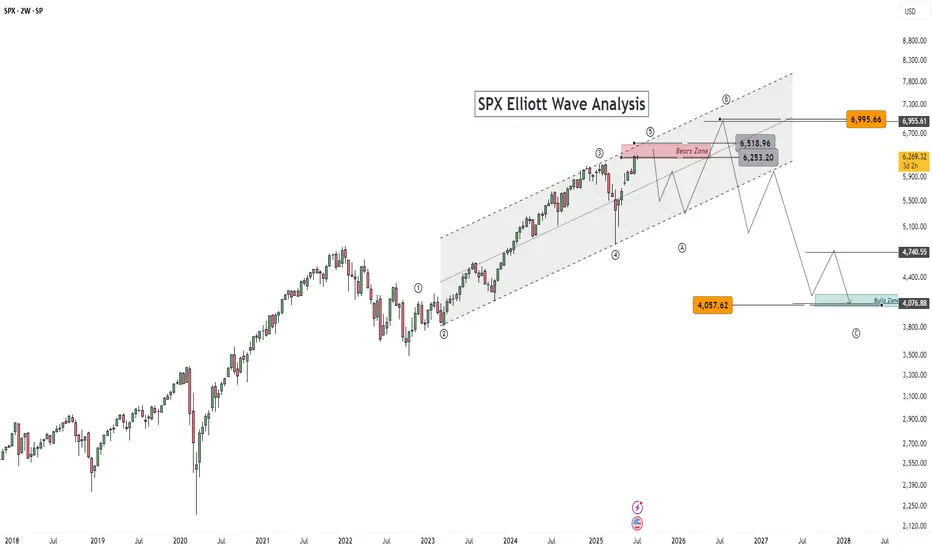
BEAR WITH ME... First of all, I'm getting into the field of other players and trying to call their type of shots.
I don't intend to come across as ignorant when it comes to this market, since I only trade gold and I have seen FOREX traders try to predict gold and get it completely wrong.
I have NO ARGUMENTS WHATSOEVER with which I could back this PREDICTION up; NOT PROJECTION...
As a matter of fact, Technically speaking , the " PROJECTION " would actually be BULLISH , because price is entering a "discovery" phase, In which there is no previous high to "top" a potential impulse with.
When price is making ATH, YOU CAN'T CALL THE TOP UNTIL THE TOP IS FORMED.
That being said, I only want to have this on my profile for personal use and see if my "prediction" comes a reality between December 2025 and February 2026.
--
Is SP500 / US M2 Money Supply telling us a story?Historically this ratio has inflected from key levels. Last week the upper boundary of what 8 would call a normal range has acted as support. If history rhymes to dot com bubble, this AI bubble can bounce from these levels and see an increase until Q4 2026, then a sharp fall will follow. To the lower boundary of that normal range.

SPX500 Bearish Breakout!
HI,Traders !
#SPX500 was trading along
The rising support line but
Now we are seeing a bearish
Breakout so we are bearish
Biased and we will be expecting
A further bearish move down !
Comment and subscribe to help us grow !

S&P 500 Hit Record High Ahead of Holiday BreakS&P 500 Hit Record High Ahead of Holiday Break
Today, financial markets in the United States are closed in observance of Independence Day. Investor sentiment was likely buoyed by the latest rally in the S&P 500 index (US SPX 500 mini on FXOpen), which set a new all-time high yesterday, surpassing 6,280.
The bullish momentum has been driven by robust labour market data in the US. According to ForexFactory, analysts had anticipated a rise in the unemployment rate from 4.2% to 4.3%, but instead, it unexpectedly declined to 4.1%.
Can the stock market continue to climb?
Technical Analysis of the S&P 500 Chart
Analysing the 4-hour chart of the S&P 500 index (US SPX 500 mini on FXOpen)on 30 June, we observed the following:
→ An ascending channel was formed (indicated in blue);
→ A developing bullish impulse (marked with an orange line) suggested the price would move towards the upper boundary of the channel – a scenario that materialised with yesterday’s rally (as shown by arrow 1).
However, from a price action perspective, the recent downward move (arrow 2) has now gained significance. It may indicate that sellers are becoming more active around the identified resistance level.
Should the price decline towards the lower orange line, this could negate the current bullish impulse altogether, effectively reflecting a classic bearish engulfing pattern.
Given the above, there is reason to believe that bears are attempting to regain control after the S&P 500 (US SPX 500 mini on FXOpen) surged over 5% in the past 10 days. As such, a potential breakout below the orange line cannot be ruled out, with price action possibly targeting the median of the blue ascending channel.
What happens next?
The market’s trajectory will largely hinge on developments related to tariffs. Trade policy will remain in the spotlight next week, as key deadlines set by the White House approach — events that traders will be closely monitoring.
This article represents the opinion of the Companies operating under the FXOpen brand only. It is not to be construed as an offer, solicitation, or recommendation with respect to products and services provided by the Companies operating under the FXOpen brand, nor is it to be considered financial advice.

BTCUSD| Bitcoin’s Historic Parabolic Pattern🔥 Parabolic Pattern | Institutional COINBASE:BTCUSD Demand Mirrors Gold ETF Era 🔥
COINBASE:BTCUSD vs SP:SPX vs TVC:GOLD
The market is whispering something big — and it's not retail noise this time. For the third straight quarter, listed corporations have outpaced ETFs in Bitcoin purchases, a seismic shift that echoes one key moment in history: the launch of the Gold ETF. Companies like NASDAQ:MSTR contiune to buy and others are following. Will NASDAQ:AAPL NASDAQ:META and NASDAQ:GOOG be next ? Let me know in the comments who you think will be next to buy?
Back then, companies rushed to gold as a hedge against inflation and a store of value as fiat cracks widened. Fast forward to now — we're seeing the same institutional footprints in Bitcoin. The buy-the-dip narrative isn't just alive — it's being driven by corporate balance sheets.
Rumors are circulating that the U.S. government plans to buy 1 million BTC — a move that would shake the global financial system to its core. If true, this isn’t just bullish — it’s historic. The last time governments got this aggressive with a hard asset was during the Gold Reserve buildup. Bitcoin isn’t just digital gold anymore — it’s becoming sovereign-level collateral. 📈💥
💬 Drop your thoughts below. Is this the beginning of the next parabolic era?
In this episode, we break down the parabolic pattern forming on the chart, why it may signal the next explosive leg up, and how history is repeating with BTC playing the role of digital gold.
📊 Technical breakdown. On-chain behavior. Smart money moves.
Don’t blink. Parabolas end in fireworks.
I've been trading for 17 years
👍 If you found this useful, drop a like.
💬 Got questions or thoughts? Leave a comment below — I always respond and happy to help.
👍
Best Regards
MartyBoots

S&P 500 BULLISH GRAB: Steal These Gains Before the Trap Closes!🚨 E-MINI S&P 500 HEIST: Bullish Loot Before the Market Turns (Thief Trading Blueprint) 🚨
🌟 Hola! Oi! Bonjour! Ciao! Guten Tag! 🌟
Attention all Market Bandits & Index Raiders! 🏴☠️📊💰
🔥 Thief Trading Intel: We're targeting ES1! (E-Mini S&P500) for a potential bullish breakout! Long entry only—approaching high-risk Red Zone: overbought, consolidating, and ready for a move. Don't let the bears steal your profits!
"Grab your gains and disappear into the night—you've earned this steal!" 💰🌙
🚪 ENTRY: The Vault is Cracked!
📈 "Swipe bullish positions at any price—the heist is ON!"
Buy Limit orders near swing lows/highs (15-30 min TF)
📌 Pro Tip: SET PRICE ALERTS! Don't miss the move
🛑 STOP LOSS: Escape Route
📍 Smart Thief SL: Nearest swing low (4H timeframe)
📍 Adjust based on your risk tolerance & position size
🎯 TARGET: Take the Money & Run!
🎯 6260.00 (or exit early if the market turns)
⚡ SCALPERS' QUICK GRAB
👀 Long positions ONLY!
Big accounts? Strike now
Small accounts? Ride with swing traders
Trailing SL = Your Getaway Car!💨
📢 WHY THIS HEIST? (S&P 500 Setup)
Neutral trend with bullish potential! Watch for:
Fundamentals (COT, Macro Data, Geopolitics)
Market Sentiment & Sector Rotation
Index-Specific Patterns
🔗 Full analysis? Check our bio0 linnks! 👉🏻👉🏻👉🏻
⚠️ WARNING: News = Danger Zone! 📰🚨
Economic reports move markets! Protect your loot:
❌ Avoid new trades during news
🔒 Trailing stops lock in profits
💖 SUPPORT THE HEIST CREW!
💥 SMASH THAT BOOST BUTTON! 💥
More boosts = bigger future scores!
Stronger crew = more profits for all!
Trade like a thief, profit like a king! 👑💰
Next heist coming soon—stay sharp! 🎯🤫

US500/SPX500 Heist Plan: Grab the Index CFD Loot!Greetings, Profit Pirates! 🌟
Money chasers and market rogues, 🤑💸 let’s execute a daring heist on the US500/SPX500 Index CFD market using our 🔥Thief Trading Style🔥, powered by sharp technicals and deep fundamentals. Stick to the charted long-entry strategy, aiming to cash out near the high-risk Pink zone. Stay alert for overbought conditions, consolidation, or a trend reversal trap where bearish bandits dominate. 🏴☠️💪 Lock in your profits and treat yourself—you’ve earned it! 🎉
Entry 📈
The vault’s cracked open! 🏦 Snatch the bullish loot at the current price—the heist is on! For precision, place Buy Limit orders on a 15 or 30-minute timeframe for pullback entries, targeting a retest of the nearest high or low.
Stop Loss 🛑
📍 Set your Thief SL at the recent swing low (5640) on a 4H timeframe for day trades.📍 Adjust SL based on your risk appetite, lot size, and number of orders.
Target 🎯
Aim for 6160 or slip out early to secure your gains! 💰
Scalpers, Eyes Sharp! 👀
Focus on long-side scalps. Big capital? Dive in now! Smaller funds? Team up with swing traders for the robbery. Use a trailing SL to protect your loot. 🧲💵
US500/SPX500 Market Intel 📊
The Index CFD is riding a bullish surge, 🐂 fueled by key drivers. Dive into fundamentals, macroeconomics, COT reports, geopolitical news, sentiment, intermarket analysis, index-specific insights, positioning, and future trend targets for the full picture. 🔗check
⚠️ Trading Alert: News & Position Safety 📰
News can jolt the market! To safeguard your haul:
Avoid new trades during news releases.
Use trailing stops to lock in profits and limit losses. 🚫
Join the Heist! 💥
Back our robbery plan—hit the Boost Button! 🚀 Let’s stack cash effortlessly with the Thief Trading Style. 💪🤝 Stay ready for the next heist, bandits! 🤑🐱👤🎉

SPY (S&P500 ETF) - Price Bouncing Up from Support after NewsSPY (S&P500 ETF) price has bounced up from the $593 support level after recent global news (de-escalation news).
Price action has slowed and consolidated in June 2025, and the S&P500 is still maintaining a price uptrend.
The 50EMA and 20EMA Golden Cross is still active and in progress (since May 2025).
The next stock market earnings season is not for another 3 months. Inflation, interest rate news, global events, government news, corporate news will continue to affect price volatility this summer.
Resistance Levels: $604, $610, $612, $619.
Support Levels: $600, $593, $586, $579.

How Financial Markets Are Reacting to Middle East EscalationHow Financial Markets Are Reacting to the Escalation in the Middle East
The exchange of strikes between Iran and Israel continues. However, judging by the behaviour of various assets, market participants do not appear to expect further escalation:
→ Oil prices are falling. Monday’s candlestick on the XBR/USD chart closed significantly below the opening level.
→ Safe-haven assets are also retreating: the Swiss franc weakened during Monday’s U.S. session, while a bearish candle formed on the daily XAU/USD chart.
Equity markets, too, have largely held their ground.
The S&P 500 index (US SPX 500 mini on FXOpen) climbed on Monday (A→B) following reports of potential talks between Iran and the U.S. However, it pulled back (B→C) after the U.S. President urged citizens to evacuate Tehran.
Technical Analysis of the S&P 500 Chart
News of Israeli strikes on targets inside Iran led to a bearish breakout from the rising channel (marked with a red arrow), though the downward move failed to gain traction.
At present, the S&P 500 chart (US SPX 500 mini on FXOpen) shows the formation of an ascending triangle — a signal of temporary balance between supply and demand.
Still, given the elevated geopolitical uncertainty, this balance remains fragile. It could be disrupted by:
→ Further developments in the Iran–Israel conflict (notably, Donald Trump left the G7 summit early due to the situation in the Middle East);
→ U.S. retail sales data , due today at 15:30 GMT+3.
It is possible that the S&P 500 may soon attempt to break out of the triangle , potentially triggering a new directional trend.
This article represents the opinion of the Companies operating under the FXOpen brand only. It is not to be construed as an offer, solicitation, or recommendation with respect to products and services provided by the Companies operating under the FXOpen brand, nor is it to be considered financial advice.

SPX500 | Bearish Below 6010 Amid Rising Geopolitical TensionsSPX500 | OVERVIEW
The index remains under bearish pressure due to escalating geopolitical tensions, particularly the ongoing conflict.
As long as these conditions persist, the market is likely to maintain a downward bias.
Technical Outlook:
As long as the price trades below the 5990–6010 pivot zone, the bearish trend is expected to continue toward 5938.
A confirmed stability below 5938 may lead to further downside toward 5902 and 5858.
A bullish reversal is only likely if hostilities cease or negotiations begin between the conflicting parties.
Pivot Zone: 5990 – 6010
Support Lines: 5938, 5902, 5858
Resistance Lines: 6041, 6098, 6143
previous idea:

S&P 500 Breaks UptrendS&P 500 Breaks Uptrend
Only yesterday we questioned the sustainability of the stock market’s upward trend amid alarming news from the Middle East and the evacuation of the US embassy in Iraq — and today, the S&P 500 chart (US SPX 500 mini on FXOpen) shows a break below the lower boundary of the ascending trend channel.
According to media reports:
→ Steve Witkoff, US President Donald Trump’s special envoy to the Middle East, was expected to meet Iran’s Foreign Minister in Oman on Sunday.
→ Friday the 13th became the date when Israel launched strikes on Iran’s nuclear facilities, dramatically altering the outlook for a potential US-Iran nuclear agreement.
→ Secretary of State Marco Rubio stated that the US was not involved in the operation, while Israel’s state broadcaster reported that Washington had been informed ahead of the strikes.
Technical Analysis of the S&P 500 Chart
Yesterday morning, we noted that the Q-line, which divides the lower half of the channel into two quarters, had shifted from acting as support to becoming resistance. This was confirmed during the US trading session (as indicated by the arrow).
Selling pressure intensified, and the psychologically important 6,000 level — which showed signs of support earlier in June — now appears to be acting as resistance. It is in this area that the E-Mini S&P 500 (US SPX 500 mini on FXOpen) broke below the lower boundary of its uptrend channel.
In addition to ongoing discussions about potential Fed rate cuts this summer, geopolitical risk assessments are now also in focus. It remains unclear how Washington will respond if Iran retaliates.
Meanwhile, Israel’s Defence Minister has declared a state of emergency, warning of an imminent missile and drone attack — further fuelling fears of a possible escalation.
This article represents the opinion of the Companies operating under the FXOpen brand only. It is not to be construed as an offer, solicitation, or recommendation with respect to products and services provided by the Companies operating under the FXOpen brand, nor is it to be considered financial advice.
