SPx500 sticks to positivityHello everyone,The index price announced its adherence to the upward path by recently submitting multiple closings near the 4525.00 level, thus attempting to counter the attempt of the Stochastic indicator to exit the overbought level, as is evident in the attached drawing.
We point out that the price is surrounded by several factors that support positive continuity, including the formation of the 4437 level for basic support, in addition to the attempt to form the 4475 level for additional support. Therefore, we will remain waiting for the price to succeed in gaining additional positive momentum to enable it to reach the next main target stable near 4555 , and then let us wait for the next close. So that we can determine the expected direction of upcoming trading.
Pivot Price: 4525
Resistance prices: 4555 & 4579 & 4605
Support prices: 4492 & 4475 & 4437
The general trend expected for today: bullish
US SPX 500

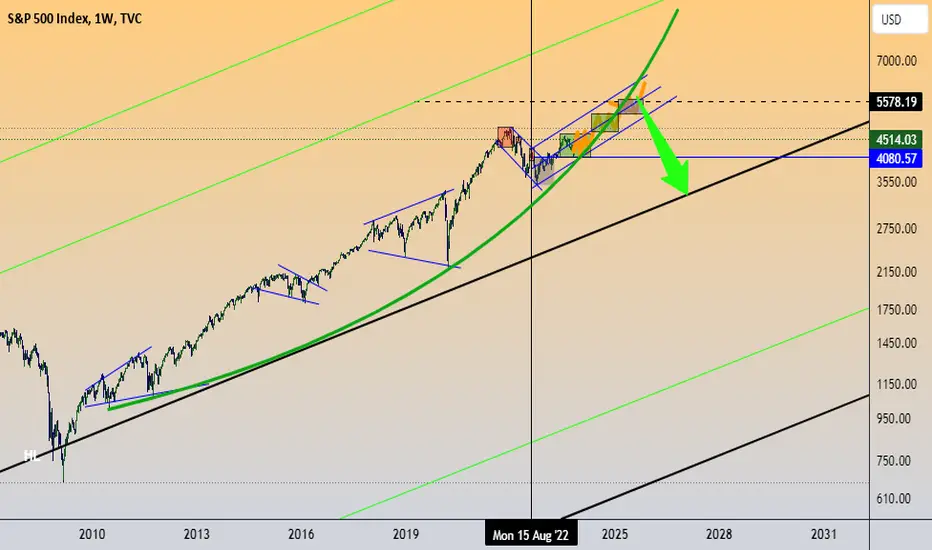
$spx on a parabolic FithCBOE:SPX is climbing it's 5th and last (?) wave from the parabolic rise created since the GFC... targets about 5600 CBOE:SPX and from there I do expect the October 2022 lows to be taken out at last...
SPX500 - Bearish Scenario 📉Hi Traders !
On Wednesday 15 Nov, The SPX500 Price Reached a Resistance Level (4515.46 - 4540.00)
The Price Formed a Double TOP Pattern.
So, We have a Bearish Scenario:
If The Market Breaks The Neckline and Closes Below That,
We Will See a Bearish Move 📉
Let's Wait For Breakout 🔥
-----------
TARGET: 4400.00🎯

SPx500 awaits positive momentumHello everyone, Yesterday, the index price presented more sideways fluctuation by settling near 4525.00 without recording any new positive target, affected by the attempt of the Stochastic indicator to exit the overbought level.
The price may be forced to form some bearish corrective waves, but repeated stability above the support levels represented by 4492 and 4475 supports the bullish scenario until reaching additional resistance extending towards 4555, which in turn constitutes the primary target for the current period.
Pivot Price: 4525
Resistance prices: 4555 & 4579 & 4605
Support prices: 4492 & 4475 & 4437
The general trend expected for today is bullish

SPx500 sticks to positivityIn yesterday's trading, the index price touched the level of 4540.00 and then rebounded directly towards 4510.00, trying to catch its breath before resuming the main upward attack. The 4470.00 level continues to form additional support and the Stochastic indicator continues to fluctuate within the buying trend level. These factors support our bullish bias to remain waiting for the price to target the main target. Next stable near 4570.00.
Pivot Price: 4495
Resistance prices: 4529 & 4558 & 4586
Support prices: 4461 & 4444 & 4405
The general trend expected for today: bullish

False Rally? Two scenarios. Price hits 4550-4600 and stalls in a range to either,
Scenario 1, break down and rebalance the BISI FVGs formed at end of October throughout November.
Scenario 2, price ranges around 4550-4600 levels before taking out 4640 highs, reaching for 4750.

SPX - "bull market back if breaks this level."SPX if break the confluence of trendline resistance and horizontal resistance at 4600. Bull market back. If breaks 4100 level bearish momentum gains priority.

SNP500 & My BIG SHORT - Recession TradeSPX is destined to drop hard, back to 2009 lows.
I decided to go short, to catch the next Market Crash.
It's the previous Wave 4 of a lesser degree.
If you know Elliott Wave as I do, then you are getting ready too.
In my opinion SPX500USD has topped a Wave 5 of a large degree.
More info on that in my Full Wave Count for that 150y old chart.
Here's a picture on that SPX500 / US500 Monthly Chart:
Now, what are the main reasons behind my BIG SHORT on US500.F ?
1. The Volatility Index (VIX) is showing a Fractal, the 2007-2009 same/exact sequence.
2. The United States Consumer Confidence Index (USCCI) is telling me that Consumers are entering the Fear Period.
3. The Federal Reserve Funds Rate (FEDFUNDS / FRED) has broken out of an important Downtrend.
4. The US Inflation Rate (USIRYY) is saying that a full-blown war has started.
5. The 10y Treasury Note Yield (TNX) just broke out of a 40y Downtrend.
6. The US 10y Government Bonds (US10 / US10Y / USB10YUSD) finalized a big bearish leg.
7. The Crypto Market Cap (TOTAL) & Bitcoin (BTCUSD) : The Golden King is taking over.
I know what you might be thinking: SPXUSD could actually do one last Bullish move, an overshoot in the last of the last 5th, right?
In this case, the Wave Count on ES1! could be one step behind, and the Impulse Extension in the 5th of 5th was left out.
Yes, that could be a scenario as well, and I will get burnt.
However, I do not think that's the case, so I am loading my Shorts on SPX500USD !
I could not help but noticing that SPX500 is doing the same Fractal Sequence it did on the previous 2007-2009 Recession.
My Sell Orders & Trading Signals on the SPX Market Crash:
* Aggressive Entry: @ Market Price ($3960)
* Moderate Entry: @ $4500 with SL @ 4900
* Conservative Entry: @ 4700.0 with SL @ 5400
* Position Trading: Sell Stop @ 3700.0 with SL @ 4800.0
* Targets @ : $3200 / $2750 / $2500 / $2200 / $1800 / $1400 / $1100
* Safety measures: when in the green, moving SL @ BE.
Good luck and many pips ahead!
Richard, the Wave Jedi.

SPX500 - New Breakout 📈Hello Traders !
On The Daily Time Frame, The SPX500 Price Reached A Strong Support Level (4141.00 - 4103.00).
The Resistance Level (4397.84 - 4376.45) is Broken and Becomes a New Support Level.
The Resistance Line is Broken.
So, I Expect a Bullish Move📈.
i'm waiting for retest...
-----------
TARGET: 4500.00🎯

SPx500 4H pressing the barrierhello everyone,The index price repeatedly presented positive pressure on the stable barrier at 4422, with the aim of finding an outlet to resume the previously suggested upward attack. Currently, and with the main indicators of positive momentum presented, we advise waiting for the price to achieve the required breakthrough, to open the door to reaching additional stations, which may start from 4443 and 4464, respectively.
While the failure of the breakthrough may force the price to form a temporary corrective bounce, attracting towards 4386, reaching additional support centered at 4353 before recording any new positive target.
Pivot Price: 4422
Resistance prices: 4443 & 4464 & 4500
Support prices: 4386 & 4353 & 4328
The general trend expected for today: bullish with the breakthrough

All Time Highs coming soon!!!Extremely bullish behaviour
Daily chart: Back to back gap ups on
Daily chart: Demolish resistances in 200SMA, 21 EMA, 34 EMA, Trendline resistance from last year
Weekly chart: Demolish resistances at 100 SMA, 21 EMA, 34 EMA
Why is any one doubting this move up?

SPX to see a higher correction to the downside?SPX500USD - Intraday
Broken out of the wedge formation to the upside.
The formation has a measured move target of 4540.
Bearish Outside Day posted, a pattern that often indicates the end of a bullish run and the start of a new downward bias.
Bespoke support is located at 4310.
Reverse trend line support comes in at 4295.
There is scope for mild buying at the open but gains should be limited. Although the anticipated move lower is corrective, it does offer ample risk/reward today.
We look to Sell at 4360 (stop at 4380)
Our profit targets will be 4310 and 4295
Resistance: 4360 / 4380 / 4397
Support: 4337 / 4310 / 4295
Risk Disclaimer
The trade ideas beyond this page are for informational purposes only and do not constitute investment advice or a solicitation to trade. This information is provided by Signal Centre, a third-party unaffiliated with OANDA, and is intended for general circulation only. OANDA does not guarantee the accuracy of this information and assumes no responsibilities for the information provided by the third party. The information does not take into account the specific investment objectives, financial situation, or particular needs of any particular person. You should take into account your specific investment objectives, financial situation, and particular needs before making a commitment to trade, including seeking advice from an independent financial adviser regarding the suitability of the investment, under a separate engagement, as you deem fit.
You accept that you assume all risks in independently viewing the contents and selecting a chosen strategy.
Where the research is distributed in Singapore to a person who is not an Accredited Investor, Expert Investor or an Institutional Investor, Oanda Asia Pacific Pte Ltd (“OAP“) accepts legal responsibility for the contents of the report to such persons only to the extent required by law. Singapore customers should contact OAP at 6579 8289 for matters arising from, or in connection with, the information/research distributed.

SPx500 testing initial supportThe index price failed in yesterday’s trading to resume the upward attack, affected by the exit of the Stochastic indicator from the overbought level, forcing it to form a bearish corrective bounce,
We currently and continually expect the price to be exposed to negative pressures, forming an additional corrective decline to incur additional losses by being attracted towards 4328 and then trying to test the main support extending towards 4298 . As for its renewal of the upward push, this requires presenting a positive close above the 4383 level, to facilitate the task of achieving new gains that may extend towards 4402 and 4423 respectively.
Pivot Price: 4383
Resistance Price: 4402 & 4423 & 4464
support price: 4328 & 4298 & 4268
The expected general trend for today: corrective bearish
timeframe: 4H

SPx500 moving slowlyIn yesterday's trading, the index price touched the level of 4402 and then repeated the sideways fluctuation near 4362, affected by the attempt to exit the Stochastic indicator from the overbought level, while the general stability is above the support level extending towards 4383 and the attempt to form the moving average 55 for additional support by settling at 4423, this calls us to adhere to the bullish bias. Which may soon target 4423 and 4464, respectively.
Pivot Price: 4383
Resistance Price: 4402 & 4423 & 4464
support price: 4353 & 4328 & 4298
The general trend expected for today is bullish
timeframe: 4H

SPX500Pair : SPX500 Index
Description :
Exp FIAT as an Corrective Pattern in Short Time Frame and Rejection from the Lower Trend Line after it has Completed " abcde " Corrective Waves. Impulsive Wave " 1234 " Completed at Fibonacci Level - 50.00%
Entry Precaution :
Wait until it Breaks or Rejects UTL

SPX500 Will break trendline and test 4500SPX SPY SPX500 has shown clear reversal of trend. 60 min has shown a upward indication after two months. 4hr RSI shows there is another high coming. Expect to clearly break the downward channel and power through to test 4500

SPx500 remains positiveThe index price offered some recent positive trading yesterday , trying to confirm continued positive with repeated stability above support
The above calls us to wait for the price to gather additional positive momentum to facilitate the task of surpassing the 4383 level and reaching the next key target positioned at 4402.
Pivot Price: 4383
Resistance Price: 4402 & 4423 & 4464
support price: 4353 & 4328 & 4298
The general trend expected for today: bullish
timeframe: 4H

DXY : The key is whether it can be maintained below 105.664Hello traders!
If you "Follow" us, you can always get new information quickly.
Please also click “Boost”.
Have a good day.
-------------------------------------
(DXY chart)
DXY is showing a decline below 105.664-106.416.
Therefore, the key is whether it can meet resistance and decline around 105.664.
The decline in DXY is because the investment market is likely to be active.
-----------------------------------------
(SPX500USD chart)
If it remains above 4369.8, it is expected to turn into an upward trend.
If not, a gradual decline is expected.
---------------------------------------------
(NAS100USD chart)
Since the HA-Low indicator on the 1D chart was created around 14328.9, if it remains above the HA-Low indicator on the 1D chart (14437.6), it is likely to continue the uptrend.
--------------------------------------------------
- The big picture
The full-fledged upward trend is expected to begin when the price rises above 29K.
This is the section expected to be touched in the next bull market, 81K-95K.
-------------------------------------------------- -------------------------------------------
** All explanations are for reference only and do not guarantee profit or loss in investment.
** Trading volume is displayed as a candle body based on 10EMA.
How to display (in order from darkest to darkest)
More than 3 times the trading volume of 10EMA > 2.5 times > 2.0 times > 1.25 times > Trading volume below 10EMA
** Even if you know other people’s know-how, it takes a considerable amount of time to make it your own.
** This chart was created using my know-how.
---------------------------------

S&P 500 - Bullish Continuation for 2024█ OVERVIEW
Since 2022, the S&P 500's consolidation efforts seem to be coming to a clear Head and Shoulders pattern, completed by a recent 3 bullish drives pattern. While it would be naive to think a straight beeline to 5000 is in play, the current price of 4350 is suggesting a return to new highs in early-mid 2024. This is likely to be in sync with the Federal Reserve rate hikes and the resulting market adjustments made at each announcement by Chair Powell. Sharing this as an educational/informative learning opportunity of technicals playing in sync with fundamentals.
█ CONCEPTS
Head and Shoulders
The inverse head and shoulders pattern is a widely recognized technical chart pattern seen on analysis across this platform. Primarily, many see the pattern used in potential trend reversals in various types of markets, particularly in stocks, currencies, and commodities.
The iH&S pattern consists of three main components:
Left Shoulder: First phase that occurs during a downtrend. Represents a temporary low - selling pressure starts to weaken and buyers start to enter
Head : Central and most important component of the pattern. The head forms after the left shoulder and becomes the lowest price level reached in the downtrend
Right Shoulder : Similar to the left shoulder in that it represents another temporary low point in the price
Three Bullish Drives
First Drive: The first drive occurs after a prolonged downtrend, during which selling pressure has dominated the market. In this phase, the price of the asset starts to show signs of stabilization or slight recovery.
Second Drive: Following the initial recovery, there is often a pullback or consolidation in price. This is the second drive, during which the asset's price retraces to some extent but doesn't make new lows.
Third Drive : The third drive is the final and critical phase of the pattern. It occurs when buyers make a strong push to drive the price higher, surpassing the previous resistance levels and confirming the trend reversal.

SPX500 to continue in the rally?US500 - Intraday
Price action has formed an expanding wedge formation.
The formation has a measured move target of 4540.
The trend of lower highs is located at 4323.
Bespoke resistance is located at 4331.
A break of 4340 is needed to confirm follow through bullish momentum.
Economic figures could adversley affect the short term technical picture.
We look to Buy a break of 4340 (stop at 4300)
Our profit targets will be 4440 and 4460
Resistance: 4323 / 4331 / 4380
Support: 4269 / 4190 / 4187
Risk Disclaimer
The trade ideas beyond this page are for informational purposes only and do not constitute investment advice or a solicitation to trade. This information is provided by Signal Centre, a third-party unaffiliated with OANDA, and is intended for general circulation only. OANDA does not guarantee the accuracy of this information and assumes no responsibilities for the information provided by the third party. The information does not take into account the specific investment objectives, financial situation, or particular needs of any particular person. You should take into account your specific investment objectives, financial situation, and particular needs before making a commitment to trade, including seeking advice from an independent financial adviser regarding the suitability of the investment, under a separate engagement, as you deem fit.
You accept that you assume all risks in independently viewing the contents and selecting a chosen strategy.
Where the research is distributed in Singapore to a person who is not an Accredited Investor, Expert Investor or an Institutional Investor, Oanda Asia Pacific Pte Ltd (“OAP“) accepts legal responsibility for the contents of the report to such persons only to the extent required by law. Singapore customers should contact OAP at 6579 8289 for matters arising from, or in connection with, the information/research distributed.

SPX UPDATE SPX UPDATE
After a strong fall, a correction has come . In order to be convinced that this minor downward trend is over, we must conquer the 10WMA and make a minimum higher high that brings us to 4400.Also Stoch RSI shows positive signs
By holding it, we are leaving the range we have been in for almost a year.
Earnings are still positive, so that added strength.
Tomorrow news to follow : Nonfarm Payrolls and Unemployment Rate

SPX500 ShortThe SPX is showing 4 variables that suggest the price will drop.
In our trading strategy, when an asset that is showing 4 variables in the same direction, we take the trade. As always the SL is one that as of right now makes sense, we will update if something changes.
The 4 edges (Variables) that suggest downside:
1. Confirmation of old channel as resistance.
2. Confirmation of 2021 high as resistance after price failed to return above it.
3. Bearish divergence on the MacD.
4. A bearish dark cloud cover/ piercing line candlestick formation (Confirmed with a negative close today).
Not to mention the asset retraced 61.8% to its recent high from low putting it in the golden zone.
We can never say an asset WILL go in a specific direction. We just look for scenarios where, based on researched methods, an asset has a higher probability of going in a direction. When multiple edges line up, we take the trade. This is one of those cases.

SPY RSI+PRICE ACTION 2nd NOV,2023This is my analysis for SPY for coming days and weeks ahead. It is still in downtrend.
I have discussed price action along with RSI in this analysis.
Hope traders can understand the logics .
NOTE:YOU HAVE NOT MISSED ANYTHING
