SPx500 4H (Pivot Price: 4457)SPx500
stabilizing above 4457 will support rising to touch 4480 then 4500 then 4525
stabilizing under 4457 will support falling to touch 4434 and then 4413
Pivot Price: 4457
Resistance prices: 4480 & 4500 & 4525
Support prices: 4434 & 4413 & 4393
timeframe: 4H
US SPX 500

SPX500USD Seeking a Bearish movement
US500 in a Clear movement upon the DIALY bias looks to be bearish with 45% win rate using your lower time frame entry check list if spotted right in the NEWYORK KILL ZONE.

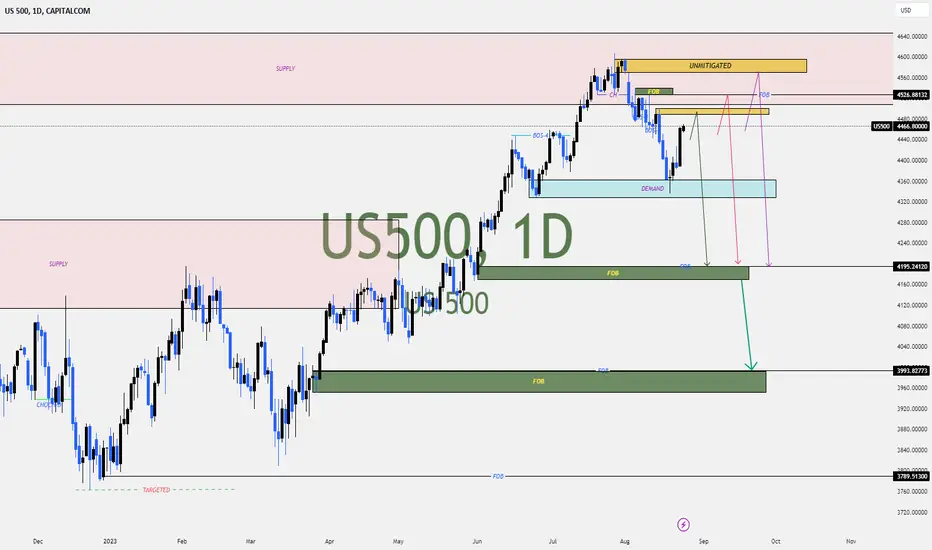
US 500On the weekly timeframe we have a change of character (CHOCH). Presently we are completing a bullish correction before resumption of the main bearish trend targeting the downside. On the daily time frame, we have a sell limit placed at the 4526 levels and take profit at 3993 price handle.
$NVDA -Potential Downside (21Aug/2023)- Welcoming NYSE opening this Week with an opened Short position on NASDAQ:NVDA taken last week due to a Broadening Wedge pattern being formed and Lower Highs Market Structure.
May be forced to Trail SL according to how markets will open
from the positive last Friday's Rally .
TRADE SAFE
*** Note that this is not Financial Advice !
Please do your own research and consult your own Financial Advisor
before partaking on any Trading Activity based Solely on this Idea.

S&P 500 H4 | Bearish reaction off 23.6% Fibo?Price is approaching our sell entry at 4401.43, which is a pullback resistance level, and at the 23.6% fibo retracement. Our stop loss is at 4449.30, which is placed slightly above the 38.2% fibo retracement and it is also a pullback resistance level. Take profit is at 4341.27, which is a multi-swing low support level.
Please be advised that the information presented on TradingView is provided to FXCM (‘Company’, ‘we’) by a third-party provider (‘Name of third party provider). Please be reminded that you are solely responsible for the trading decisions on your account. There is a very high degree of risk involved in trading. Any information and/or content is intended entirely for research, educational and informational purposes only and does not constitute investment or consultation advice or investment strategy. The information is not tailored to the investment needs of any specific person and therefore does not involve a consideration of any of the investment objectives, financial situation or needs of any viewer that may receive it. Kindly also note that past performance is not a reliable indicator of future results. Actual results may differ materially from those anticipated in forward-looking or past performance statements. We assume no liability as to the accuracy or completeness of any of the information and/or content provided herein and the Company cannot be held responsible for any omission, mistake nor for any loss or damage including without limitation to any loss of profit which may arise from reliance on any information supplied by Name of third party provider.
The speaker(s) is neither an employee, agent nor representative of FXCM and is therefore acting independently. The opinions given are their own, constitute general market commentary, and do not constitute the opinion or advice of FXCM or any form of personal or investment advice. FXCM neither endorses nor guarantees offerings of third party speakers, nor is FXCM responsible for the content, veracity or opinions of third-party speakers, presenters or participants.
High Risk Investment Warning
Trading Forex/CFDs on margin carries a high level of risk and may not be suitable for all investors. Leverage can work against you.
Forex Capital Markets Limited (www.fxcm.com):
CFDs are complex instruments and come with a high risk of losing money rapidly due to leverage. 70% of retail investor accounts lose money when trading CFDs with this provider. You should consider whether you understand how CFDs work and whether you can afford to take the high risk of losing your money.
Stratos Europe Ltd, previously FXCM EU Ltd (www.fxcm.com):
CFDs are complex instruments and come with a high risk of losing money rapidly due to leverage. 74% of retail investor accounts lose money when trading CFDs with this provider. You should consider whether you understand how CFDs work and whether you can afford to take the high risk of losing your money.
FXCM Australia Pty. Limited (www.fxcm.com): **
Trading FX/CFDs carries significant risks. FXCM AU (AFSL 309763), please read the Financial Services Guide, Product Disclosure Statement, Target Market Determination and Terms of Business at www.fxcm.com
FXCM Markets LLC (www.fxcm.com):
Losses can exceed deposits.

S&P ⇨long-term predictionhello guys...
as you can see the head of the pattern touched the flip area, this strategy is fascinating for setup!
and then formed a head and shoulders pattern and broke up the neckline very well,
so the target of this pattern is $4630
after that it is more probable if the price retraces to the QML and the neckline, let's see what happens.
______________________________
always do your research.
If you have any questions, you can write them in the comments below, and I will answer them.
And please don't forget to support this idea with your likes and comment

DXY 103.881-105.664: Section where resistance is requiredHello?
Traders, welcome.
If you "Follow", you can always get new information quickly.
Please also click "Boost".
Have a good day.
-------------------------------------
(DXY chart)
With the DXY rising above 103.025, the investment market appears to be slowing down.
On the 1W chart, the 103.881 point corresponds to the resistance section, and on the 1M chart, the 105.664 point corresponds to the resistance section.
Therefore, the key is whether it can fall with resistance in the 103.881-105.664 area.
------------------------------------------
(SPX500USD chart)
It shows a decline below the 4419.18, the HA-High indicator point on the 1M chart.
Accordingly, the key is whether it can rise with support around 4371.6.
If not, you need to make sure it is supported around 4255.2.
-----------------------------------------------
(NAS100USD chart)
The key is whether you can rise with support around 14710.6-15090.3.
If not, you need to make sure it is supported around 13418.8.
-------------------------------------------------- -------------------------------------------
** All descriptions are for reference only and do not guarantee profit or loss in investment.
** The trading volume indicator is displayed as a candle body based on 10EMA.
Display method (in order of boldest)
More than 3x 10EMA trading volume > 2.5x > 2.0x > 1.25x > trading volume below 10EMA
** Even if you know other people's know-how, it takes a considerable period of time to make it your own.
** This is a chart created with my know-how.
---------------------------------

S&P500 - BEARISH MOVE 📉Hi Traders👋🏻
On The Daily Time Frame, S&p500 Price Reached A Support Level (4463.68 - 4447.89)
Currently, This Key Level is Broken📉
The Support Line is Broken🔥
So, I Expect a Bearish Move📉
i'm waiting for a retest...
-----------
TARGET: 4408.00🎯
___________
if you agreed with this IDEA, please leave a LIKE, SUBSCRIBE or COMMENT!

Update SPX500 👴📣Update SPX500
I'm doing some tests with a new indicator.
In the case of this asset, we may be at a local top at 5056 and a bottom close to 2691, let's follow, I'm testing the new indicator that I developed within the global markets index and I've been getting many positive results.
Follow me and share with a friend to encourage me to make the bookmark available to you in the future.

SPX Perfect Head & ShouldersExpect SPX to trade in-range for 2 weeks. If 4610 is broken and held for few sessions(5?), there is a good chance next leg up will have October in 4800s

SPx500 4H (Pivot Price: 4447)SPx500
stabilizing above 4447 will support rising to touch 4469 then 4491 then 4508
stabilizing under 4447 will support falling to touch 4432 and then 4421
Pivot Price: 4447
Resistance prices: 4469 & 4491 & 4508
Support prices: 4432 & 4421 & 4407
timeframe: 4H


The key is whether DXY can find resistance around 102.034Hello?
Traders, welcome.
If you "Follow", you can always get new information quickly.
Please also click "Boost".
Have a good day.
-------------------------------------
(DXY chart)
The key is whether it can get resistance around 102.034 and drop.
----------------------------------------
(SPX500USD chart)
The HA-High indicator on the 1W chart is about to form at point 4478.4.
Therefore, it is important to be able to ascend with support near this point.
If not, you need to make sure you get support around 4419.8.
-------------------------------------------
(NAS100USD chart)
The HA-High indicator on the 1W chart is about to form at 15379.1.
Unlike the SPX500USD chart, NAS100USD is located below the HA-High indicator point of the 1W chart, which is about to be created, so it seems to fall more than expected.
So, the question is whether it can rise above 15379.1.
If not, you should check for support around 14710.6.
-------------------------------------------------- -------------------------------------------
** All descriptions are for reference only and do not guarantee profit or loss in investment.
** Even if you know other people's know-how, it takes a considerable period of time to make it your own.
** This is a chart created with my know-how.
---------------------------------

SPX500SPX500 was in bearish mode for the end of the week.. I anticipate a bounce up off demand for a short bullish run.. still see bearish overall. Let's see.

SPY Analysis 13th August|418 levelsThis is the weekly analysis for SPY and what I am expecting from market.
NOTE: MARKET LOOKS TO GO DOWN

SPX500USD Set To Grow! BUY!
My dear subscribers ,
SPX500USD looks like it will make a good move, and here are the details:
The instrument tests an important psychological level 4483.2
Bias - Bullish
Technical Indicators: Supper Trend gives a precise Bullish signal, while Pivot Point HL predicts price changes and potential reversals in the market.
Target - 4508.2
My Stop Loss - 4469.3
About Used Indicators:
A super-trend indicator is plotted on either above or below the closing price to signal a buy or sell. The indicator changes color, based on whether or not you should be buying. If the super-trend indicator moves below the closing price, the indicator turns green, and it signals an entry point or points to buy.
———————————
WISH YOU ALL LUCK

Much More Dangerous than The Dotcom Bubble According to the World Famous trader W.D. Gann, the ideal advancing angle in an uptrend is 45 Degrees. In other words, 45 Deg. is a perfect balance between supply and demand. However, even in the Dotcom Bubble, the trend angle was less steep than the current trend. This indicates a much more downward potential than the 2000s burst. Stay Safe!

SPX500USD Is Going Up! Buy!
Please, check our technical outlook for SPX500USD.
Time Frame: 6h
Current Trend: Bullish
Sentiment: Oversold (based on 7-period RSI)
Forecast: Bullish
The market is testing a major horizontal structure 4481.4.
Taking into consideration the structure & trend analysis, I believe that the market will reach 4535.6 level soon.
P.S
Please, note that an oversold/overbought condition can last for a long time, and therefore being oversold/overbought doesn't mean a price rally will come soon, or at all.
Like and subscribe and comment my ideas if you enjoy them!

BTC PUSHNice push to the top side out of a pinch. FaKe out? I may have pulled the trigger a little eary but im looking at the 32.5k Level for a tafget< Bitcoin has be struggling at this 30 k level so I wanna be cautious of a sell off. Lets see where it takes us.

$SPY otw LH or HHSPY has made a recent LH into LL WE WILL retrace momentum of imbalances caused by this LL i expect LH with a HL on 1-4 hour time frames in the next 48 hours

Upward trend may continue till year end with minor corrections.The current upward trend, which began on October 20, 2022, at a low of 3491, may last through the end of the year, reaching levels of 4900–5000. From there, we might observe a correction of 15%–18%.

Gold price today: slight increaseWorld gold price listed on Kitco is at 1,942 USD/ounce, up 8 USD/ounce compared to the early hours of yesterday morning. December gold futures last traded at $1,976.1 an ounce, up $7.3.
According to some market analysts, the gold market may be struggling to find traction as inflation remains a major concern and could force the US Federal Reserve (Fed) to continue raising prices. interest rates after summer.
Naeem Aslam, chief investment officer at Zaye Capital Markets, forecasts the gold market will continue to struggle as the latest data shows no clear clues as to the path of the next Fed tightening. The market will have to wait for inflation data to be released next week. He said that traders can stay on the sidelines until there are signs that inflation is trending down significantly.

How does the world gold price change today?The global price of gold slightly dropped to $1,936 per ounce and has remained low for the past three weeks. Despite the US credit rating downgrade, the dollar continues to trade at its highest level in the past month, which has contributed to the decline in gold prices.
Additionally, the 10-year US Treasury bond yield reached a nine-month high at 4.1360%. On August 3, the Bank of England raised interest rates by 25 basis points, reaching a 15-year high.
Investors are currently awaiting the release of the US jobs report, which could impact the Federal Reserve's policy stance. Ryan McKay, a commodity strategist at TD Securities, emphasizes the significance of this data, particularly given the recent positive economic indicators in the US, which have influenced market sentiment and the possibility of the Fed maintaining higher interest rates for a longer period.
