SPX - Structure & Downside TargetsSPX continues to trend after failing to break resistance at $4200 (floor of H&S market top) - 4 touches on my count.
- Environment: Support for banks tricking folk into thinking there is QE. Analysts with Bearish scenarios are being shot down by critics.
Waiting for this market to make a decision - Value is to the downside, Bearflag TP would support the following targets - first stop $3300. TA at key Fib @2900, Stretch, $2800
Best, Hard Forky
Short Top
US SPX 500

$SPY bull market? Nope. Here are the important levels from here.There are many people who have turned long term bullish because they've been surprised by the recent move to the upside. And while my short term bias did turn bullish on Jan 4th, I think we're closer to a local top than we are to seeing a new bull market commence from here.
I came across this old chart today-- it has to be one I created over a year ago, and what was interesting to me when I pulled it up is the levels that were marked off back then have all been tagged as support or resistance since the bear market has begun. $428, $358, $322 and $287. I added a couple extra levels onto the chart $276 and $421 as potential support/resistances and/or to account for wicks.
That said, I think these will end up being important levels on the way down for continuation of the bearish trend.
I am not one to buy into the idea that we are in a new bull market. In fact, I think quite the opposite. The worst of the bear market is yet to come. I think the two levels above from here $421 and $428 will end up being important resistance levels. And if we can't close above those levels, then we'll end up seeing continuation to the downside.
I think we'll end up getting below $300 in the S&P to the lower support targets by September/Octoberish timeframe. I've marked off key dates to watch for changes in price action.
Good luck trading this, I have a feeling that the market is going to get increasingly difficult to trade from here.

Is there stock market drop based on around SPX possible? As we have all seen, the stock market has been on a steady rise for some time now, but I fear that we may be on the brink of a significant drop.
There are several reasons for my concern. While governments and central banks have taken measures to mitigate the effects of this past pandemic disruption, the long-term impact on the economy is still uncertain.
Secondly, we are seeing signs of overvaluation in many sectors of the market. Companies that are not yet profitable are seeing their stock prices soar, and the valuations of some of the largest tech companies are reaching levels that are difficult to justify.
Finally, we are seeing a significant increase in market volatility, with large swings in both directions becoming more common. This volatility is a clear sign that investors are becoming increasingly uncertain about the future of the market.
Given these factors, I believe it is important for traders to be wary of the current stock market rally. While it is always difficult to predict the future, I believe that the risks of a significant market drop are high.
As such, I encourage you to be cautious in your trading decisions and to consider taking steps to protect your investments. This could include diversifying your portfolio, investing in defensive sectors, or even reducing your exposure to the market altogether.
In conclusion, I urge you to take these warnings seriously and to be prepared for the possibility of a significant market drop. While I hope my concerns are unfounded, I believe it is better to be safe than sorry.
SPX500 Next MovePair : SPX500
Description :
Completed : Impulsive Wave " 12345 " and Corrective Wave " A ( 12345 ) " Corrective Wave
Impulse Correction
RSI - Divergence
Break of Structure
Bullish Channel in STF as an Corrective Pattern
Consolidation Phase
S / R Level

Riding the hype: Why gut investments can lead to lossesInvesting in exciting and promising prospects, such as all-healing biotech or artificial intelligence and robotics companies, where investors look for stocks with interesting stories, is all the rage right now. In the long run, however, this is not always a good strategy, as most of these stocks do not generate sustainable profits and eventually disappear into oblivion. Even the biggest companies in the fast-moving technology sector often disappear. It is an emotional challenge to resist the pull of good stories, but historical experience shows that it is more rational to avoid such stocks.
A lower number of shares outstanding is usually good for returns. Companies with a declining number of shares have outperformed the market by about 3% per year over the past 100 years. In contrast, companies with an increasing number of shares have underperformed the market. These correlations are consistent across market phases and industries. Companies that continually raise capital tend to be poor investments because they often have no or negative cash flow and are constantly dependent on the capital market.
Issuing employee options dilutes shares and hurts shareholders. Many companies simply exclude the cost of options to improve profitability. However, this increases the number of shares outstanding and dilutes shareholder ownership. Buying back shares on credit can also be problematic because higher interest rates can hurt earnings per share. Companies should fund share repurchases out of free cash flow rather than by increasing debt. Share buybacks are particularly useful in value investing, where undervalued shares are purchased. Buybacks increase ownership and future earnings without requiring shareholders to put up additional capital. This leads to an increase in earnings per share, especially when profits are rising.
It is therefore worth monitoring the share count and avoiding companies that cannot finance themselves or have large employee option programs.

SPX500USD The Target Is UP! BUY!
My dear subscribers ,
SPX500USD looks like it will make a good move, and here are the details:
The instrument tests an important psychological level 4282.6
Bias - Bullish
Technical Indicators: Supper Trend gives a precise Bullish signal, while Pivot Point HL predicts price changes and potential reversals in the market.
Goal - 4330.1
My Stop Loss - 4255.7
About Used Indicators:
By the very nature of the supertrend indicator, it offers firm support and resistance levels for traders to enter and exit trades. Additionally, it also provides signals for setting stop losses
———————————
WISH YOU ALL LUCK

SPX500USD: Will Keep Growing! Target for Buyers is: 4350.4
The analysis of the SPX500USD chart clearly shows us that the pair is finally about to go up due to the rising pressure from the buyers.
❤️ Please, support our work with like & comment! ❤️

SPX500USD Is Going Down! Short!
Take a look at our analysis for SPX500USD.
Time Frame: 1D
Current Trend: Bearish
Sentiment: Overbought (based on 7-period RSI)
Forecast: Bearish
The market is approaching a significant resistance area 4279.4.
Due to the fact that we see a positive bearish reaction from the underlined area, I strongly believe that sellers will manage to push the price all the way down to 4177.9 level.
P.S
The term oversold refers to a condition where an asset has traded lower in price and has the potential for a price bounce.
Overbought refers to market scenarios where the instrument is traded considerably higher than its fair value. Overvaluation is caused by market sentiments when there is positive news.
Like and subscribe and comment my ideas if you enjoy them!

S&P index is Breaking through Strong Pressure !S&P index is Breaking through Strong Pressure !
This chart shows the line chart chart of the S&P index since mid August 2021. The graph overlays the line between the high and high points at the top of the S&P index, the line between recent low and low points, and the horizontal line at key positions at the current stage. As shown in the figure, the S&P index is currently showing an accelerated upward trend with an angle greater than 45 degrees. S&P index has reached a bearish starting point of 4274 before the recent bottom, and is about to challenge the neckline of 4350 at the top of the head and shoulders! In the future, we should focus on the rising speed and slope of the S&P index to determine the size of the upper space!

S&P500 to Sellside Liquidity
S&P500 DAILY TIMEFRAME / ("ESM2023" Futures Contract)
____________________________________________________
ORDERFLOW & TARGETING:
The Orderflow in S&P is Bearish. Every Bearish Orderblock and Fair Value Gap have been holding price lower. I'm looking for this Orderflow to continue being Bearish until the Sellside Liquidity gets mitigated...
S&P500 has now engineered Sellside Liquidity below current price, inducing Retail traders to Buy at this price point. Therefore, many orders are resting below these equal lows, so the market should seek this Liquidity.
TREASURY BONDS:
The Bond-Market is looking Bullish, which would indicate Lower prices in the S&P - due to their Inverse Correlation against each other.
The Bonds are aiming for their Equal Highs Buyside Liquidity:
POTENTIAL INVALIDATION OF THE IDEA:
- Although I'm Bearish... From where price is at right now - I NEED to see the current Bullish Orderblock's Equilibrium 50% traded THROUGH to the Downside with a Daily Candle closure. (The Bullish Orderblock is that Bearish candle I marked up that price is currently testing) . So right now, price is above the 50% price point, and therefore Orderflow is still Bullish short-term. Only when the first Daily Candle CLOSES Below the 50% of the orderblock is when I will be looking to Sell down into Sellside Liquidity. (The 50% of the Orderblock is at 3940. I need to see price Close Below that) .
- Market Structure is currently Bearish. However, if the Protected High (the High that caused the Lower Low - Annotated "PH" on the chart) gets traded Above (at 4057) , that would become a Bullish Market Stucture Break, and I would no longer be Bearish, but I would rather aim for Buyside Liquidity at 4245 (annotated "SMS" in the chart) .
But as long as we Remain Below the Protected High, I still hold my Bearish Bias down into the Sellside Liquidity.
So in Summary of the Invalidations...:
I need to see the Bullish orderblock's 50% get traded Down through, and only then I will start looking for selling into Sellside Liquidity.
As long as price remains below the Protected High - I'm Bearish.
#TechnicalScience ;)

S&P 500 - IMPORTANT BREAKOUT 📈Hello Traders👋🏻
On The Daily Time Frame The S&P 500 Price Broke The Resistance Level (4150.54-4196.30)✔
Currently, The Resistance Level Becomes New Support Level📈
So, I Expect a Bullish Move📈
-----------
TARGET: 4274🎯
___________
if you agreed with this IDEA, please leave a LIKE, SUBSCRIBE or COMMENT!

SPX500 New Week Possible MovePair : SPX500 Index
Description :
Bullish Channel in Short Time Frame and Long Time Frame as an Corrective Pattern
Break of Structure
RSI - Divergence
SMC - CHOCH
Completed " 12345 " Impulsive Waves
Fibonacci Level - 38.20%
Winning or losing a trade depends on your state of mindHello?
Traders, welcome.
If you "Follow", you can always get new information quickly.
Please also click "Boost".
Have a good day.
-------------------------------------
(DXY chart)
The 102.034-105.873 section is a volatility section, and depending on which direction you deviate from this section, the movement of the investment market is expected to change.
Therefore, if it falls below 102.034, the investment market is expected to revitalize.
Otherwise, if it rises above 105.873, the investment market is likely to enter a recession.
Where do you think DXY is heading right now?
My thoughts are that I don't know the direction yet, but I think it's right.
I believe that investment and trading are determined to fail even before investing or trading according to one's psychological state.
The moment you invest or trade with a nervous mind or excitement, you will suffer from more psychological conflicts, so there is a high possibility that you will not get a big return or the transaction will fail in the end.
So, if your mind is currently in a state of nervousness, anxiety, excitement, etc., you should stop trading and observe the situation.
----------------------------------------------
(SPX500USD chart)
Looking at the 1D chart, it shows a rise to the resistance area of 4255.2-4310.8.
Therefore, the key is whether or not you can ascend with support in this section.
Looking at the 1M chart, the HA-High indicator on the 1M chart is long at 4419.8.
Therefore, it is necessary to check whether it is supported in the 4310.8-4588.6 section.
"So, what are you going to do?" you may ask.
You yourself already know the answer.
As I said in the description of the DXY chart, you have already made your own conclusions.
However, it is only a state in which it has not been decided whether to proceed with the current transaction or to wait according to the decision.
why? I would like you to think about whether you wrote down the 4255.2-4310.8 section as a resistance section.
The biggest reason I said it was a resistance zone is because I think that if it rises above this zone, it is highly likely to surge.
The reason why it is likely to surge is because it touched this section in August 2022, the previous high, and showed a decline.
Therefore, if it rises above this range, it is highly likely that you will proceed with the purchase without checking whether it is supported.
(1D chart)
(1W chart)
(1M chart)
Therefore, when looking at charts, you should look at the 1M chart first, then the 1W chart, then the 1D chart, not the 1D chart and then the 1M chart.
That way, you will be able to hold the overall picture of the chart in your mind, which will help you prevent your psychology from being shaken by small waves.
However, most of them don't do that, and by looking at the time frame chart they are trading first, their psychological state is agitated by small fluctuations even before making a trading strategy, so there is a high possibility of making a trading strategy in the wrong direction.
So, regardless of your investment style, that is, the investment period, you are shaken by small fluctuations, so you are sensitive to the current movement even though it is a mid- to long-term investment.
In the case of day tradng or short-term trading, there is no need to see a big trend.
If you plan to conduct day trading or short-term trading, but create a trading strategy based on the big trend, there is a possibility that you may not be able to stop loss when you should stop or sell when you need to split.
This is the cause of fatal mistakes when conducting day trading or short-term trading.
Therefore, you should create a trading strategy based on your own investment style, i.e. a time frame chart that fits your investment period.
-------------------------------------------------- ------------------
(NAS100USD chart)
It is approaching the 14710.6-15090.3 area, an important support and resistance zone.
Therefore, the key is whether you can ascend to this section and be supported.
Looking at the 1M chart, you can see why the 14710.6-15090.3 area is an important support and resistance zone.
As you approach what I'm talking about as this important segment, those waiting to trade are likely to be in a very excited state.
Because, once it rises above this important range, you start to think that you can get a bigger return by buying it at a lower price because you think it's likely to show a big uptrend.
Therefore, there may be cases in which you proceed to buy before you can confirm whether you are supported or resisted by rising to the important zone, that is, the support and resistance zone.
It is tedious to check whether you are supported or resisted, and since psychological agitation occurs hundreds of times a day, your psychological burden will increase enormously.
This increase in psychological burden makes it impossible to wait until it rises, which is the main cause of not obtaining large profits or increasing losses.
Therefore, you must check whether you are supported or resisted by entering the important section where you must check the support and resistance section.
Even if you buy at a higher price, if your psychological state is stable, you can get a bigger profit when you see a big rise.
-------------------------------------------------- -------------------------------------------
** All descriptions are for reference only and do not guarantee profit or loss in investment.
** Even if you know other people's know-how, it takes a considerable period of time to make it your own.
** This is a chart created with my know-how.
---------------------------------

SPX500USD Is Going Down! Sell!
Take a look at our analysis for SPX500USD.
Time Frame: 1D
Current Trend: Bearish
Sentiment: Overbought (based on 7-period RSI)
Forecast: Bearish
The market is approaching a significant resistance area 4282.7.
The above observations make me that the market will inevitably achieve 4181.5 level.
P.S
The term oversold refers to a condition where an asset has traded lower in price and has the potential for a price bounce.
Overbought refers to market scenarios where the instrument is traded considerably higher than its fair value. Overvaluation is caused by market sentiments when there is positive news.
Like and subscribe and comment my ideas if you enjoy them!

Ignore the noise follow the data.There is so much fear in the market right now, in the past I presented a few bullish analysis showing that we may have bottomed and a bullish megaphone pattern. In this idea, I am presenting data that goes back all the way to 1964 which tells us that the trend is up.
looking at the 6month chart we can see that from 1964-1974 we had a side ways action (lost decade). Once we broke that the market went on a meteoric rise before we got rejected at the 4.618 Fibonacci but ended up rallying to the 23.1618. We then had another sideways actions from 1999 to 2009 (another lost decade) before we got rejected at the 4.618 again while the candles are very similar. Its fascinating how history can repeat it self.
So to summarize from 1964-1974 we had a 23.1618 that led to the 1999-2009 lost decade. Since 2009 we are in another extension and like the last extension we are being stopped at the 4.618 extension. While there are so many narratives out there, the data does not lie and seems to point that we are only repeating history. Will we continue to the 23.1618? I believe we will.
Note: the 1964-1974 and 1999-2009 where both bullish megaphone pattern.
Please like this post if you find this research helpful as it take a lot of time to put together.
Please do your DD as this is not a financial advice.

ES/SPX500 Drop offLooking for a drop off to occur in the market soon.
Seasonality wise speaking June tends to be negative. Thus, I would like to see a drop in the next couple of weeks.
There is the August high which looks tempting as a DOL and there is a FVG left back in April 2022. I will watch price when we engage in both of those levels and will see how price reacts, if correct price action is seen for the bears to take over, I will short.
The targets are also outlined, and once reached, will re-evaluate the scenario to see if we get further downside.

Unemployment in the U.S. and 13 states to watch out forWith the unemployment data being scheduled for release today, we would like to focus on this topic. Previously, we stated that historically, each 1% rise in unemployment within the United States was accompanied by a recession. Therefore, today, we want to highlight a few interesting trends in unemployment with regard to specific states rather than a whole country. Below, we list 13 states that stood out to us and which might be worth to be paying attention to (in the remaining 37 states, unemployment was either still declining or not showing any significant growth in the past year, although that does not mean that they are less worthy of watching out for).
Unemployment trends in particular states:
- District of Columbia - up from 3.9% in August 2022 to 5% in April 2023 (+1.1% increase).
- Oregon - This state saw unemployment rise from 3.5% in March 2022 to 4.8% in October 2022. Then the unemployment rate stayed unchanged until February 2023, when it started to tick down. In April 2023, the unemployment in Oregon stood at 4%.
- Kentucky - Unemployment in Kentucky rose from 3.3% in December 2022 to 4.6% in February 2023. Then, it quickly declined in the following two months, printing 3.2% in April 2023. Though, we would like to emphasize that changes in the unemployment rate in Kentucky are historically volatile, at least based on the FRED’s data.
- Wyoming - The unemployment rate was 3.2% in April 2022 and rose to 3.9% in October 2022. Then similarly, like in Kentucky, it stayed unchanged until February 2023. After that, the rate started to decline, reaching 3.5% in April 2023.
- New Jersey - In New Jersey, the unemployment rate stood at 2.8% in September 2022. In February 2023, this figure rose to 4.1% and then started to decline. In April 2023, unemployment was down to 3%.
- Virginia - The unemployment in Virginia was 2.5% in June 2022. In November 2022, it rose to 3.2%. Since then, the unemployment rate in the state remained between 3.1% and 3.2%.
- Kansas - In Kansas, unemployment rose from 2.4% in April 2022 to 3% in November 2022. After that, it continued to print 2.9% in the next five months.
- Minnesota - The unemployment in Minnesota rose from 2.3% in April 2022 to 3% in November 2023. In April 2022, it came in at 2.8%.
- Iowa - At the start of the second quarter of 2022, Iowa's unemployment rate was 2.3%. In September 2022, it reached 3.1%; later, in December 2022, it started declining. Unemployment in Iowa reached 2.7% at the start of the second quarter of 2023.
- Missouri - In June 2022, the unemployment rate in Missouri was trending at 2.1%. Then, in October 2022, it reached 2.7%, where it held until February 2023. In April 2023, this figure came in at 2.5%.
- Vermont - In Vermont, unemployment rose by 0.9% between April 2022 and October 2022. However, after that, it started to fall, hitting 2.4% in April 2023.
- New Hampshire - In April 2022, the unemployment rate in New Hampshire equaled 2.1%. In October 2022, it was already at 2.9%. However, it started to fall in January 2023 and erased the whole rise in April 2023.
- Nebraska - In April 2022, unemployment stood at 2% in Nebraska. After that, it started to rise, reaching 2.7% in December 2022. Despite this uptick, unemployment quickly fell to 2% by the end of April 2023.
Please feel free to express your ideas and thoughts in the comment section.
DISCLAIMER: This analysis is not intended to encourage any buying or selling of any particular securities. Furthermore, it should not be a basis for taking any trade action by an individual investor. Therefore, your own due diligence is highly advised before entering a trade.

US500 to find support at next Fibonacci retracement?US500 - Intraday - We look to Buy at 4155 (stop at 4135)
Levels close to the 50% pullback level of 4170 found buyers.
A Fibonacci confluence area is located at 4164.
Bespoke support is located at 4150.
There is scope for mild selling at the open but losses should be limited.
Although the anticipated move higher is corrective, it does offer ample risk/reward today.
Our profit targets will be 4205 and 4215
Resistance: 4220 / 4230 / 4235
Support: 4168 / 4164 / 4120
Risk Disclaimer
The trade ideas beyond this page are for informational purposes only and do not constitute investment advice or a solicitation to trade. This information is provided by Signal Centre, a third-party unaffiliated with OANDA, and is intended for general circulation only. OANDA does not guarantee the accuracy of this information and assumes no responsibilities for the information provided by the third party. The information does not take into account the specific investment objectives, financial situation, or particular needs of any particular person. You should take into account your specific investment objectives, financial situation, and particular needs before making a commitment to trade, including seeking advice from an independent financial adviser regarding the suitability of the investment, under a separate engagement, as you deem fit.
You accept that you assume all risks in independently viewing the contents and selecting a chosen strategy.
Where the research is distributed in Singapore to a person who is not an Accredited Investor, Expert Investor or an Institutional Investor, Oanda Asia Pacific Pte Ltd (“OAP“) accepts legal responsibility for the contents of the report to such persons only to the extent required by law. Singapore customers should contact OAP at 6579 8289 for matters arising from, or in connection with, the information/research distributed.

ESM 2023 LONG + ANALYSISFor ES :
we have OB in weekly TF (4189.50) so we want to see it like a support, and we have relative equal highs in (4247.75) we want to see it a target for the week
In the daily TF we have a balance price range (BPR) from (4186.50-4175.75) , and we've drop to 50% of the daily range (4178.25) .
note: weekly and daily we have a bullish bias
In the H4 market has dropped to BISI (4181.75-4162.75) , and also in H1 has dropped to FVG (4182.00-4173.75).
note: H4, H1, also bullish.
Now my first target is 50% of the range 4208.00 then:
4214.25
4218.50
4232.00

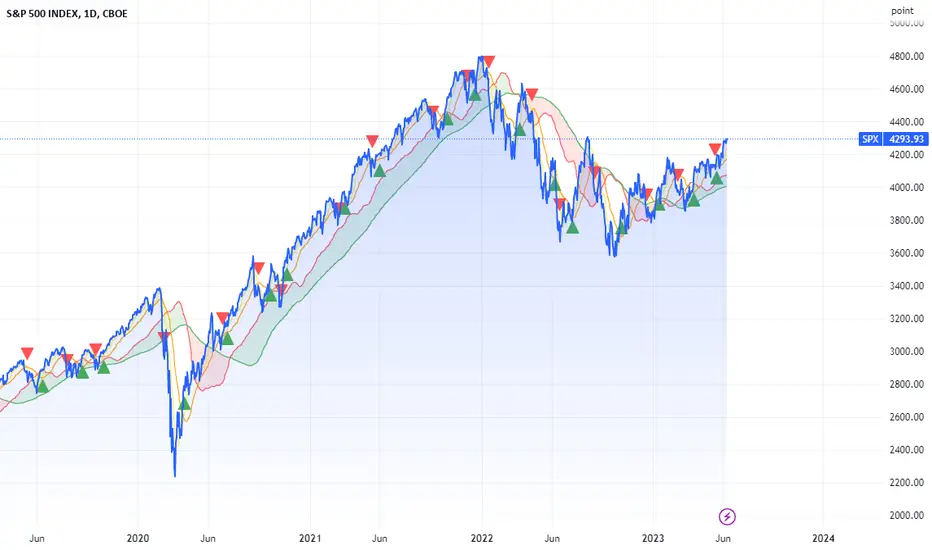
💥 S&P 500 INDEX SPX 1D-TIMEFRAME💥 S&P 500 INDEX SPX 1D-TIMEFRAME ANALYSIS
💗Hello ladies and gentlemen
This is my new idea for 💥💥 S&P 500 INDEX SPX
I hope my idea is clear
Support me by like and share thank you
Stay Safe💯💲💲💲
Good luck💰😍

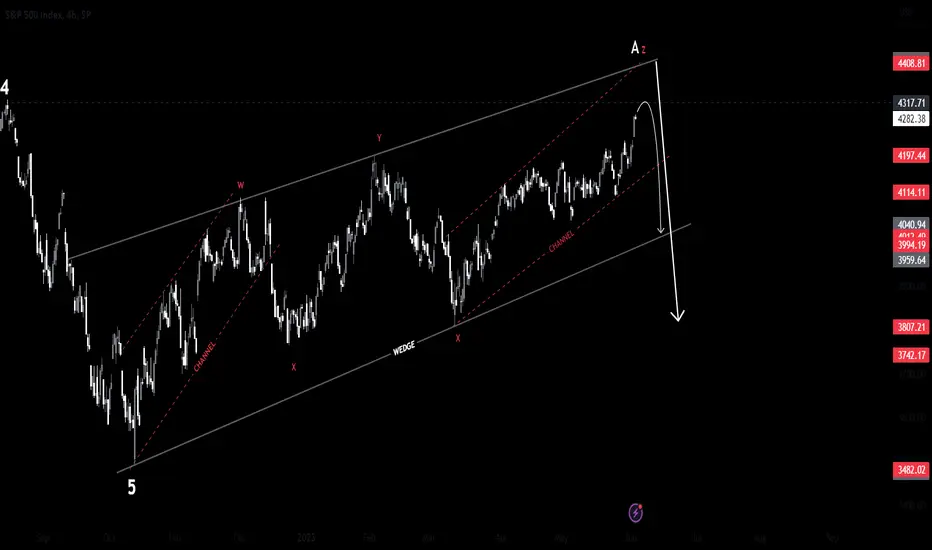
💥SPX 4H-TIMEFRAME ANALYSIS💥 S&P 500 INDEX SPX 4H-TIMEFRAME ANALYSIS
💗Hello ladies and gentlemen
This is my new idea for 💥S&P 500 INDEX
I hope my idea is clear
Support me by like and share thank you
Stay Safe💯💲💲💲
Good luck💰😍

SPX500USD: Short Trading Opportunity
SPX500USD
- Classic bearish setup
- Our team expects bearish continuation
SUGGESTED TRADE:
Swing Trade
Sell SPX500USD
Entry Level - 4212.9
Stop Loss - 4232.0
Take Profit - 4184.1
Our Risk - 1%
❤️ Please, support our work with like & comment! ❤️

SPX500USD Will Move Higher! Buy!
Here is our detailed technical review for SPX500USD.
Time Frame: 9h
Current Trend: Bullish
Sentiment: Oversold (based on 7-period RSI)
Forecast: Bullish
The market is approaching a key horizontal level 4229.3.
Considering the today's price action, probabilities will be high to see a movement to 4282.5.
P.S
We determine oversold/overbought condition with RSI indicator.
When it drops below 30 - the market is considered to be oversold.
When it bounces above 70 - the market is considered to be overbought.
Like and subscribe and comment my ideas if you enjoy them!
