SPX clear breakout targets 4400-4500Hello, everyone.
My previous idea a week ago had a bearish outlook on SPX.
However things have changed, as we now have a clearly defined outbreak in the RSI.
The target range now is 4400-4500.
Depending on how the market opens on Tuesday. I may open long position.
Good luck everyone.
Stay safe, stay liquid.
US SPX 500

The meaning of DXY raised to the boundary section is...Hello?
Traders, welcome.
If you "Follow", you can always get new information quickly.
Please also click "Boost".
Have a good day.
-------------------------------------
(DXY chart)
The investment market is showing a correction as DXY rises above 103.494.
The 102.034-103.494 and 104.738-105.873 sections marked on the 1D chart are boundary sections, and it is expected that the investment market will also move in the direction of departure from this section.
When DXY rises, it means that the investment market is likely to gradually enter a downturn.
The term investment market here refers to a market other than a business that generates profits through actual production. (Stocks, cryptocurrency, real estate, etc.)
------------------------------------------
(SPX500USD chart)
The key is whether it can continue its upward trend along the upward trend line drawn on the 1M chart.
Therefore, it is necessary to check whether it can rise above 4310.8.
If not, you should check if it is supported or resisted around the 4104.9-4137.1 mark on the 1D chart.
-------------------------------------------------- -
(NAS100USD chart)
The rise above the HA-Low indicator on the 1M chart suggests that we are entering a long-term buying season.
The first sell zone for this flow is around 14710.6.
Since it broke above the 12896.2-13418.8, the volume profile of the 1W chart, an uptrend is expected around 14117.5.
If it fails to move up, you should check for support around the 13231.6-13480.9 area marked on the 1D chart.
-------------------------------------------------- -------------------------------------------
** All descriptions are for reference only and do not guarantee profit or loss in investment.
** Even if you know other people's know-how, it takes a considerable period of time to make it your own.
** This is a chart created with my know-how.
---------------------------------

Spx 🌊Salutations,
At this present moment, I find it challenging to elucidate the precise reasoning as to why the S&P 500 was poised to recede back to the melancholy depths of the pandemic lows.
Nevertheless, I can confidently postulate the resurgence of a risk-on environment in the aftermath.
ideally as we approach the yuletide chill of Christmas Eve at the conclusion of this present year,
I cast my net at $2,100 as the absolute nadir of this grizzly mark-down-phase.
---
Upon a successful breach of this strategic area,
I am further prophesizing a subsequent phoenix-like rise,
elevating us to a commanding $7,777 threshold as we stride valiantly into the year 2030 through a vortex of an ending diagonal.
---
2024 - $2,111
2030 - $7,777
2035 - $12,222
☿

ES1! - SPX - Could be Bullish Flip!CME_MINI:ES1!
CME_MINI:ES1! has broken resistance as Wall Street continues to monitor the situation surrounding the debt ceiling with hopes of a deal being reached.
This breakout needs to hold via a retest or Bullish pullback for Stocks upside.
If it's a fake out, look for potential shorts via LTF e.g. 4h
CRYPTOCAP:BTC is like a tech stock and when it's coupled to the ES1! it moves with.
Always having Plan A and Plan B scenarios so we can react once the markets provide an opportunity to execute our edge.
If you liked this idea or if you have your own opinion about it, write in the comments.
The information and publications are not meant to be, and do not constitute, financial, investment, trading, or other types of advice or recommendations.

SPX500 Index Next MovePair : S&P 500 Index
Description :
Impulse Correction
Completed " 12345 " Impulsive and " abc " Corrective Wave
Divergence
Break of Structure
Falling Wedge
Consolidation
Bullish Channel in Long Time Frame as an Correction

Big Short On SPX500 According to the US30 analysis, the price of spx500 can also have a down trend in the long term

S&p500 Golden Swing Opportunity We are in a very crucial zone in terms of time and price on Sp500 right now and people who make the right decisions will make money.
But to make the right decisions you must look at the data and filter out all the noise and be patient.
I have presented my case for incoming selloff a few times before and now it's all coming together. I have provided the links to my previous posts below, please go over them to get the full picture.
I am building shorts in 4185 to 4230 Area and there are several reasons for that.
Technical Reasons:
1. On the chart I have a large parallel channel. Currently the price is hovering
near the top edge of the channel. This itself is a reason to look for shorts here.
2. Chart also has an indicator which shows 9 count sell signals as per TD sequential
method. Notice what happened last time when the price was near the top of the channel.
We got two consecutive nine count sell signals and as soon as price hit the top of the
channel multi month sell off began. We have something remarkably similar going on right
now.
3. Last time when we were near the top of the channel, we had bear divs on RSI and Money
flow, we have them now as well.
4. We have harmonics ratios providing heavy resistance from 4214 region and upwards.
5. Another thing to notice is 4300 is 61.8 retracement level of the move from the top, That's
another reason to build shorts here, one should not wait for 4300 to be hit to build short, as
its absolute top and may not get hit due to other factors I mentioned above.
If we begin the selloff in the coming weeks, we are looking at a possible 30% drop from current levels, in the next 3 to 4 months. I have provided these targets and measures based on past price action from top of the channel to the bottom, this of course is not going to be 100% accurate can change based on future market moving events.
We also have below confluences for targets motioned in the chart above: June 14th We have Fed event, and SPX has been moving in the highlighted disjoint channel for a while so if we intersect 14th June with the channel we get the max upside and downside targets.
Fundamental reasons:
1. The Fed's actions to raise interest rates are likely to slow the economy, which will lead to a recession. The Fed has said repeatedly they will continue to raise rates to bring down inflation to the target goal of 2% which is not yet achieved so no rate pauses as institutions and new media like people to believe.
2. Debt Ceiling battle: With no resolution in sight, the uncertainties surrounding this event could be the trigger to start the selloff although I am not discounting the possibility of a manipulative rally to 4300 which is a fantastic opportunity to build shorts.
2.1 If there is no resolution on this topic and US defaults everyone knows what will happen
, so, until that is resolved all the contrarian traders should be extremely cautious.
If you like my content, then please boost, and share this post. I have over 6 years of trading and investing experience and have learned a lot in this time. I like to share what I have learned. If you would like to learn from my experience then follow me on trading view to get notified on my trade, market projections and several upcoming technical analysis and in-depth tutorials on technical Indicators. You can also leave a comment and let me know if you want me to look at any specific asset or want to learn about any specific topic in the world of Technical Analysis. I Will do my best to create a post for it.
Keep learning and Happy trading All.

The S&P 500 Death BedIn this analysis, we explore the potential consequences of a US debt ceiling default on the S&P 500, one of the most widely followed stock market indices. We believe that if the debt ceiling issue remains unresolved, we could witness a significant downside in the S&P 500, comparable to the crisis experienced in the US economy in 2008. Our analysis suggests a selling zone between 4,154.77 and 4,290.49, with an initial target of 3,090.41 and a final target of 2,034.79.
1. The US Debt Ceiling Crisis:
The US debt ceiling refers to the limit on the amount of debt the US government can incur. Failure to raise the debt ceiling can lead to a default, causing significant disruptions in financial markets and a potential decline in investor confidence.
2. Historical Parallels:
Drawing parallels to the 2008 financial crisis, which triggered a major downturn in the US economy, we anticipate a similar scenario if the debt ceiling issue remains unresolved. Such a crisis could have a substantial impact on the S&P 500, potentially leading to a significant downside movement.
3. Selling Zone and Potential Targets:
Our analysis identifies a selling zone between 4,154.77 and 4,290.49. This range represents a critical area of resistance and selling pressure for the S&P 500. Traders should pay close attention to price action within this zone as it could provide valuable insights into market sentiment.
Regarding potential targets, we project an initial target of 3,090.41. This level represents a significant decline from current market levels and aligns with historical support levels. Our final target is set at 2,034.79, signifying a more substantial downturn in the event of an extended debt ceiling crisis.
4. Impact of Debt Ceiling Default:
A debt ceiling default scenario could result in a loss of investor confidence, increased market volatility, and a potential flight to safe-haven assets. These factors, coupled with concerns about the US economy, could significantly impact the S&P 500 and contribute to a potential deathbed scenario.
While it is important to note that this analysis is based on the assumption of a debt ceiling default, traders and investors should remain vigilant about the potential risks associated with such a scenario. The S&P 500 death bed analysis suggests a selling zone between 4,154.77 and 4,290.49, with initial and final targets at 3,090.41 and 2,034.79, respectively. Traders are advised to exercise caution, implement appropriate risk management strategies, and closely monitor market developments to navigate potential challenges and capitalize on opportunities.
Disclaimer: This analysis is for informational purposes only and should not be considered financial advice. Trading involves risks, and traders should conduct their research and analysis before making any investment decisions.

S&P 500 Futures Record Modest Gains, Reaching Highest Since Aug.S&P 500 Futures are displaying slight upward movements, reaching their highest levels since August. Market participants are closely monitoring two key factors: the upcoming speech by Federal Reserve Chairman Jerome Powell and the ongoing negotiations surrounding the US debt ceiling. Traders are particularly focused on these developments as US President Joe Biden is reported to have a decision deadline to avert a default by Sunday.
Amidst this backdrop, our analysis indicates the potential for a bullish impulse in the short-term timeframe.

SPX500USD A Fall Expected! SELL!
My dear friends ,
Please, find my technical outlook for SPX500USD below:
The price is coiling around a solid key level - 4166.7
Bias - Bearish
Technical Indicators: Both Super Trend & Pivot HL indicate a highly probable Bearish continuation.
Target - 4131.0
About Used Indicators:
Pivot points are a great way to identify areas of support and resistance, but they work best when combined with other kinds of technical analysis
———————————
WISH YOU ALL LUCK

It is breaking out of a medium- to long-term downtrend channelHello?
Traders, welcome.
If you "Follow", you can always get new information quickly.
Please also click "Boost".
Have a good day.
-------------------------------------
(DXY chart)
It is breaking out of the down channel on the 1W and 1D charts and showing an uptrend.
However, looking at the 1M chart, it seems that it will enter the rising channel only when it rises above 103.494.
Therefore, it is necessary to check whether it rises above 103.494.
If it finds resistance near 102.888-103.494 and declines, I would expect a decline below 100.
If not, a move above 103.494 is expected to create a new upside wave.
In order for the investment market to be active, I think it should show sideways below 101.494.
-------------------------------------------------- ------
(SPX500USD chart)
It is necessary to check whether it moves out of the 4104.9-4137.1 section and moves to the vicinity of 4045.2 or 4169.6.
The StochRSI indicator on the 1M, 1W and 1D charts turned into a bearish sign, indicating downward pressure.
Therefore, it is necessary to check whether it is supported or resisted at the support and resistance points indicated on the respective time frame charts (1M, 1W, 1D charts).
In particular, since the 4116.0 point is a volume profile section drawn on the 1W chart, it is important whether it is supported in this area.
-------------------------------------------------- -----------
(NAS100USD chart)
The key is whether it can rise above the 12896.2-13418.8 section, which is the volume profile section of the 1W chart.
To do so, it is necessary to check whether it can be supported in the 13231.6-13480.9 section, which is the resistance section of the 1D chart.
As it fell during this volatility period, May 14th-16th, the HA-High indicator on the 1D chart is rising and is about to be created.
Therefore, it becomes important whether it can be supported around 13231.6.
The StochRSI indicator on the 1M chart is still in an uptrend.
So, we can see that the uptrend is still strong.
However, since the 13480.9 point is the HA-Low indicator point of the 1M chart, it is expected that it will be possible to buy from a long-term perspective only when it rises above this point.
If it doesn't and it declines, it's likely to renew the recent lows, so you should think about how to respond.
-------------------------------------------------- -------------------------------------------
** All descriptions are for reference only and do not guarantee profit or loss in investment.
** Even if you know other people's know-how, it takes a considerable period of time to make it your own.
** This is a chart created with my know-how.
---------------------------------

EURUSD in monthly timeframe hi friends this is my longterm idea about eurusd .
what do u think about my chart?

Flattening retail sales, declining inventories and real outputYesterday’s financial print in the United States indicated a 0.4% MoM and a 1.6% YoY rise in retail sales for April 2023. The data showed that industrial production increased by 0.5% MoM and 0.2% YoY during the same period. Business inventories shrank by 0.1% MoM, and manufacturing production jumped by 1% MoM (while showing a decline of 0.9% YoY). As this mix of data did not help to bring much clarity to the market, we would like to look at the bigger picture rather than at monthly changes in these metrics.
Retail sales have been trending relatively sideways since March 2022. Moreover, since around the same time, business inventories have continuously declined, suggesting that businesses are not stacking up goods for sale (and are likely anticipating lower demand in the future). The real output in the manufacturing sector dropped slightly lower in the past half year, and the real output in the nonfarm business sector has been declining for much longer (at least since 4Q21). Furthermore, based on the preliminary report from BLS, nonfarm business sector labor productivity decreased by 2.7% in the first quarter of 2023, while manufacturing sector labor productivity dropped by 1.3%.
These developments are not particularly bullish and should have investors on high alert. With that said, we continue to wait for more bad data (concerning rising unemployment, declining consumer spending, growing delinquencies on debt, etc.), which should finally start spooking the overly complacent market.
Illustration 1.01
Illustration 1.01 shows the chart of U.S. retail sales. This metric can be seen flattening since at least March 2022.
Illustration 1.02
Illustration 1.02 displays the business inventories.
Illustration 1.03
The picture above shows the real output in the nonfarm business sector.
Technical analysis gauge
Daily time frame = Neutral
Weekly time frame = Neutral
*The gauge does not necessarily indicate where the market will head. Instead, it reflects the constellation of RSI, MACD, Stochastic, DM+-, ADX, and moving averages.
Please feel free to express your ideas and thoughts in the comment section.
DISCLAIMER: This analysis is not intended to encourage any buying or selling of any particular securities. Furthermore, it should not be a basis for taking any trade action by an individual investor. Therefore, your own due diligence is highly advised before entering a trade.


Concentration of funds into the investment market is expectedHello?
Traders, welcome.
If you "Follow", you can always get new information quickly.
Please also click "Boost".
Have a good day.
-------------------------------------
(NAS100USD chart)
It is showing a rise above the 12896.2-13418.8 section, which is the volume profile section of the 1W chart.
Therefore, if it rises above 13418.8 or rises above the 13231.6-13480.9 section on the 1D chart and shows support, it is expected to show a sharp rise.
If not, you need to make sure it is supported around 12716.0-12896.2.
-------------------------------------------------
(SPX500USD chart)
You need to follow the rising channel to see if you can maintain the bullish trend.
Looking at the 1M chart, it shows an upward movement along the lower uptrend line.
As such, it is expected to remain in an uptrend as long as it does not fall below this uptrend line.
-----------------------------------------
(DXY chart)
If it shows sideways in the 98.244-101.494 section, the investment market is expected to be active.
Therefore, it is necessary to follow the downtrend and see if the downtrend can be maintained until around June 6th.
The investment market is not just the stock market.
Therefore, as funds are concentrated in any investment product, there is a possibility that it will lead to a sharp rise.
I think this concentration of funds is an abnormal phenomenon.
However, many funds are stagnant in an environment where it is difficult to invest in the actual economy, so if a concentration of funds occurs in these investment markets, it is expected that actual economic investment will eventually be gradually activated.
In that sense, we should pay attention to USDT's fund concentration phenomenon.
-------------------------------------------------- -------------------------------------------
** All descriptions are for reference only and do not guarantee profit or loss in investment.
** Even if you know other people's know-how, it takes a considerable period of time to make it your own.
** This is a chart created with my know-how.
---------------------------------

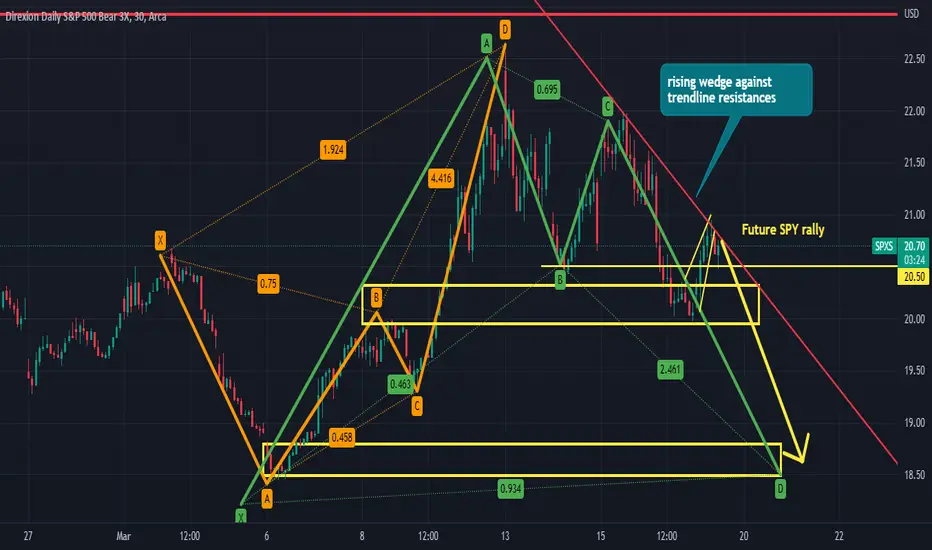
short the C leg of the bullish cypherthere is also a rising wedge into a trend line resistances. The B leg of the previous bearish cypher acted as inital bounce area, as a result I see a future spy rally set up into the close today. This can also push $spy for $400+ $4080 SPX
spx 900Good morning esteemed individuals, bag holders, and exit liquidity providers.
In my previous post, I dissected the Dow Jones and received a plethora of animosity for it -
thus, I have returned to impart additional truths upon the disgruntled boomer brethren, much to their chagrin.
---
Within Elliott Wave Theory, the third and fifth waves typically exhibit a notable bearish divergence,
as elegantly depicted in this 12-month chart.
Higher degree Wave 4s often retrace to the territory of the preceding degree's Wave 4.
To affirm the culmination of the 13-year movement spanning from 2009 to 2022, one may peruse my post below:
Note that, at the time, I was observing the market through a rather conservative lens,
failing to consider the myriad of appalling truths I have since unearthed regarding the system to which we all regrettably belong.
---
What lies ahead surpasses the darkest depths of our current imaginations.
You, the one in denial, shall bear the brunt of the impact.
--Brace for the worst,
and may fortune favor your 401k.


SPX Swing Trade, History repeating (CPI incoming)The chart is self-explanatory, I have highlighted in the chart where we saw remarkably similar price action in the past.
I have identified two different structures in the chart, a parallel channel, and a disjoint channel. We are currently trading in the disjoint channel. A disjoint channel has expanding edges which have same slopes locked in opposite directions.
We entered the Current Disjoint channel from a parallel channel trending upwards which is exactly what happened in the past, the only difference is size of these channels, in past we had larger Parallel and disjoint channel compared to what we have now.
The small size of channels this time indicates reduced volatility overall, which if it happens at the end of an uptrend, means we are topping out.
Let's make some predictions based on this.
If we look at the current price action, it is forming a bull flag (highlighted in the chart) , I have also highlighted the measured move of the flag. If the flag plays out its measured move intersects directly into the top of the disjoint channel as well as the August high. Which I believe should be the top or close to it.
In case bull flag fails , and we first drop a bit then we can look at that the blue line, it is placed for 10th May CPI Day and if we move up on that day, we are still intersecting close to the August High and top of the disjoint channel.
Apart from the above structures we also have a harmonic structure with its PRZ falling right onto Aug high.
If you like my content then please boost and share this post. I have over 6 years of trading and investing experience and have learned a lot in this time. I like to share what I have learned. If you would like to learn from my experience then follow me on trading view to get notified on my trade, market projections and several upcoming technical analysis and in-depth tutorials on technical Indicators. You can also leave a comment and let me know if you want me to look at any specific asset or want to learn about any specific topic in the world of Technical Analysis. I Will do my best to create a post for it.
Keep learning and Happy trading All.

SPY S&P 500 ETF Double TOP Chart Pattern | Options to BuyIf you haven`t bought those SPY puts here:
Then looking at the chart, it seems like SPY has formed one of the most bearish chart patterns: the Double Top!
Assuming that the CPI report will come higher than expected this week, I would buy the following SPY puts:
2023-5-19 expiration date
$405 strike price
$1.62 approx.. Premium to pay.
Looking forward to read your opinion about it!

S&P500 long term fib targets S&P retracement fibs!
Personally I'm eyeing up the 0.618 at around 3200 but who knows 🤷

Short signal on Es500 4h chartHello guys I wish you the best.
As we know there is nothing 💯 In trading but I think this idea might work.
Please leave comment for me and share with your friend, thanks.
Cheers 🥂.

spx500, updated [primary]good evening,,,
follow up to my last post on the nasdaq.
it is thanks to this particular picture, that the nasdaq count becomes possible.
---
the spx500 came down in 5 waves from all time high,
labeled wave (a).
from the 2022 lows, it begun retracing in what looks like a perfect 3 wave move.
there's a beautiful running flat in there which was very tricky to see.
---
i believe the spx500 is about to complete wave c of wave (b) into this summer.
once it does, i will give you a comprehensive update + some downside targets to look forward to.
✌
