US SPX 500

S&P500 SPXThis is what I see the market doing in SPX ... they will push it towards 3881.16 (blue line) or 3857.55 which is POI at where 194.70M Orders are waiting to be collected in order for it to sell at 3568.88 ( bottom green line) but thats only if the body does not close above 3901.46 (black line) but if it does close above, expect for the market to hit 4057.26 (top green line). Going back to my selling position at 3881.1 As you can see the consolidations from Sept. 16 to Nov. 7 looks like they're leaning towards a small push in order for the SPX to drop.

SPX long termHe is a bit cleared out chart for my long term view on the SPX.
I think (as was saying all year long), that we will revisit 2020 lows and ideally make a higher low at 2855SPX or if super weak low 2400 (less odds at this point) by Mar/Apr 2023.
If there is a H&S playing out and we will know soon enough, then the price should get down to 3k zone
My ideal target for this year low is at 3212SPX with min 3389SPX (which I think will be sliced/wont hold long if tested)
Maj support going into Nov 10-11th low is at 3610 to 3656 SPX, where 3610SPX is the maj support.
Below 3610SPX the price will test min 3543-56SPX is not all the way to re-test Oct 13th lows.
If in fact that happens, then the move down to 3389 and ideally 3212SPX will be very fast and will bottom on Nov 21-22nd.
Ideally we test 3389SPX level on Nov 21-22nd, rally up back to 3545-55SPX and ideally back to 3610-55SPX by EOM and make a final low in Dec either at 3212 or that mid 3k zone.
I do think 3k will be a very solid support and will hold this year.
This year is a pure bear market and so many still expecting a Santa Rally, I think we get Santa Crappy instead.
So after a good size rally (13-18%) from Dec lows to mid Jan high
Early next year it will be a perfect scenario where the price dives down to 2855 and low 24 handle to mark the bottom of the whole move down from Jan highs.
Then I think the price will start to move up with the money flow from the European countries and other countries to a safe heaven - the US stock market.
DOW will benefit the most imo, so I expect DOW to outperform, SPX to follow.
That high might be a double top sometime in 2026 and then another move down to 1550SPX zone by 2030-32
So if played right and give enough time to your trade, a lot of money can be made playing long term/swing this pathway
Have a good night, tomorrow will be interesting, expect a lot of volatility to hit the market going all the way till Christmas time


SPX can be in a much bigger H&S patternIf this H&S plays out/triggers we will see the price in 3k zone
For now there is a support box for the move lower.
Expect unexpected, as the price was tested so many times on the downside, it can break next time it does test it.
Also if this is a start of the wave 3 down, it will be fast and with min retracements, so be careful when trying catching the knife
Sar dots on daily are printing from the top 3rd day in a raw, 4h just joined the party
VIX and UVXY got very green already
Im swing short and my timing for the low is 21-22nd of Nov
Should move down into 10-11th low, then up into the 15-16th and final push to 21-22nd low

SPX500USD Will Go Down From Resistance! Short!
Hello,Friends!
In this market situation, I am looking at multiple indicators
And I can see bearish momentum accumulating on the pair right now
This sentiment makes me bearish biased and I am considering a short!
Like and subscribe and comment my ideas if you enjoy them!

Buying SPX on dips.US500 - Intraday - We look to Buy at 3785 (stop at 3770)
Broken out of the triangle formation to the upside.
The measured move target is 3898.
Intraday, and we are between bespoke support and resistance 3785-3835.
Preferred trade is to buy on dips.
Our profit targets will be 3835 and 3898
Resistance: 3835 / 3865 / 3898
Support: 3785 / 3700 / 3484
Risk Disclaimer
The trade ideas beyond this page are for informational purposes only and do not constitute investment advice or a solicitation to trade. This information is provided by Signal Centre, a third-party unaffiliated with OANDA, and is intended for general circulation only. OANDA does not guarantee the accuracy of this information and assumes no responsibilities for the information provided by the third party. The information does not take into account the specific investment objectives, financial situation, or particular needs of any particular person. You should take into account your specific investment objectives, financial situation, and particular needs before making a commitment to trade, including seeking advice from an independent financial adviser regarding the suitability of the investment, under a separate engagement, as you deem fit.
You accept that you assume all risks in independently viewing the contents and selecting a chosen strategy.
Where the research is distributed in Singapore to a person who is not an Accredited Investor, Expert Investor or an Institutional Investor, Oanda Asia Pacific Pte Ltd (“OAP“) accepts legal responsibility for the contents of the report to such persons only to the extent required by law. Singapore customers should contact OAP at 6579 8289 for matters arising from, or in connection with, the information/research distributed.

S&P500 SPXThis is what I see the market doing in SPX... they will push it towards 3881.16 (blue line) or 3857.55 which is POI at where 194.70M Orders are waiting to be collected in order for it to sell at 3568.88 ( bottom green line) but thats only if the body does not close above 3901.46 (black line) but if it does close above, expect for the market to hit 4057.26 (top green line). Going back to my selling position at 3881.1 As you can see the consolidations from Sept. 16 to Nov. 7 looks like they're leaning towards a small push in order for the SPX to drop.

S&P 500 SPXThis is what I see the market doing in SPX... they will push it towards 3881.16 (blue line) or 3857.55 which is POI at where 194.70M Orders are waiting to be collected in order for it to sell at 3568.88 ( bottom green line) but thats only if the body does not close above 3901.46 (black line) but if it does close above, expect for the market to hit 4057.26 (top green line). Going back to my selling position at 3881.1 As you can see the consolidations from Sept. 16 to Nov. 7 looks like they're leaning towards a small push in order for the SPX to drop.

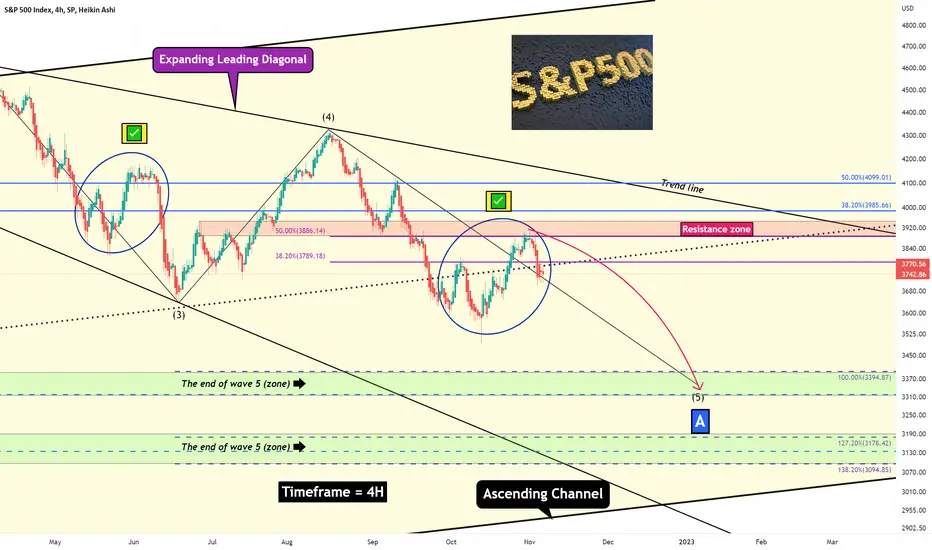
S&P500 Index Analyze (Similar movements, 11/07/2022)!!!⚖️We better start this post by reviewing the previous posts I published about the S&P500.
As you can see in the 2 weeks time frame, it seems that the S&P500 index has completed a complete cycle and is in the main corrective waves.👇
As I expected, the first major corrective wave A is forming an Expanding Leading Diagonal.👇
Currently, the S&P500 is moving in microwave 5 of the main wave A and seems to be able to create a movement similar to the one in microwave 3.
S&P500 Index Analyze Timeframe 4H (Log Scale)⏰.
Do not forget to put Stop loss for your positions (For every position you want to open).
Please follow your strategy, this is just my idea, and I will be glad to see your ideas in this post.
Please do not forget the ✅' like '✅ button 🙏😊 & Share it with your friends; thanks, and Trade safe.
SPX next week pathwayIm looking for an ABC move up tomorrow for a new high 3815-35SPX (if we wont take Fri lows)
Ideally we bottom in ES deeper then the cash price and cash will get its 50% retracement hit in am tomorrow, then we go up to close the Sunday opening gap
Then we should fall hard into 34 handle territory.
My timing is a low in Nov for the year and Jan high, then Mar/Apr maj low of this move.
Note this:
Fed is removing $40B by Nov 15, then aprox $20B/week through the EOY
So dont expect Santa being nice to the bullz...

SPX updated Fri chartFibs are on the chart, so far stopped at 50% retracement, I would expect 61.8 to get hit today, right into the resistance trendline (black line)
Yesterday's box was resistance, now its a support, use that if you want to go long (if we get a pullback today)
I was expecting this rally, but missed am entry, had one NQ running on the long side from yesterday and that was closed at the open spike.
I have also added back to my swing short MNQ (was closed those at 645 and 685 mentioned pre-market on that spike down), not doing anything else, as this can stretch up into the 7th and I dont want to increase my short position here.
You saw how they can do destroy both sides with am fckery, so have stops if you are in green, do not let your trade turn against you!
Again its Friday, DO NOT OVER TRADE! Dont give them back your weekly gains!

SPX - I got you all targets hit! Well we hit all the targets outlined on Oct 30-31st.
Now if we wont hold today's lows we will see mid 3600
- I have a box zone at 3665-75
- and 3641.50-50SPX as the next target zone, where 3641.50 is a Maj support on closing level!
- Supports on the way are
- 3718-20SPX
- 3689SPX
Resistance:
- 3791-3803
- 3907 is where the Maj resistance again
Also I want to present a possibility I was taking about on Oct 31st update of a bigger H&S where its working on the head at the moment.
I did some calculations and there is a chance we see 3552-89SPX on this leg down, that would be a perfect spot for the head to stop.
Can extend into 3500 zone as I expect the whole move to be retraced in full from Oct 13th lows (mentioned this many times)
Will post the H&S chart here in a bit

Selling SPX into rallies.US500 - 7h expiry - We look to Sell at 3807 (stop at 3847)
Trades at the lowest level in 8 days.
Broken out of the wedge to the downside.
The formation has a measured move target of 3629.
We are trading at oversold extremes.
Preferred trade is to sell into rallies.
3810 has been pivotal.
Yesterday's Marabuzo is located at 3807.
Our profit targets will be 3672 and 3629
Resistance: 3807 / 3810 / 3845
Support: 3672 / 3629 / 3600
Risk Disclaimer
The trade ideas beyond this page are for informational purposes only and do not constitute investment advice or a solicitation to trade. This information is provided by Signal Centre, a third-party unaffiliated with OANDA, and is intended for general circulation only. OANDA does not guarantee the accuracy of this information and assumes no responsibilities for the information provided by the third party. The information does not take into account the specific investment objectives, financial situation, or particular needs of any particular person. You should take into account your specific investment objectives, financial situation, and particular needs before making a commitment to trade, including seeking advice from an independent financial adviser regarding the suitability of the investment, under a separate engagement, as you deem fit.
You accept that you assume all risks in independently viewing the contents and selecting a chosen strategy.
Where the research is distributed in Singapore to a person who is not an Accredited Investor, Expert Investor or an Institutional Investor, Oanda Asia Pacific Pte Ltd (“OAP“) accepts legal responsibility for the contents of the report to such persons only to the extent required by law. Singapore customers should contact OAP at 6579 8289 for matters arising from, or in connection with, the information/research distributed.

SPX Weekend updateThis will be a quick update.
As long as we hold 3907-13SPX on closing level we should see lower going into Tuesday am, then up into 2nd/3rd high.
Another possibility is we bottom on the 2nd and reverse into the Midterms with higher levels to be seen, maybe even above 4-4.1k zone
I really have no good support till the support cluster zone at 3739-3750SPX
There are 2 supports on the way, look for 2 grey lines below the price.
Ideally we gap down tomorrow and wont look back till 3750-40 zone is tested then a rally back to 3918SPX before the Fed decision.
Im having a dilemma is we see a low or a high on the 2nd (pre-FED), ideally its a low and not the high, as I want to see a good push into Midterms with the high to be seen on week of Nov 7th.
Then I would expect a strong move down to at least re-test of Oct 13th lows + or -, if not 34 handle.
Its getting to a point where it can breakout, cant rule out that.
If we do, we should see 4-4.1k and no way higher then 4300.
Nov is a bearish month when going back to Mid-Term elections and since its a bear market, I expect Nov to be a red month with Oct being the high month.
Tomorrow am will be a telling story, so far futures are slightly down and we have a gap from Sunday open, futures gaps always get filled!
Will those be filled after a strong move down tomorrow into the 2nd or it might get filled before the open or in am at top.
Again all eyes on 3907-13SPX as a maj resistance going into tomorrow.
If the price closes strongly above that resistance tomorrow, I will get long into Nov 2nd high.
So far Im swing short and quite under the water from Fri close.
Its going to be a very volatile month, so dont get emotional thinking that you're missing the train and jump when tomorrow it all can dramatically change

SPX500 Also following the same Fate as Gold!SPX500 Also following the same Fate as Gold! Look out for the marked Support and Order blocks!

SPX still unclearI have no good feeling on either direction here.
Its all can be muted all the way till the 2nd decision
In idea it has to gap down and retrace into Fri am lows around 3808SPX or so
Ideally we test 374-50 support zone and then rally up for a higher or lower high, back testing 3907-13SPX level
Its all up to 3707-13SPX level on closing level, bull/bear line
Futures are up at this moment, so hard to make a call here, If we hold in am, I will do a long trade as it might get another squeeze into 4010-20SPX zone with 3960SPX as a smaller degree resistance on the way.
Im swing short and under the water, I do believe that November month will be negative and I have huge doubts of Santa Rally being present this year.
There is a chance we get a Santa Crappy into EOY instead:)
If I see something solid in am, I will post it right away, for now as long as we hold 3907-13SPX Im looking for lower levels to be seen.

SPX second target touchdown!3776SPX was my second target, lets see if we can get a home run into that "ideal target" box
Posted this on Oct 31st

SPX rememeber this chart?First support is broken, watching the ideal box target for a clue on whats next.
I will update you guys as fast as I can, love when the markets are moving, this is more fun
We should bottom by Fri am, so get ready to buy, ideally in mid 37 handle

SPX500 Wait For Breakout!!
SPX500 is trading in a rising wedge
But sp500 is stuck below
The horizontal resistance at 3870.76
And the bullish breakout has failed
So IF we see a bearish breakout
Of the rising wedge
Then I believe Will go down

SPX Monthly Forecast Movements 1-30 November 2022 SPX Monthly Forecast Movements 1-30 November 2022
We can see that for this month, the implied volatility is around 7.47%, decreasing from 7.49% of last month.
This is currently placing us in the 85th percentile according to ATR and 100th according to VIX
Based on this percentile calculation, on average the monthly movement for the candle(from open of the candle to the close of the candle) is:
BEARISH Candle : 6.23%
BULLISH Candle : 5.1%
With this in mind we can expect with a close to 15.7% probability that our close of the monthly candle is going to close either above or below the next channel:
BOT: 3610
TOP: 4200
Lastly, based on the calculations that we had for touching the previous candle high and low values, we can estimate that there is a :
80% chance that we are going to touch the previous monthly high of 3900(already happened yesterday)
25% chance that we are going to touch the previous monthly low of 3492

SPX on the closeDoesnt look like a bullish setup to me.
Want to see a good sell off tomorrow and big rally into Nov 7-8th high
The low might come on the 4th, then short lived rally
Im swing short and I have also bought QQQ 270P exp on the 4th (will be out from them in am tomorrow, if we get a gap down open)
We will see...

SPX rejected its resistance, ES got its gap filled from SunNothing much to add today, another rejection of the top.
As noted on Sunday, ES and NQ gaps (all futs gaps) always get filled, so it happened in am.
I did long from 3901 and exited at 3922ES just for the am dump to take my gains with stop losses.
I did few trades from 58 and 53 level, already exited
SPX price is below the opening range and cant re take it, putting pressure for lower to be seen.
I have a long order at 3814.50 and 3815ES, want that to hold and break only after the FED announcement fakeout.
It seems its going to put a pressure lower into Fri numbers and rally into 7-8th if not the CPI release on the 10th.
Then Im looking for much lower into week of 21st of Nov.
