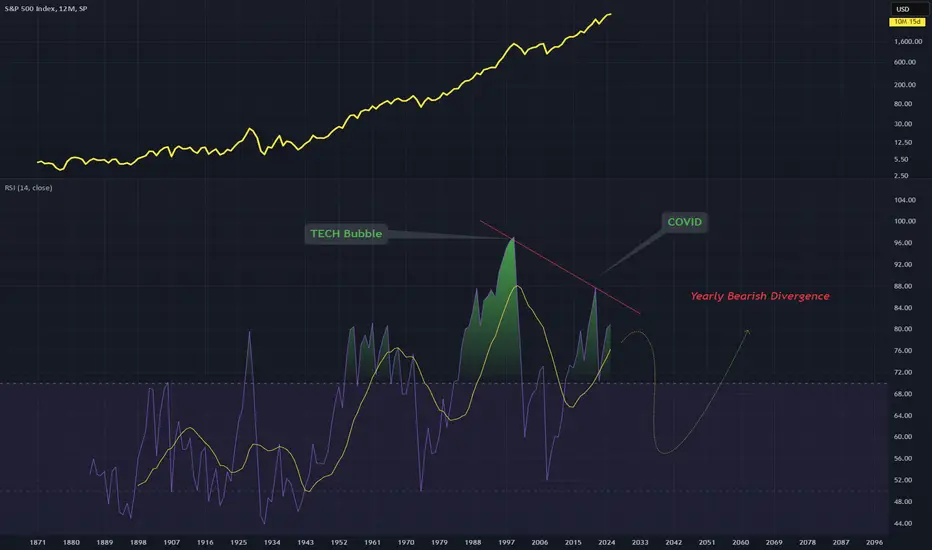
SPX RSI AnalysisThe Tech Bubble (2000) peak and the Peak during covid has formed a large bearish divergence on this yearly timeframe
this points to a potential trend shift on the yearly timeframe and another bear move
I'm bearish on stocks right now and bullish on crypto and rare metals
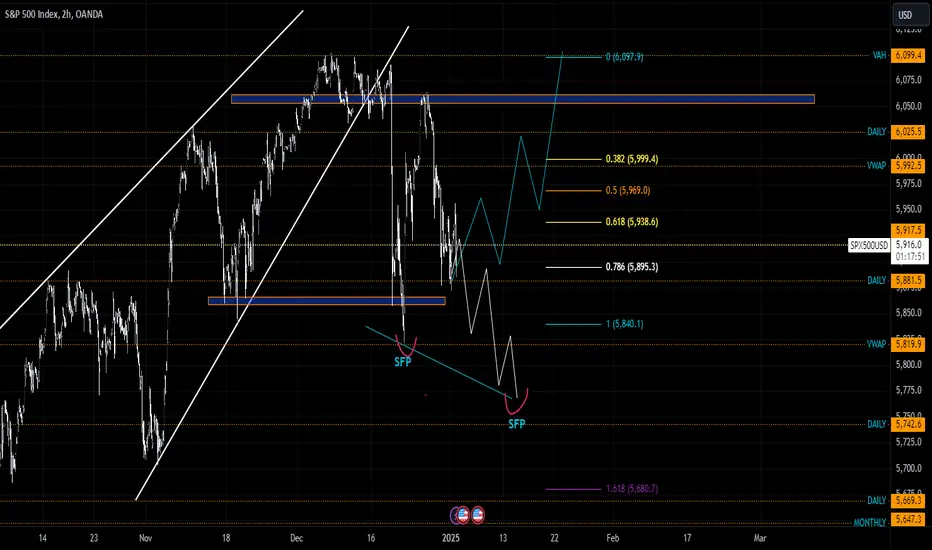
Additional post to my previous one which shows my downward move thoughts on the SPX
US SPX 500
SPX - Extreme Greed SPX value has extended too far from its common trend line that extends a LONG time back
We are in a hyper bubble and don't even know it
I have been bearish on SPX for awhile now and am just waiting for the collapse
Period of extreme greed
Respect the Trend Line
3 Monthly chart

SPX 500 Returns to All-Time HighsDuring the last session, the SPX 500 index gained more than 1.2% following the release of PPI data in the United States. The core PPI (m/m) remained in line with expectations at 0.3% , providing a slight relief to the market, which had been on the edge after annual CPI inflation came in at 3.0%, exceeding the 2.9% forecast.
This mixed inflation data has given the U.S. index an opportunity to recover, as it remains uncertain whether the Federal Reserve will continue its aggressive interest rate policy. Persistently high rates have been impacting domestic consumption in the U.S. for several months, and if the central bank maintains rates at 4.5% in upcoming decisions, it could eventually become a bearish factor for the SPX 500.
Momentum Builds
In recent weeks, the SPX 500 had been trading within a sideways range, with a ceiling at 6,080 points and a floor at 5,840 points. However, the growing buying momentum has now pushed the index back toward all-time highs. If bullish pressure remains strong through the end of the week, a breakout from this range could pave the way for a more significant upward movement.
MACD Indicator
Both the signal line and the MACD line remain above the neutral level at 0 , adopting a steady upward slope.
The histogram has begun to oscillate slightly above the zero level.
If these conditions persist over the next sessions, bullish momentum could continue in the short term.
Key Levels to Watch:
6,082 points – The most critical resistance level at the moment, corresponding to the previous all-time high. Sustained price action above this level could reinforce the current bullish bias, opening the door to a stronger uptrend.
5,960 points – Nearby support, aligning with the mid-range of the consolidation phase and coinciding with the Ichimoku cloud and the 50- and 100-period moving averages. If price action falls back below this level, it could strengthen selling pressure and delay the possibility of new highs in the short term.
5,840 points – Distant support level, where a pullback to this zone could put the long-term uptrend at risk.
By Julian Pineda, CFA – Market Analyst

S&P consolidation continuesThe S&P (US500) index price action sentiment appears bullish, supported by the longer-term prevailing uptrend. However, since reaching an all-time high on Friday 24th Jan the S&P index price action is consolidating in a sideways trading range.
The key trading level is at 6012, which is the current swing low. A corrective pullback from the current levels and a bullish bounce back from the 6012 level could target the upside resistance at 6080 followed by the 6117 and 6130 levels over the longer timeframe.
Alternatively, a confirmed loss of 6012 support and a daily close below that level would negate the bullish outlook targeting a further retracement and a retest of 5964 support level followed by 5925.
This communication is for informational purposes only and should not be viewed as any form of recommendation as to a particular course of action or as investment advice. It is not intended as an offer or solicitation for the purchase or sale of any financial instrument or as an official confirmation of any transaction. Opinions, estimates and assumptions expressed herein are made as of the date of this communication and are subject to change without notice. This communication has been prepared based upon information, including market prices, data and other information, believed to be reliable; however, Trade Nation does not warrant its completeness or accuracy. All market prices and market data contained in or attached to this communication are indicative and subject to change without notice.

The S&P sell before the NFPWe are expecting a drop in the S&P later tonight based on what the charts are telling us.
1) The high of S&P is at 6118 and 6130.
2) There is a pattern to sell at the current level of 6080.
3) Yesterday's high to resist the trade.
4) H1 divergence present as well
The optimistic target is 5930 (1:3 risk to reward). We will monitor and post updates here as the trade moves.

XAUUSD WEEKLY WRAP UP
This week, Gold (XAU/USD) continued its upward trajectory, achieving a sixth consecutive weekly gain. The metal reached a new record high above $2,880, reflecting sustained bullish momentum.
Key Influencing Factors:
Federal Reserve Commentary: Remarks from Federal Reserve Chair Jerome Powell contributed to market optimism, supporting the rally in gold prices.
Technical Levels: Gold approached the significant psychological level of $3,000 per ounce, with analysts suggesting that surpassing this threshold could be a potential game-changer for the metal.
Outlook:
The market's focus is now on upcoming U.S. economic data, particularly the Consumer Price Index (CPI), which could serve as a catalyst for further price movements. A higher-than-expected CPI reading may bolster expectations of a more hawkish Federal Reserve, potentially exerting downward pressure on gold. Conversely, a softer CPI could support continued gains in gold prices.
Traders are advised to monitor these developments closely, as they will play a crucial role in shaping gold's trajectory in the near term.
FOLLOW US BOOST US FOR MORE MARKET RELATED NEWS ANALYSIS AND UPDATES

Breaking: Alphabet ($GOOG) Shares Drop 7% in PremarketAlphabet Inc. (NASDAQ: NASDAQ:GOOG ) witnessed a significant 7% drop in premarket trading on Wednesday, driven by investor concerns over slowing cloud growth and the tech giant’s hefty $75 billion investment into artificial intelligence (AI) infrastructure. This figure far exceeded Wall Street’s projected $58 billion, raising doubts about the necessity and efficiency of such high spending.
AI Investment and Competitive Pressure
Alphabet has been aggressively investing in AI research and its integration across Google Search, Cloud services, and other platforms. However, the emergence of China’s low-cost DeepSeek AI model—which reportedly rivals leading U.S. AI models—has triggered discussions about whether Big Tech companies need to allocate billions toward AI advancements.
Cloud Growth Concerns
Alphabet's cloud division reported a 30% revenue increase to $11.96 billion in Q4, but this marked a slowdown compared to the 35% growth in Q3. In contrast, Microsoft Azure saw a 31% increase, while Amazon Web Services (AMZN) is projected to post only a 19% rise. Despite the slowdown, analysts believe the surging demand for AI-powered cloud computing will keep the long-term outlook positive for Alphabet’s cloud business.
Advertising Challenges
Beyond AI and cloud investments, Alphabet is grappling with fierce competition in the digital advertising space. With marketers increasingly shifting to social media-driven ad platforms like Meta’s Facebook and Instagram, and ByteDance’s TikTok, Google’s traditional ad model faces mounting pressure.
Technical Analysis
At the time of writing, NASDAQ:GOOG shares are down 6.75%, signaling a potential bearish continuation pattern. The stock appears poised to form a gap-down pattern, a bearish technical indicator that may lead to further downside pressure.
- Support Levels:* The first minor support lies at $197, aligning with the 78.6% Fibonacci retracement level. A breakdown below this level could result in gap-filling towards $185-$190.
- Major Structural Support: The BOS (Break of Structure) level is set at $155. A dip to this level could trigger further bearish sentiment and result in deeper losses.
- Moving Averages: Despite the premarket decline, NASDAQ:GOOG remains above key moving averages, suggesting that the broader trend remains bullish unless further downside momentum builds.
- RSI Positioning: Prior to this drop, the Relative Strength Index (RSI) was at 64, indicating that the stock was not overbought. This means the decline is not necessarily a reaction to overvaluation but rather a response to external market forces and investor sentiment.
Market Sentiment and Analyst Outlook
While some brokerage firms have cut their price targets on Alphabet, the median price target now stands at $220—still above its current premarket trading price of $191.20. Alphabet’s stock had gained 9% in 2024 before this drop, outperforming Amazon’s 10.3% gain and Microsoft’s -2.2% decline.
Conclusion
Despite the current dip, Alphabet’s long-term prospects in AI and cloud computing remain strong. The significant AI investment could prove to be a long-term advantage if it strengthens Alphabet’s competitive positioning. However, traders should closely monitor key support levels ($197 and $155) and whether the stock can hold above key moving averages.
For long-term investors, the recent drop could present a buying opportunity, but in the short term, further downside volatility is possible as market sentiment adjusts to Alphabet’s spending strategy. The coming days will be crucial in determining whether NASDAQ:GOOG can recover swiftly or continue its downward trajectory.

SPX to find sellers at market price?SPX500USD - 24h expiry
Price action looks to be forming a top.
A Doji style candle has been posted from the high.
This is negative for short term sentiment and we look to set shorts at good risk/reward levels for a further correction lower.
Further downside is expected although we prefer to sell into rallies close to the 6058 level.
Although the anticipated move lower is corrective, it does offer ample risk/reward today.
We look to Sell at 6058 (stop at 6099)
Our profit targets will be 5942 and 5920
Resistance: 6102 / 6190 / 6235
Support: 6030 / 5980 / 5940
Risk Disclaimer
The trade ideas beyond this page are for informational purposes only and do not constitute investment advice or a solicitation to trade. This information is provided by Signal Centre, a third-party unaffiliated with OANDA, and is intended for general circulation only. OANDA does not guarantee the accuracy of this information and assumes no responsibilities for the information provided by the third party. The information does not take into account the specific investment objectives, financial situation, or particular needs of any particular person. You should take into account your specific investment objectives, financial situation, and particular needs before making a commitment to trade, including seeking advice from an independent financial adviser regarding the suitability of the investment, under a separate engagement, as you deem fit.
You accept that you assume all risks in independently viewing the contents and selecting a chosen strategy.
Where the research is distributed in Singapore to a person who is not an Accredited Investor, Expert Investor or an Institutional Investor, Oanda Asia Pacific Pte Ltd (“OAP“) accepts legal responsibility for the contents of the report to such persons only to the extent required by law. Singapore customers should contact OAP at 6579 8289 for matters arising from, or in connection with, the information/research distributed.

DXY on high time frame
"Regarding DXY, the price has reached the (FVG) on the monthly chart and is displaying signs of rejection. On the daily timeframe, candle formations indicate bearish momentum."
If you have any specific questions or if there are particular aspects you would like me to focus on, feel free to let me know!

Why Blind Index Investing Could Be Costing You Thousands?!Index-based investing has been one of the most popular ways to grow a long-term portfolio for decades. Today, it has become even more accessible and favored, offering a safer foundation for investing and generally carrying lower risk compared to portfolios composed of individual stocks. For someone like me, a technical analyst, index investing isn't exactly an adrenaline rush. Under societal pressure, I decided to test a few hacks and dive deeper into it ;)
I set out to compare three of the most popular U.S. index ETFs – SPY (S&P 500), QQQ (Nasdaq 100), and IWM (Russell 2000) – and analyze how to implement a brief technical analysis into index selection could influence long-term results. Starting in 2005, I "invested" $1,000 every quarter, completing a total of 81 test purchases. Each time, I selected the index that technical analysis suggested was in the strongest position.
If done strictly and consistently, there were often situations where all three indices had just reached their all-time highs. In those moments, I had to make a choice. Technical analysis is not just about drawing lines on a chart – experience, market intuition, and behavioral patterns of the price play a big role here.
My Test and Strategy
The goal was to compare the following three U.S. index ETFs:
- SPY (S&P 500)
- QQQ (Nasdaq 100)
- IWM (Russell 2000)
Test conditions:
- Start date: 2005
- Investment period: 81 quarters
- Mandatory quarterly investment: $1,000
- Index selection: Based on technical analysis and market intuition.
Distribution of trades during the test period:
- SPY: 35 times
- QQQ: 31 times
- IWM: 15 times
The chart illustrates SPY, QQQ, and Russell with blue arrows marking purchase points.
Results of the Experiment
Performance of my strategy:
- +344% return
- Invested: $81,000
- Final value: $360,000
Comparison indices (each quarter regular purchases):
- SPY: +233% (final value: $272,000)
- QQQ: +579% (final value: $552,000)
- IWM: +128% (final value: $186,000)
My strategy outperformed SPY and IWM because I focused on selecting the ETFs in the strongest technical condition at the time. While QQQ delivered higher absolute returns, my diversified approach offered competitive returns with lower risk and more stable outcomes.
Key Takeaways
1. Diversity and Stability: Risk Mitigation and Return Optimization
The goal wasn't just maximum returns but also reducing risk and adopting a smarter approach. While QQQ had the highest returns, remember that it is heavily concentrated in the technology sector, making it riskier. Back in 2005, it wouldn't have been easy to predict that QQQ would outperform. A technical analysis strategy allows for risk diversification by choosing the strongest index at any given time, delivering significant returns while maintaining diversity and stability.
2. Thoughtful Regularity Outperforms Blind Regularity
Strict quarterly investing avoids the biggest mistake investors fear – timing the market. Regularity is crucial, but it needs to be thoughtful. The tests showed that blind purchasing could be costly: for instance, regular SPY purchases would have left $100,000 on the table, and IWM even more. My strategy allowed selecting the strongest index at each point, yielding significantly better returns.
3. Wrong Index Choice Can Be Costly
Had I chosen only IWM throughout the period, my return would have been just +128%. This clearly shows the importance of not sticking to one index but instead evaluating regularly to find the one with the greatest potential at any given time.
How to Choose the Best Index: Follow my Newsletter to Guide You
One of many of the topics of this newsletter (You will find it here, in the profile section, visiting my "website") will be sharing my monthly and quarterly top lists of indices, making regular purchases easier for you. The test proved that sticking to one index isn’t the best way forward – but which one should you choose? That’s where the monthly top list comes in.
I firmly believe this strategy and approach have significant potential to help investors make smarter and more confident decisions. That’s why I’m starting a newsletter, where one of the many topics will be sharing this list regularly:
- The technically strongest indices for investing.
- Explanations of why a particular index is technically more attractive than others.
Conclusion
My research proves that technical analysis and understanding of charts can be powerful tools for long-term index investing. Regularity, fact-based decisions, and risk diversification help achieve optimal results.
Your portfolio deserves better decisions. Don’t waste time analyzing indices yourself.
All the best,
Vaido

SPX500 to find a top?US500 - 24h expiry
Price action continues to trade around the all-time highs.
Previous resistance located at 6102.
A 5 wave bullish count has been completed at 6107.
There is scope for mild buying at the open but gains should be limited.
Further downside is expected and we prefer to set shorts in early trade.
We look to Sell at 6102 (stop at 6147)
Our profit targets will be 6003 and 5955
Resistance: 6102 / 6107 / 6179
Support: 6003 / 5955 / 5886
Risk Disclaimer
The trade ideas beyond this page are for informational purposes only and do not constitute investment advice or a solicitation to trade. This information is provided by Signal Centre, a third-party unaffiliated with OANDA, and is intended for general circulation only. OANDA does not guarantee the accuracy of this information and assumes no responsibilities for the information provided by the third party. The information does not take into account the specific investment objectives, financial situation, or particular needs of any particular person. You should take into account your specific investment objectives, financial situation, and particular needs before making a commitment to trade, including seeking advice from an independent financial adviser regarding the suitability of the investment, under a separate engagement, as you deem fit.
You accept that you assume all risks in independently viewing the contents and selecting a chosen strategy.
Where the research is distributed in Singapore to a person who is not an Accredited Investor, Expert Investor or an Institutional Investor, Oanda Asia Pacific Pte Ltd (“OAP“) accepts legal responsibility for the contents of the report to such persons only to the extent required by law. Singapore customers should contact OAP at 6579 8289 for matters arising from, or in connection with, the information/research distributed.

SPX500 Bullish Bias!
HI,Traders !
SPX500 is trading in an
Uptrend and the Indice has
Formed a bullish flag
Pattern so as the Indice
Is breaking out we
Are bullish biased
And we will be expecting
A further move up!
Comment and subscribe to help us grow!

Nike is reaching trough lands soon ! Or not & W crash more !61% Retracement from all time low "IPO" to "ATH" is in the 60ish region. MKTS permitting & unless we are about to crash just like 1929 as some Elliottsions suggest then we are about to have a trough in Q1/Q2 of 2025 .!

S&P Scenario 2.1.2025In this market, in order to consider some long setups, we need to hold the 6060 level or something around it, and since we didn't hold this support, we had a way to go short after the breakout. Now I see a scenario like this: the market should come for the sfp below the low as shown, or it will start to rise directly into the long, but as long as we are below the 6060 level, I'm considering a long setup. I would take that if the sfp below the low was met.
SPX500USD: Intraday DowntrendMarket Overview
The SPX500USD index is currently trading within a moderate downtrend with a Trend Score of -40, as identified by BreadWinners INDI v2. The price is hovering near the Point of Control (POC) at 5,889, showing significant selling pressure. Short-term indicators suggest bearish momentum, but long-term moving averages hint at potential support near 5,800, which could lead to a reversal.
The SPX500USD is currently in a moderate downtrend , with selling pressure dominating near resistance levels. Support zones between 5,827 and 5,752 remain critical for potential bullish defense. Traders should monitor these key levels closely, using the suggested entry and stop-loss levels for disciplined trading.
Patience and risk management are key in this volatile environment.
Resistance Levels:
Primary Resistance: 5,889 (Point of Control).
Secondary Resistance: 5,922.84 (BreadWinners Stop Loss level).
Support Levels:
Primary Support: 5,827 (BreadWinners Entry Price).
Secondary Support: 5,752 (Lower Point of Control).
Oscillators
The oscillators indicate a mixed sentiment, with most leaning neutral and some showing divergence in momentum.
Relative Strength Index (14): 39.65 (Neutral)
Stochastic %K (14, 3, 3): 26.98 (Neutral)
Momentum (10): -132.47 (Buy)
MACD Level (12, 26): -35.46 (Sell)
Stochastic RSI (Fast): 19.95 (Buy)
Williams %R (14): -71.91 (Neutral)
The Momentum and Stochastic RSI indicate potential for a short-term recovery, while the MACD remains bearish.
Moving Averages
Short-term moving averages continue to signal a sell, reinforcing bearish momentum, but long-term moving averages suggest support levels could hold.
Exponential Moving Average (10, 20, 30): Sell
Simple Moving Average (10, 20, 30): Sell
Exponential Moving Average (200): Buy
Simple Moving Average (200): Buy
Hull Moving Average (9): Buy
Trade Strategy
Bearish Setup (Short Positions):
Entry Zone: 5,889–5,900 (Primary POC and resistance zone).
Stop Loss: Above 5,922.84.
Target 1: 5,827 (Primary Support).
Target 2: 5,752 (Secondary Support and Lower POC).
Bullish Setup (Long Positions):
Entry Zone: 5,827–5,752 (Key support levels).
Stop Loss: Below 5,740.
Target 1: 5,889 (POC and resistance retest).
Target 2: 5,922 (Short-term breakout level).

SPX500 Will Keep Falling!HI,Traders !
SPX500 broke the key
Horizontal level of 5825.23
While trading in a downtrend
So we are bearish biased and
We will be expecting a further
Bearish move down !
Comment and subscribe to help us grow!

"US500 / SPX500" Indices Market Bullish Heist Plan🌟Hi! Hola! Ola! Bonjour! Hallo!🌟
Dear Money Makers & Robbers, 🤑 💰
Based on 🔥Thief Trading style technical and fundamental analysis🔥, here is our master plan to heist the "US500 / SPX500" Indices market. Please adhere to the strategy I've outlined in the chart, which emphasizes long entry. Our aim is the high-risk Red Zone. Risky level, overbought market, consolidation, trend reversal, trap at the level where traders and bearish robbers are stronger. Be wealthy and safe trade.💪🏆🎉
Entry 📈 : You can enter a Bull trade after the breakout of MA level 5960 (OR) Entry in Pullback 5820
Stop Loss 🛑: Using the 2H period, the recent / nearest low or high level.
Goal 🎯: 6100 (or) escape Before the Target
Scalpers, take note 👀 : only scalp on the Long side. If you have a lot of money, you can go straight away; if not, you can join swing traders and carry out the robbery plan. Use trailing SL to safeguard your money 💰.
Warning⚠️ : Our heist strategy is incompatible with Fundamental Analysis news 📰 🗞️. We'll wreck our plan by smashing the Stop Loss 🚫🚏. Avoid entering the market right after the news release.
Fundamental Outlook 📰🗞️
Based on the fundamental analysis, I would conclude that the US500 / SPX500 is : Bullish
Reasons:
US economic growth: The US economy is expected to grow at a rate of 2.5% in 2023, driven by a strong labor market, increasing business investment, and a rebound in the housing market.
Monetary policy support: The Federal Reserve has kept interest rates at a low level of 1.5%, which is expected to support borrowing and spending in the economy.
Fiscal policy support: The US government has announced a series of fiscal stimulus measures, including tax cuts and infrastructure spending, which are expected to support economic growth.
Corporate earnings growth: US companies are expected to report increasing earnings in 2023, driven by a strong global economy and a competitive dollar.
Valuation: The US500 / SPX500 is currently trading at a relatively high valuation, with a price-to-earnings ratio of 20, but this is still below its historical average.
However, it's essential to consider the following risks:
Global economic slowdown: A slowdown in global economic growth could reduce demand for US stocks and drive down the index.
Trade tensions: Escalating trade tensions between the US and other countries, particularly China, could impact the US trade balance and economic growth.
Inflation concerns: Rising inflation could lead to higher interest rates, which could negatively impact the economy and the stock market.
Key Fundamental Indicators:
US GDP growth: 2.5% (2023 estimate)
Unemployment rate: 3.5% (2023 estimate)
Inflation rate: 2.0% (2023 estimate)
Interest rates: 1.5% (2023 estimate)
Corporate earnings growth: 10.0% (2023 estimate)
Market Sentiment:
Bullish sentiment: 75%
Bearish sentiment: 25%
Neutral sentiment: 0%
Please note that this is a general analysis and not personalized investment advice. It's essential to consider your own risk tolerance and market analysis before making any investment decisions.
Take advantage of the target and get away 🎯 Swing Traders Please reserve the half amount of money and watch for the next dynamic level or order block breakout. Once it is resolved, we can go on to the next new target in our heist plan.
Keep in mind that these factors can change rapidly, and it's essential to stay up-to-date with market developments and adjust your analysis accordingly.
💖Supporting our robbery plan will enable us to effortlessly make and steal money 💰💵 Tell your friends, Colleagues and family to follow, like, and share. Boost the strength of our robbery team. Every day in this market make money with ease by using the Thief Trading Style.🏆💪🤝❤️🎉🚀
I'll see you soon with another heist plan, so stay tuned 🫂


SPX500USD (6H/4H): HIGH-RISK DOWNTRENDThe SPX500USD on the 4-hour/6-hour timeframe is exhibiting significant bearish momentum, consistent with a short- to medium-term downtrend.
However, longer-term indicators suggest that the index is approaching critical support levels that could provide a platform for a potential rebound. The SPX500USD remains in a short-term downtrend, presenting opportunities for bearish trades near resistance levels.
However, long-term indicators suggest that the index is approaching a critical support zone that could provide a platform for a rebound.
***Traders should watch for confirmation of price action and volume at the 5,800–5,860 level before committing to long positions.
OSCILLATORS
The oscillators highlight a bearish sentiment with increasing selling pressure but suggest that the market is nearing oversold conditions, potentially setting up for a relief bounce.
Relative Strength Index (RSI): 38.11 – Neutral, approaching oversold territory.
Stochastic %K: 24.77 – Neutral, near oversold conditions.
Commodity Channel Index (CCI): -102.47 – Neutral, signaling mild bearish momentum.
Momentum (10): -75.92 – Sell, confirming bearish pressure.
MACD: -29.63 – Sell, reflecting declining momentum and no imminent reversal signals.
Williams Percent Range: -77.32 – Neutral, nearing oversold territory.
MOVING AVERAGES
Short-term moving averages confirm bearish momentum, while long-term averages signal potential support and a possible reversal point.
Short-Term MAs (10, 20, 30, 50): All indicate “Sell” signals, confirming strong bearish momentum in the short to medium term.
Long-Term MAs (200 EMA and SMA): Indicate “Buy” signals, reflecting the underlying bullish trend over the longer timeframe.
Ichimoku Base Line: Neutral at 5,962.44.
Volume Weighted Moving Average (VWMA): 5,959.81 – Sell, reinforcing short-term bearish sentiment.
Hull Moving Average (HMA): 5,862.93 – Buy, indicating potential support near current price levels.
SUPPORT & RESISTANCE LEVELS
Immediate Resistance: 5,960–6,000 (aligned with short-term moving averages).
Major Resistance: 6,100–6,160 (upper pivot zones and psychological barrier).
Key Support: 5,860–5,800 (aligned with Hull Moving Average and 200 EMA/SMA).
Critical Support: 5,760 and 5,658 (historical pivot lows).
PRICE ACTION
The index has recently tested its resistance levels near 5,960 but failed to break through, reinforcing the bearish sentiment.
Strong selling pressure is evident in the price action, with lower highs and lower lows dominating the 4-hour chart.
However, significant support is observed around 5,800, where the 200 EMA and SMA converge, offering potential for a bullish rebound if the level holds.
BEARISH SETUP (Short Positions)
Entry Zone: 5,960–6,000 (resistance levels and short-term MAs).
Stop-Loss: Above 6,010 (next major resistance).
Target: 5,860–5,800 (first support zone), and extend to 5,760 if bearish momentum persists.
BULLISH SETUP (Long Positions)
Entry Zone: 5,800–5,860 (key support area, aligned with 200 EMA/SMA).
Stop-Loss: Below 5,780 (critical support break).
Target: 5,960–6,000 (resistance levels), and extend to 6,100 if the rebound is strong.
MARKET SENTIMENT
Short-Term: Bearish – Downtrend persists, with strong resistance at 5,960 and 6,000.
Medium-Term: Neutral – Oversold conditions may trigger a relief rally.
Long-Term: Bullish – The 200 EMA and SMA indicate potential for a long-term uptrend if key support levels hold.

THE Scariest Trend Line you will ever have to see/consider !!!This upper line of resistance is where its all breakdown or break out !!!

S&P500 ES ready to enter the buy zone based on my new indicatorTL:DR I created a new price + volume based indicator that sold BEFORE the most recent crash, and bought BEFORE the most recent rise. If this indicator is any indication of the near future, then it's showing a near future rise in S&P500 since there is an active BUY signal. Below is a more detailed description of the indicator I created which is typically based on simple price and volume action.
I designed a new indicator that I dub the "Money Flow by NHBprod" indicator. It helps to EASILY identify potential trade opportunities without over complicating the process. In short, MFI typically uses volume and pricing data in its calculations which are 2 important keys to consider when trading. However, the actual indicator typically lags behind actual trade opportunities. I heavily modified the standard MFI so that this new indicator can be used to easily see where to buy and where to sell. It also has built in alerts which can be used to automate trading.
How It Works
The indicator calculates the Money Flow Index (MFI), but is heavily modified both in terms of calculations, performance, and output. The indicator computes the MFI using the closing price and a user-defined length. A linear regression moving average is applied to the MFI, smoothing out fluctuations to provide clear signals. Then we have Buy & Sell Zones which are Customizable thresholds that are used to determine when to buy and when to sell. When the moving average crosses into the buy zone, green highlights appear on the chart; similarly, red highlights appear when it enters the sell zone.
Alerts: Integrated alert conditions notify traders when the moving average enters either zone, ensuring they never miss a trade opportunity.
Simplifies Analysis: By focusing on the MFI's moving average and clearly marking significant zones, the indicator eliminates noise and simplifies market analysis.
Enhanced Visualization: The green and red highlighted zones on the pricing chart offer an intuitive, at-a-glance understanding of market conditions.

Potential bullish rise?S&P500 has reacted off the resistance level which is an overlap resistance and could rise from this level to our take profit.
Entry: 5,995.10
Why we like it:
There is an overlap resistance level.
Stop loss: 5,936.66
Why we like it:
There is an overlap support level.
Take profit: 6,110.04
Why we like it:
There is a pullback resistance level that lies up with the 100% Fibonacci projection.
Enjoying your TradingView experience? Review us!
Please be advised that the information presented on TradingView is provided to Vantage (‘Vantage Global Limited’, ‘we’) by a third-party provider (‘Everest Fortune Group’). Please be reminded that you are solely responsible for the trading decisions on your account. There is a very high degree of risk involved in trading. Any information and/or content is intended entirely for research, educational and informational purposes only and does not constitute investment or consultation advice or investment strategy. The information is not tailored to the investment needs of any specific person and therefore does not involve a consideration of any of the investment objectives, financial situation or needs of any viewer that may receive it. Kindly also note that past performance is not a reliable indicator of future results. Actual results may differ materially from those anticipated in forward-looking or past performance statements. We assume no liability as to the accuracy or completeness of any of the information and/or content provided herein and the Company cannot be held responsible for any omission, mistake nor for any loss or damage including without limitation to any loss of profit which may arise from reliance on any information supplied by Everest Fortune Group.

S&P 500 Potentially BullishFOREXCOM:SPX500 has been in a bullish direction. We have seen it make new highs and right now it is coming for a retest on the previously broken high. I will wait for a retest and see some price action at the 5,875.2 area before going long.
Until then, fingers crossed.
Past results does not guarantee future results, please do your due diligence
Like and follow for more
