SPX500 Will Go Down!SPX500 is going down
Now after the bearish
Breakout of the rising support
So after a potential local
Pullback we will be
Expecting a further move down
US SPX 500

SPX500USD Will Grow! Long!
Please, check our technical outlook for SPX500USD.
Time Frame: 6h
Current Trend: Bullish
Sentiment: Oversold (based on 7-period RSI)
Forecast: Bullish
The market is on a crucial zone of demand 5,849.9.
The oversold market condition in a combination with key structure gives us a relatively strong bullish signal with goal 5,898.0 level.
P.S
The term oversold refers to a condition where an asset has traded lower in price and has the potential for a price bounce.
Overbought refers to market scenarios where the instrument is traded considerably higher than its fair value. Overvaluation is caused by market sentiments when there is positive news.
Like and subscribe and comment my ideas if you enjoy them!

SPX Grand Super Cycle- Possible Target $ 6000 to 7000There is no denial for a short-term pullback in the market, which will be healthy for the market.
Also lots of speculation/leverage in the current market
So the market maker may shake out the weak hands soon.
If we see SPX in the quarterly chart Wave 1 started in 1976 and ended in 2000 which was around 26 years.
Wave 2 was from 2001 to 2009. Total nine years for wave two corrections.
Wave 3 started in 2009 and correction in 2020 March was quick just two months correction (Most probable it should not be wave 4 correction). This can be a nest (each wave is built of smaller waves and, at the same time, each wave is a part of a bigger wave) and wave II of a second nest.
In my opinion, there would be two probable scenarios, the first one is SPX is still in wave three and it will go to 6000/7000 in this decades.
As if we go with SPX Grand Super Cycle then- possible targets can be 4700 to 5000 or more before a major crash (Wave 4 correction multi-years) happen and after the wave 4 correction wave 5 targets can be 6000 to 7000 or more
The second one is to complete wave 5 around 4600 to 5300 and 60-80 % crash to 1500 - 2000
So just remember a sharp correction/crash wouldn’t be the end of the world, it will be an opportunity to invest for the long term
Trend-based fib extension support the first scenario.
This is just my view please share your views in the comment section.
Thank you
Disclaimer
This idea does not constitute financial advice. It is for educational purposes only,

SP500 Secondary Trend. Bowl + handle. Resistance zone. 11 2023Logarithm. Large timeframe 1 week. On the chart a big bowl, you can say already with a handle, the price is testing the resistance of the previous market highs for the 3rd time (entering this zone). Breaking through it, this resistance will become a very strong support during the pumping (probability no more).
Simplifying the complex is the key to success.
Complicating the simple is a guarantee for your own confusion and mistakes on the plain.
It is based on knowledge and experience, which always leads to simplification of actions, not to complication !!!!
The SP500 index (500 companies of the global hegemon) is a reflection of the "health of the US economy" and, conventionally speaking, of all markets in the world. It is needed more as an indicator of the direction of other markets, including cryptocurrency (the market is maturing), than for trading as such.
The SP500 index (500 companies of the global hegemon) is a reflection of the "health of the US economy" and, conventionally speaking, of all markets in the world. It is needed more as an indicator of the direction of other markets, including cryptocurrency (the market is maturing), than for trading as such.
1️⃣ The increase in % rates will stop closer to the US presidential election, which is logical.
2️⃣ Before elections, the ruling party always shows the people the positive in its work for the people, even if there is none, i.e. injects money into the economy.
3️⃣ Handing out "free money" to potential voters before elections. Who will take it to the stock and cryptocurrency markets.
4️⃣ Changing the bear market cycle to a conventionally bullish one in 2024 and a bullish one in 2025.
5️⃣ Overcoming previous all-time highs, this is the third time we have tested this resistance of the SP500 index.
In other words, everything is as always. Before the elections, “everyone is good” and is pushing the economy up. USA together with the Fed. Only the so-called “black swan” can influence this, whether it is real (there are no such things) or staged, it doesn’t really matter. But, this is all a hypothetical probability, nothing more, which must always be kept in mind. Therefore, when the market rises, protect your profits with stop losses or hedge with correlated positions. As a rule, nothing happens, and if it does, the event itself is always inflated by the media and bloggers tens of times in importance, thereby creating the illusion of fear. Don't fall for such tricks, either.
The present, and especially the future, is not always a projection of a repetition of the past. It may be conditionally the same, but the details are radically different. This must always be remembered.
On linear, it looks like this:
The main trend of the index More than 100 years for clarity. Publication 11/22/2022
SP500 index. The whole trend. Anniversary 100 years
Vertical growth by +372% (madness, super pump)
Before the super collapse of the “Great Depression” Publication 11/22/2022
SP500 index. Pumping before the "Great Depression" Code 372-69
The game controls the people, not the people the game. The concept of a lot is always replaced by a little, a little more, until all their expectations “burst” from greed. This encourages some to become wiser, some, on the contrary, the closer the abyss, the cuter the devils.

S&P 500 (SPX) Hits All Targets! Bullish Rally CompletesThe S&P 500 Index has shown strong bullish momentum, with the long trade successfully reaching all profit targets.
Key Levels
Entry: 5719.98 – The long position was entered as the price broke above this level, confirming bullish sentiment.
Stop-Loss (SL): 5703.41 – Positioned below recent support to protect against potential downside risk.
Take Profit 1 (TP1): 5740.45 – The first target was hit, confirming the upward momentum.
Take Profit 2 (TP2): 5773.57 – The second target was achieved as the bullish trend continued.
Take Profit 3 (TP3): 5806.70 – The third target was reached, indicating continued strength in the market.
Take Profit 4 (TP4): 5827.17 – The final profit target was reached, marking a highly successful long trade.
Trend Analysis
The price is well above the Risological Dotted trendline, indicating a strong bullish trend. The steady upward movement suggests that the market sentiment is favorable for further gains, although all targets have been hit, marking the trade's conclusion.
The long trade on the S&P 500 Index successfully hit all profit targets, with the final target at 5827.17 signaling a strong rally. The upward momentum was supported by the Risological Dotted trendline, reflecting solid market conditions for bullish trades.

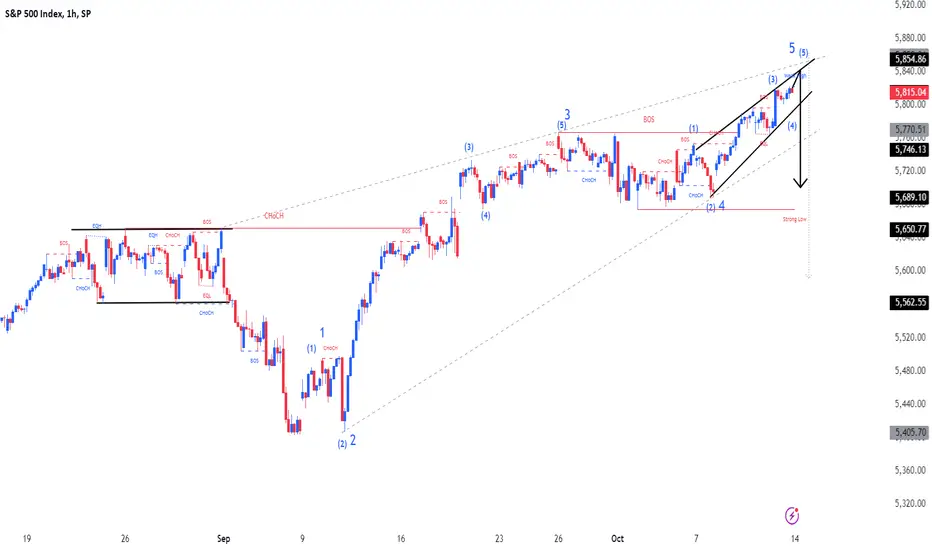
SPX500Pair : SPX500 Index
Description :
Completed " 12345 " Impulsive Waves
Break of Structure
RSI - Divergence
Rising Wedge as an Corrective Pattern in Short Time Frame and Long Time Frame
Demand Zone
Looking For Next Market Top AgainLooking for next top
Submillennium 1
Grand Supercycle 5 - green
Supercycle 1
Cycle 5 - orange
Primary 5 - blue
Intermediate 5 - pink
Minor 5 - yellow
Minute 5 - green
I will try to find the next top off simply modified wave theory.
First we need to set the baseline. I prefer the chart SPX500USD as it encompasses 23 hour trading during the week and can capture movement not always distinguishable in the SP:SPX chart.
My first step is always to identify the location of wave 3 (if it exists). I do this by using my Elliott Wave 3 Finder v2 in conjunction with my RSI triple confirm indicator and a simple RSI 9.
My wave 3 indicator will have a painted background at potential wave 3 locations, blue background for bearish reversals and pink for bullish reversals. My triple confirm RSI should signal in conjunction with the actual wave 3 point, red for bearish reversals and green for bullish reversals. My wave 3 indicator tends to spot wave 3 of 3 by displaying a gap between painted backgrounds. These indicators signal upon market close and are not considered finalized signals until the next bar begins.
My baseline is in the 2 month chart. I have worked through the historical SPX chart and believe we are in the fifth and final wave (Grand Supercycle 5) of a larger structure (Sub Millennium 1) that began in the 1800s. This specific wave 5 began at the market bottom in 2009, and we are only in the first (Supercycle 1) of five waves to the upside. I do not expect a catastrophic market top for many decades to come.
This chart picks up around 2004 to the current time. We are likely in Cycle wave 5 which began at the market low in October 2022. I have determined Cycle wave 3 to have ended at the peak at the beginning of 2022 based on the wave 3 indicator and RSI agreeing on a reversal point. In the moment, I would not have agreed the market topped in January 2022 as the indicators were still signaling. It is only on the preceding bar not producing a signal that an event is confirmed. Next I will determine common wave extensions off (Fibonacci levels) of Cycle wave 3's movement which began at the low in January 2016 at 1,806.25 and ended at 4,820.20 in January 2022. Wave 3 moved 3,013.95 points. Cycle wave 5 could move 123.6% to 138.2% of Wave 3's movement. These means a potential endpoint is between 5,531.49-5,971.53. This will be the orange outlined box in the following charts and the main chart above.
Next I will try to identify a current Primary wave 3 inside of Cycle wave 5. My indicators point to Primary wave 3 ending around the mid-July 2024 on the 2-day chart based on the gap in the wave 3 indicators. There is not an RSI 3 signal in the 2-day chart for Primary wave 3, but there was one for Minor wave 3 in Intermediate wave 3 in Primary wave 3 around February 12, 2024. We can attempt to confirm this by seeing where the end of Intermediate wave 5's movement extended too. If Intermediate wave 3 began January 5, 2024 and ended March 29, 2024, Intermediate wave 5 topped close to 161.8% of Intermediate wave 3's movement as seen below:
Based on this assumption, Primary wave 3 was likely over by mid-July 2024. The next Fibonacci wave extension levels for Cycle wave 5 could see this wave end between 108-123.6% of Primary wave 3's movement. This places a potential top between 5,806.48-6,052.34. This will be the light blue outlined box in the following charts and the main chart above.
We will next move inside of Primary wave 5 which possibly began at the low from the beginning of August 2024. In looking for Intermediate wave 3 inside of Primary wave 5, the indicators point to Minor wave 3 of Intermediate wave 3 occurring on September 19, 2024 and the Minute wave 3 inside of Minor wave 3 occurring on September 13. If we find the Intermediate wave 5 extension from this Intermediate wave 3, a potential top sits between 5,816.26-5,936.51. This will be the pink outlined box in the following charts and the main chart above.
Next we try to identify where we are in Intermediate wave 5. The 2-hour chart here indicates a possible Minor wave 3 occurring on October 9, 2024. A possible Minor wave 5 extension from here is a top between 5,825.38-5,868.50. This will be the yellow outlined box in the following charts and the main chart above.
We can attempt to go a final level deeper inside of Minor wave 5. We currently have Minute wave 3 indications based on the high from earlier today at 5826.90. If this is the end of Minute wave 3, Minute 5 could top between 5,834.16-5,857.61. This will be the yellow outlined box in the following charts and the main chart above. Based on a this wave set being over a small timeframe, this top could happen before next Tuesday. This is zone of interest for a near-term top.
This is purely theoretical, but Israel will likely strike at Iran soon. Iran has claimed they would respond quickly, but the prior instances saw long delays in the response. If Iran has an immediate response, a full on conflict would be underway in the Middle East. Not all wars are bad, but this one would likely impact oil and depending on the duration likely impact economies around the world. A contained conflict between a few nations likely would not spiral into a larger conflict, however, strong alliances on other side could turn this into a much greater event, closer to a world war situation. As drastic as this is, it could explain a potential near-term top. If conflict does not break out, we will likely see a short-term market top before continued movement higher and higher. Time will tell. Enjoy!

S&P 500 Bull Breakout: What Is Next?A strong daily bullish close hold could open the door for another bull rally on S&P500

The key is whether it can rise above 5878.7-6119.3
Hello, traders.
If you "Follow", you can always get new information quickly.
Please also click "Boost".
Have a nice day today.
-------------------------------------
I think this is the first time I've written an idea for the SPX500USD futures chart.
I'll give you an example of how to actually use it using the parallel channel that I introduced.
No matter how good an indicator or chart tool is added, if you don't know how to use it, chart analysis can be done in the wrong direction, so it is recommended that you familiarize yourself with the core interpretation method and how to use it before using it.
There are many examples of how to draw a trend line or how to draw a parallel channel, so you need to study how to draw it.
-----------------------------------------------
(SPX500USD 1M chart)
It is rising near the upper black line of the parallel channel.
Therefore, it is likely to face resistance near the black line and fall.
Accordingly, we need to check for support near 1 (5878.7) drawn with the right trend period Fibonacci Extension (Trend-Based Fib Extension) tool.
If it falls, we need to check if it can rise along the middle point (black dotted line) of the parallel channel.
However, since the section pointed to by the finger is an important support and resistance section, if it receives support near this section, it is highly likely that the upward trend will continue.
-
The left trend period Fibonacci Extension (Trend-Based Fib Extension) is drawn as the first rising wave on the 12M chart.
The trend-based Fibonacci extension on the right is drawn as the last rising wave on the 1M chart.
-
The section drawn as a square box corresponds to an important section among the Fibonacci ratios drawn on the chart, and when viewed as a parallel channel, it passes near the upper black line, so you can see that it corresponds to an important section.
-
(1D chart)
Since it is a futures chart, it is right to explain it on a time frame chart that can actually be traded, but since an idea can become useless as soon as time passes after publishing it, I will explain it based on the 1D chart.
I think the most important trend in futures trading is the trend of the 1D chart.
Therefore, when trading in the opposite direction of the trend of the 1D chart, you need to respond quickly and briefly.
-
A parallel channel was also drawn on the 1D chart.
The first point is designated as the point that is supported and rises from the middle point of the parallel channel drawn on the 12M chart, and the point that the finger points to is designated to draw the parallel channel.
The HA-MS indicator was used to draw the support and resistance points.
However, as shown in the chart above, the HA-MS indicator may be distracting when viewing the chart, so I am explaining it by disabling it.
-
The key is whether the price can be maintained by rising above 5741.6.
The 5741.6 point is the HA-High indicator point on the 1D chart, meaning that anything above this point is in the high range.
Since the StochRSI indicator is currently in the oversold range, it is more likely to lead to an additional decline.
Therefore, if the price falls, the key is whether it can be supported near the middle point of the parallel channel on the 1D chart, which is the section indicated by the circle.
That said, I don't think it's a good idea to enter a sell (SHORT) position right now.
The reason is that the StochRSI indicator is in the oversold section.
Therefore, if you want to trade with a sell (SHORT) position through scalping and day trading, you need to respond quickly and quickly.
Although the StochRSI indicator has entered the oversold section, the BW indicator is still rising.
Therefore, you should consider that there is a high possibility of a fake or sweep that pretends to fall.
Therefore, in order to make a big profit with a sell (SHORT) position, the BW indicator should be in a horizontal line at the highest point (100) and the StochRSI indicator should be falling in the overbought section.
-
Have a nice time.
Thank you.
--------------------------------------------------

Global M2 Money Supply Vs BTCSo when we look just at the Global M2 money supply, we can see its increasing and sharply.
However, when you look at BTC, BTC is lagging behind, and the increase in M2 Global supply has yet to have an effect on BTC where we would expect to see a price increase as M2 money supply increases.
If you compare the M2 Global money supply against S&P500 though, it tells us a different story, where the S&P is leading and BTC is lagging.
Signalling to me a catch up in BTC is inevitable at this stage and its being squeezed at these levels as money flow increases.
A good signs imo and no doubt BTC catches up to S&P500

Global M2 Money Supply Vs S&P500So when we look just at the Global M2 money supply, we can see its increasing and sharply.
However, when you look at BTC, BTC is lagging behind, and the increase in M2 Global supply has yet to have an effect on BTC where we would expect to see a price increase as M2 money supply increases.
If you compare the M2 Global money supply against S&P500 though, it tells us a different story, where the S&P is leading and BTC is lagging.
Signalling to me a catch up in BTC is inevitable at this stage and its being squeezed at these levels as money flow increases.
A good signs imo and no doubt BTC catches up to S&P500

Understanding Warren Buffett’s Investment PhilosophyWarren Buffett is arguably one of the most successful investors of all time. Over the years, he has developed a set of principles and strategies over his career. He was inspired by the teachings of key financial thinkers like Phil Fisher, Benjamin Graham and Charlie Munger.
Key Influences
Phil Fisher
Fisher’s approach focusses on quality companies with long-term growth potential, emphasizing focused portfolios and long-term holdings. He believed in gathering information about a company beyond what’s readily available. His lessons on maintaining a focused portfolio and committing to long-term holdings are clear influences on Buffett’s patient, value-driven investment philosophy.
Benjamin Graham
Known as the father of value investing, Graham’s core principle was to buy stocks at a price lower than their intrinsic value, creating a margin of safety (MOS). This strategy helps mitigate risk and increase the likelihood of future gains. Buffett absorbed Graham’s teaching on finding stocks that are undervalued and buying them at the right price— definitely a large contributor of his investment success.
Charlie Munger
Munger is Warren Buffett’s long-time business partner. He introduced the concept of economic moats, which refers to a company’s long-term, sustainable competitive advantages. Munger advocates investing in businesses that can fend off competition and maintain profitability over time. This philosophy drives Buffett’s focus on companies with strong market positions and solid long-term potential, favoring these over shorter-term, speculative opportunities.
Buffett's Investment Approach
1 - Buy for the Long Term. Buffett’s strategy emphasizes identifying companies that can consistently perform well over long periods. He holds stocks for years, or even decades, often looking for opportunities where other investors may overlook value.
2 - Buy at the Right Price . Buffett is known for his discipline in waiting for the right moment to invest. His approach ensures he doesn’t overpay, instead seeking stocks when they are priced below their true value, maintaining a margin of safety.
3 - Buy the Right Stocks . Buffett doesn’t just buy cheap stocks, he buys quality companies with sustainable advantages. His goal is to invest in firms with strong business models that will continue to perform well regardless of market conditions.
Warren Buffett emphasizes investing in companies with simple and clear business models , ones that fall within his circle of competence. He prefers to thoroughly understand the operations, products, and long-term prospects of a company before making any investment.
This principle is combined with in-depth analysis of how the company operates and how sustainable its valuations and future growth prospects are. If a business model is too complex or outside his expertise, he avoids it.
He prioritizes companies with integrity and transparency in their management. He believes in backing leaders who are passionate, have strong vision and execution capabilities and who use shareholder funds wisely. Trusting management to run the company effectively, with efficiency and accountability, is critical for long-term success in Buffett’s eyes.
Investing in quality companies isn’t enough—Buffett also insists on buying them at attractive prices. He maintains a strict discipline of buying with a margin of safety, ensuring the price paid is lower than the company’s intrinsic value. This means waiting for opportunities to buy great businesses at fair prices rather than settling for fair businesses at attractive prices , which may not perform well over time.
Buffett has made many of his lessons and strategies available to the public through his letters to shareholders and partnership letters. These documents offer insight into his investment approach, decision-making process, and lessons from both successes and failures. There are several key books that capture Buffett’s life, philosophy, and strategies in greater detail:
Warren Buffett’s Ground Rules
The Warren Buffett Way
Buffett: The Making of an American Capitalist
The Warren Buffett Portfolio
The Snowball: Warren Buffett and the Business of Life
Each of these resources provides a comprehensive look into the mind of one of the most successful investors of all time, offering practical advice and detailed case studies of his investments.
________________________________

SPX500 intraday dips continue to attract buyers.US500 - 24h expiry
Buying pressure from 5714 resulted in all the initial daily selloff being recaptured.
Broken out of the channel formation to the upside.
Price action continues to trade around the all-time highs.
Dips continue to attract buyers.
We look to set longs in early trade for a further test of the fragile looking resistance.
Our profit targets will be 5785 and 5800
Resistance: 5780 / 5784 / 5800
Support: 5745 / 5730 / 5714
Risk Disclaimer
The trade ideas beyond this page are for informational purposes only and do not constitute investment advice or a solicitation to trade. This information is provided by Signal Centre, a third-party unaffiliated with OANDA, and is intended for general circulation only. OANDA does not guarantee the accuracy of this information and assumes no responsibilities for the information provided by the third party. The information does not take into account the specific investment objectives, financial situation, or particular needs of any particular person. You should take into account your specific investment objectives, financial situation, and particular needs before making a commitment to trade, including seeking advice from an independent financial adviser regarding the suitability of the investment, under a separate engagement, as you deem fit.
You accept that you assume all risks in independently viewing the contents and selecting a chosen strategy.
Where the research is distributed in Singapore to a person who is not an Accredited Investor, Expert Investor or an Institutional Investor, Oanda Asia Pacific Pte Ltd (“OAP“) accepts legal responsibility for the contents of the report to such persons only to the extent required by law. Singapore customers should contact OAP at 6579 8289 for matters arising from, or in connection with, the information/research distributed.

spx &nasdaq in an iminent drop of valuespx showing an iminent short going in value, where it can go? last time i tryed to do the math it would go arround 2700 but without any sure, the major stock whealtiest did a 3x wealth since covid drop, this could be another timer that can quintuple the value, or make more 15x time the value that they had before covid, it is an iminent drop coming, in my opinion, good for everyone even for world economies, to triple their whealth and put the profits in their balance sheet and put time their gdp growth, is a question of timing, after covid drop, that in my opinion, didnt had too much growth in manufactories and jobs, only people gowing ther whealth by the 'inflation' fault,
anyway, there is an iminent drop in the stock market in the western countries, at least, im not into asian market but american indexes are in an eminent significant drop, in my POV.

SPX500 Resistance Ahead!SPX500 keep growing in
An uptrend but the index
Will soon hit a horizontal
Resistance of 5645.15 and
After the retest we will
Be expecting a local
Bearish reaction!

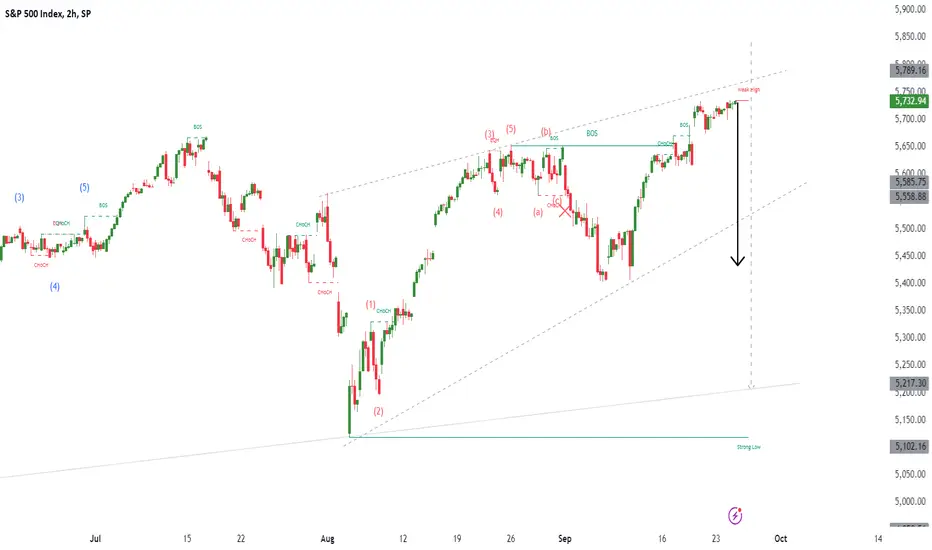
SPX500Pair : SPX500 Index
Description :
Completed " 12345 " Impulsive Waves
Break of Structure
RSI - Divergence
Rising Wedge as an Corrective Pattern in Short Time Frame
Resistance Level
Major Top Forming on SPXHello Everyone, a simple analysis of the RSI and current price action appear eerily similar to the 2022 peak. During the 2022 top we had financial experts and the media claiming victory stating that this bull market will continue, however we crashed soon after. Now the SPX is currently forming a topping process, this could be done or we could go a little higher before the bear market continues. It's clear that the SPX is making new highs while NDX and IWM fail to make a new high suggesting that this is the top.
If this economy is doing so good, then why does the FED need to cut interest rates? The fed is cutting interest rates because we are either in a recession or we are very close to one. There is no such thing as a soft landing. The truth is we may already be in a recession and it wouldn't be declared until we are deep into one.
If anything we are no longer going into a recession, we are going into a depression. Do not get lulled into a false sense of security like many others during the 2000 and 2008 top.

SPX500USD Is Bullish! Buy!
Please, check our technical outlook for SPX500USD.
Time Frame: 9h
Current Trend: Bullish
Sentiment: Oversold (based on 7-period RSI)
Forecast: Bullish
The market is on a crucial zone of demand 5,711.6.
The oversold market condition in a combination with key structure gives us a relatively strong bullish signal with goal 5,801.4 level.
P.S
The term oversold refers to a condition where an asset has traded lower in price and has the potential for a price bounce.
Overbought refers to market scenarios where the instrument is traded considerably higher than its fair value. Overvaluation is caused by market sentiments when there is positive news.
Like and subscribe and comment my ideas if you enjoy them!

S&P500 H4 | Bearish Drop Based on the H4 chart analysis, we can see that the price has just reacted off our sell entry at 5,732.82, which is a swing-high resistance that lines up with the 127.20% Fibo retracement.
Our take profit will be at 5,672.36, a pullback support level.
The stop loss will be placed at 5,800.93, which is above 61.8% Fibo projection
High Risk Investment Warning
Trading Forex/CFDs on margin carries a high level of risk and may not be suitable for all investors. Leverage can work against you.
Stratos Markets Limited (www.fxcm.com):
CFDs are complex instruments and come with a high risk of losing money rapidly due to leverage. 62% of retail investor accounts lose money when trading CFDs with this provider.You should consider whether you understand how CFDs work and whether you can afford to take the high risk of losing your money.
Stratos Europe Ltd, previously FXCM EU Ltd (www.fxcm.com):
CFDs are complex instruments and come with a high risk of losing money rapidly due to leverage. 59% of retail investor accounts lose money when trading CFDs with this provider. You should consider whether you understand how CFDs work and whether you can afford to take the high risk of losing your money.
Stratos Trading Pty. Limited (www.fxcm.com):
Trading FX/CFDs carries significant risks. FXCM AU (AFSL 309763), please read the Financial Services Guide, Product Disclosure Statement, Target Market Determination and Terms of Business at www.fxcm.com
Stratos Global LLC (www.fxcm.com):
Losses can exceed deposits.
Please be advised that the information presented on TradingView is provided to FXCM (‘Company’, ‘we’) by a third-party provider (‘TFA Global Pte Ltd’). Please be reminded that you are solely responsible for the trading decisions on your account. There is a very high degree of risk involved in trading. Any information and/or content is intended entirely for research, educational and informational purposes only and does not constitute investment or consultation advice or investment strategy. The information is not tailored to the investment needs of any specific person and therefore does not involve a consideration of any of the investment objectives, financial situation or needs of any viewer that may receive it. Kindly also note that past performance is not a reliable indicator of future results. Actual results may differ materially from those anticipated in forward-looking or past performance statements. We assume no liability as to the accuracy or completeness of any of the information and/or content provided herein and the Company cannot be held responsible for any omission, mistake nor for any loss or damage including without limitation to any loss of profit which may arise from reliance on any information supplied by TFA Global Pte Ltd.
The speaker(s) is neither an employee, agent nor representative of FXCM and is therefore acting independently. The opinions given are their own, constitute general market commentary, and do not constitute the opinion or advice of FXCM or any form of personal or investment advice. FXCM neither endorses nor guarantees offerings of third party speakers, nor is FXCM responsible for the content, veracity or opinions of third-party speakers, presenters or participants.

SPX500 / US500 Bank Money Heist Plan On Bullish SideBonjour My Dear Robbers / Money Makers & Losers, 🤑 💰
This is our master plan to Heist SPX500 / US500 Bank based on Thief Trading style Technical Analysis.. kindly please follow the plan I have mentioned in the chart focus on Long entry. Our target is Red Zone that is High risk Dangerous level, market is overbought / Consolidation / Trend Reversal / Trap at the level Bearish Robbers / Traders gain the strength. Be safe and be careful and Be rich.
Attention for Scalpers : If you've got a lot of money you can get out right away otherwise you can join with a swing trade robbers and continue the heist plan, Use Trailing SL to protect our money 💰.
Note: If you've got a lot of money you can get out right away otherwise you can join with a swing trade robbers and continue the heist plan, Use Trailing SL to protect our money.
Entry : Can be taken Anywhere, What I suggest you to Place Buy Limit Orders in 15mins Timeframe Recent / Nearest Swing Low
Stop Loss 🛑 : Recent Swing Low using 30m timeframe
Warning : Fundamental Analysis news 📰 🗞️ comes against our robbery plan. our plan will be ruined smash the Stop Loss. Don't Enter the market at the news update.
Loot and escape on the target 🎯 Swing Traders Plz Book the partial sum of money and wait for next breakout of dynamic level / Order block, Once it is cleared we can continue our heist plan to next new target.
Support our Robbery plan we can easily make money & take money 💰💵 Follow, Like & Share with your friends and Lovers. Make our Robbery Team Very Strong Join Ur hands with US. Loot Everything in this market everyday make money easily with Thief Trading Style.
Stay tuned with me and see you again with another Heist Plan..... 🫂

SPX6900 and Project AEON probably moonsIf we could harness the power of God, could we flip the S&P500 ?
Deep within the clandestine vaults of SPX6900 Labs, a radical research experiment codenamed "Project AEON" sought the answer to this question. But then, the unexpected happened. A phenomenon known as a quantum glitch occurred, sparking life into 3333 Aeons - beings neither of this world nor wholly apart from it

SPX500USD Is Bullish! Long!
Take a look at our analysis for SPX500USD.
Time Frame: 9h
Current Trend: Bullish
Sentiment: Oversold (based on 7-period RSI)
Forecast: Bullish
The market is trading around a solid horizontal structure 5,676.2.
The above observations make me that the market will inevitably achieve 5,784.8 level.
P.S
We determine oversold/overbought condition with RSI indicator.
When it drops below 30 - the market is considered to be oversold.
When it bounces above 70 - the market is considered to be overbought.
Like and subscribe and comment my ideas if you enjoy them!

SPX500 Resistance Ahead!SPX500 is making a bullish
Correction and will soon
Hit a horizontal resistance
Level of 5492.01 from where
We will be expecting a
Further move down !
