S&P500’s Bullish Island Turns Risky: Elliott Wave Says “Top”The S&P500 Index( SP:SPX ) started to rise and even created a new All-Time High(ATH=$6,428) with the help of the Bullish Long Island Pattern , as I published in my previous idea on May 14, 2025 .
The S&P500 Index is currently moving near the Potential Reversal Zone(PRZ) , upper line of the ascending channel , the Important Resistance line , and the Yearly Resistance(1) .
In terms of Elliott Wave theory , the S&P500 Index appears to be completing microwave 5 of microwave 5 of the main wave 5 .
Also, we can see the Regular Divergence(RD-) between Consecutive Peaks .
I expect the S&P500 Index to correct at least -4% and fall to the lower line of the ascending channel .
First Target: $6,233
Second Target: $6,033
Note: Stop Loss(SL) $6,513
Do you think S&P500 Index can create a new ATH above $6,500 !?
Please respect each other's ideas and express them politely if you agree or disagree.
S&P 500 Index Analyze (SPX500USD), Daily time frame.
Be sure to follow the updated ideas.
Do not forget to put a Stop loss for your positions (For every position you want to open).
Please follow your strategy and updates; this is just my Idea, and I will gladly see your ideas in this post.
Please do not forget the ✅' like '✅ button 🙏😊 & Share it with your friends; thanks, and Trade safe.
Spxanalysis

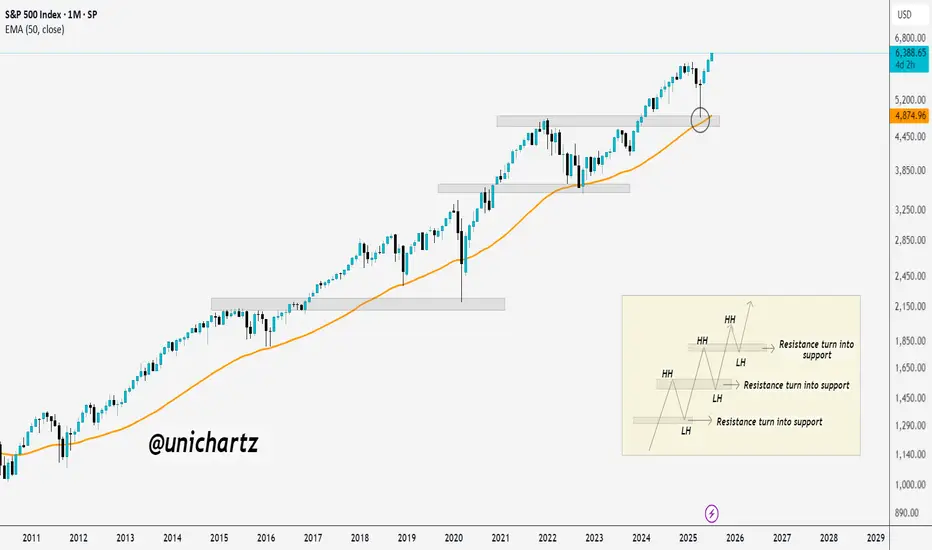
New All-Time Highs for S&P 500 – No Resistance AheadThe S&P 500 is officially in price discovery mode, printing new all-time highs with clean higher highs and higher lows.
Each old resistance flipped into strong support—textbook bullish market structure.
As long as this trend holds, there's no ceiling in sight. Bulls are fully in control.
S&P 500 (CASH500) - Double Top H1Risk/reward = 2.7
Entry price = 6388.4
Stop loss price = 6399.7
Take profit level 1 (50%) = 6360.4
Take profit level 2 (50%) = 6352
Also, waiting on confirmation on some variables

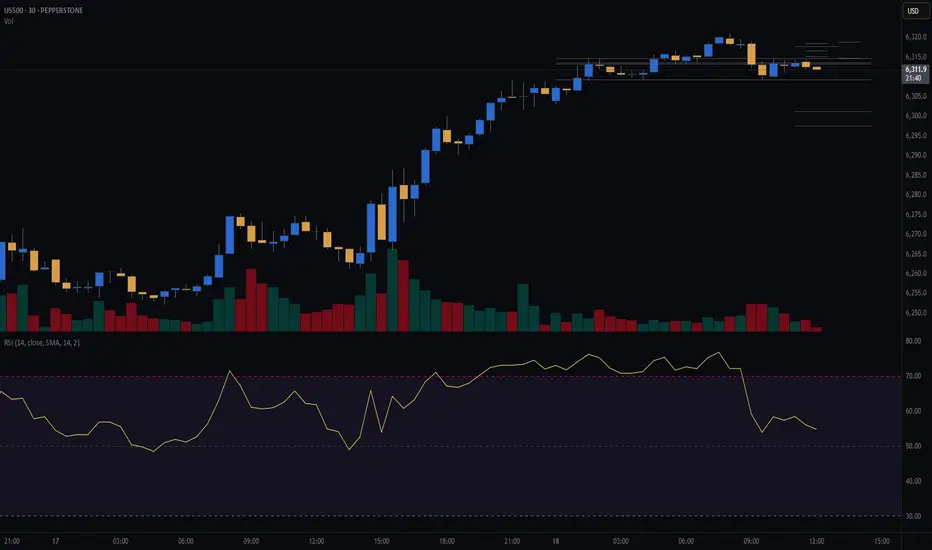
S&P500 (CASH500) (SPX500) SHORT - Head and shoulders 30minRisk/reward = 3.3
Entry price = 6314.8
Stop loss price = 6318.4
Take profit level 1 (50%) = 6301.3
Take profit level 2 (50%) = 6297.5
Waiting on validation from a few other variables.
For example, waiting for the current 30min candle to close in range.
Letssss goooooo
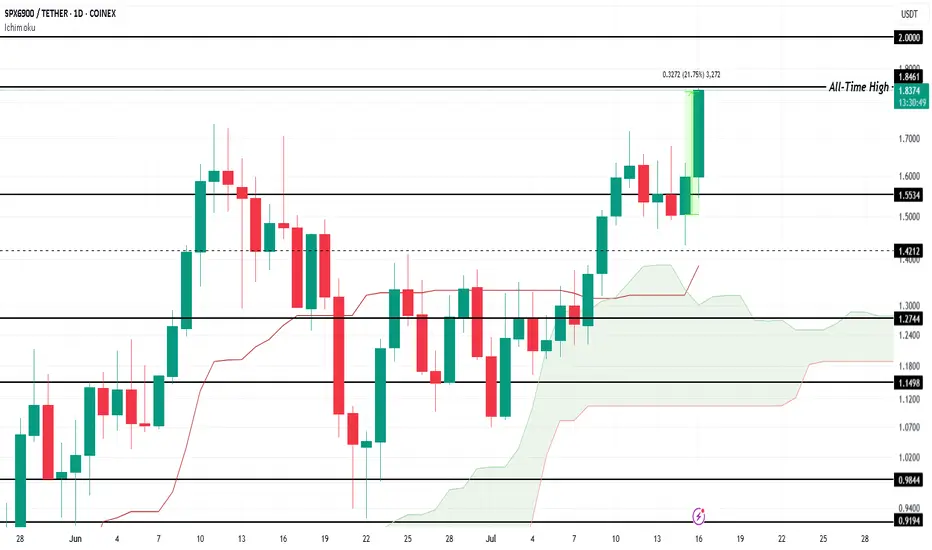
SPX Forms New All-Time High, Price Nears $2.00COINEX:SPXUSDT price has surged by 21.75% over the last 24 hours , reaching a new all-time high (ATH) of $1.84 . At the time of writing, SPX is trading at $1.83, showing promising signs of further upward movement. The altcoin's strong performance reflects growing investor interest and market optimism.
The Ichimoku Cloud, which lies beneath the candlesticks, signals that bullish momentum is currently prevailing for $COINEX:SPXUSDT. This technical indicator suggests that the altcoin could continue its ascent, potentially breaching the $2.00 level in the near future . If the trend persists, SPX could set new price milestones.
However, if COINEX:SPXUSDT experiences significant selling pressure from investors, the altcoin could face a correction. A drop below $1.55 would indicate a shift in momentum and potentially erase some of the recent gains. A failure to maintain key support levels could lead to further downside risks.
S&P 500 Breaks UptrendS&P 500 Breaks Uptrend
Only yesterday we questioned the sustainability of the stock market’s upward trend amid alarming news from the Middle East and the evacuation of the US embassy in Iraq — and today, the S&P 500 chart (US SPX 500 mini on FXOpen) shows a break below the lower boundary of the ascending trend channel.
According to media reports:
→ Steve Witkoff, US President Donald Trump’s special envoy to the Middle East, was expected to meet Iran’s Foreign Minister in Oman on Sunday.
→ Friday the 13th became the date when Israel launched strikes on Iran’s nuclear facilities, dramatically altering the outlook for a potential US-Iran nuclear agreement.
→ Secretary of State Marco Rubio stated that the US was not involved in the operation, while Israel’s state broadcaster reported that Washington had been informed ahead of the strikes.
Technical Analysis of the S&P 500 Chart
Yesterday morning, we noted that the Q-line, which divides the lower half of the channel into two quarters, had shifted from acting as support to becoming resistance. This was confirmed during the US trading session (as indicated by the arrow).
Selling pressure intensified, and the psychologically important 6,000 level — which showed signs of support earlier in June — now appears to be acting as resistance. It is in this area that the E-Mini S&P 500 (US SPX 500 mini on FXOpen) broke below the lower boundary of its uptrend channel.
In addition to ongoing discussions about potential Fed rate cuts this summer, geopolitical risk assessments are now also in focus. It remains unclear how Washington will respond if Iran retaliates.
Meanwhile, Israel’s Defence Minister has declared a state of emergency, warning of an imminent missile and drone attack — further fuelling fears of a possible escalation.
This article represents the opinion of the Companies operating under the FXOpen brand only. It is not to be construed as an offer, solicitation, or recommendation with respect to products and services provided by the Companies operating under the FXOpen brand, nor is it to be considered financial advice.

SPX Technical Analysis – Bullish StructureSPX Technical Analysis – Bullish Structure
The overall trend of SPX appears bullish, and based on the current structure, the asset shows potential for a 20% upside, with a possible move toward the $1.25 level.
Key support zones to watch are:
$0.90, which is approximately 11% below the current price
$0.80, which is around 21% below and can be considered the main support
As long as the price holds above these key levels and the bullish trend remains intact, the outlook stays optimistic for further upward continuation.
📌 This analysis is for educational and informational purposes only and does not constitute financial advice.
📝 Follow for more updates on SPX and other assets

Spx500usd up? 1min chart at 23h London time?As it is , all I hope is that spx 500usd starts here at that blue line, after all, if it starts at the blue line the stock as might be up again, I'm not into the fundamentals by this time, I'm just making some Elliot and indicators-some mine, others don't, and trend analysis
Hope u guys all in profit
After all we all looking for the same
Keep Ur trades safe
And Do Always Your Own Research
DAYOR
Keep it safe
This my my graph at 1min candles, returned to 15min chart
Keep it safe.
And keep cool.

S&P 500 Rally Exhausted? Watch This Level for the Next Drop!The S&P 500 Index( SP:SPX ) has finally touched the Resistance zone($5,680-$5,500) as I expected in my previous post .
The S&P 500 Index is moving near the Resistance zone($5,680-$5,500) , the Resistance line, and Yearly Pivot Point .
Also, we can see the Regular Divergence(RD-) between Consecutive Peaks .
In terms of Elliott Wave theory , it seems that the S&P 500 Index is completing the Zigzag Correction(ABC/5-3-5) , and if the uptrend line breaks , we can confirm the end of the Zigzag correction .
When the S&P 500 Index started to rise on April 22 , Bitcoin also started to rise at the same time , so a decline in the S&P 500 Index can cause Bitcoin ( BINANCE:BTCUSDT ) to decline .
I expect the S&P 500 Index to drop to at least $5,313 AFTER breaking the uptrend line .
Note: If the S&P 500 Index touches $5,712, we can expect more pumps.
Please respect each other's ideas and express them politely if you agree or disagree.
S&P 500 Index Analyze (SPX500USD),2-hour time frame.
Be sure to follow the updated ideas.
Do not forget to put a Stop loss for your positions (For every position you want to open).
Please follow your strategy and updates; this is just my Idea, and I will gladly see your ideas in this post.
Please do not forget the ✅' like '✅ button 🙏😊 & Share it with your friends; thanks, and Trade safe.

S&P500 Index Intraday Trend Analysis for April 23, 2025Market Timing tool signals Bearish Trend for the day and the Sell Signal got confirmed with Stop Loss @ 5471. Trailing Stop Loss for running sell is at 5394. First Target for the bearish trend is at 5318 and if the market moves down further, it may take support at 5173.
It's my view. Traders are suggested to follow technical analysis for trade entries with proper risk management rules.

SPX bounce is dueSPX RSI hasn't been so oversold since the Corona crash, plus bouncing from the 2022 ATH
Relief is due

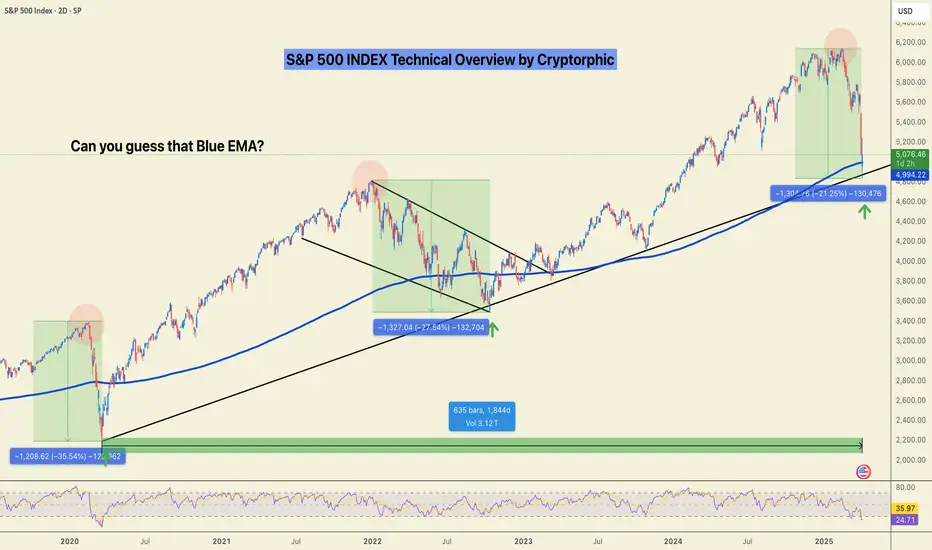
S&P 500: Valuation Correction or the Start of a Breakdown?Valuation Correction or the Start of a Breakdown?
Zoom out. Clear the noise.
We might still sweep the lows, but when viewed on the weekly timeframe, this current S&P 500 move looks more like a healthy valuation correction than a structural breakdown.
Let’s break it down by the numbers using fractal analysis:
🟩 March 2020 (COVID Crash):
▪️~35% drop
▪️V-shaped recovery
▪️Oversold RSI bounce
🟨 2022 Bear Market:
▪️~27% correction
▪️Multi-month wedge consolidation
▪️Eventually led to an upside breakout
🟦 Now (2025):
▪️~21% correction so far
▪️Retesting long-term trendline
▪️RSI in familiar oversold zone
📊 Fractal Math:
- From 35% to 27% = 22.86% decrease
- From 27% to 21% = 22.22% decrease
Both legs show a consistent ~22% drop in correction depth suggesting bearish momentum is weakening with each cycle. Currently bouncing off the1844 days of support.
Is this the bottom? Will there be relief?
🔁 If this pattern holds:
- We could see a short-term sweep or deviation under recent lows.
- But structure favours a potential recovery from this zone, unless the trendline breaks decisively.
📌 Watch levels closely. Timing matters.
🧠 What’s your take, is this another “buy the dip” moment?
Do hit the like button if you liked this update and share your views in the comment section.
SPX Is About to Explode – Here’s What I’m WatchingSPX is at a critical level, and whichever way it breaks, the move could be huge. Here’s my take:
If we drop below 5663, I see a move down to 5534 – 5445. If that zone fails, we could head toward 5332, and if selling pressure keeps up, 5234 might be next.
But if we break above 5800, the bulls could take over, pushing to 5972, and maybe even 6149.
It’s all about reaction levels now. I’m watching these zones closely—what’s your take? Are we heading up or breaking down?
Kris/ Mindbloome Exchange
Trader Smarter Live Better

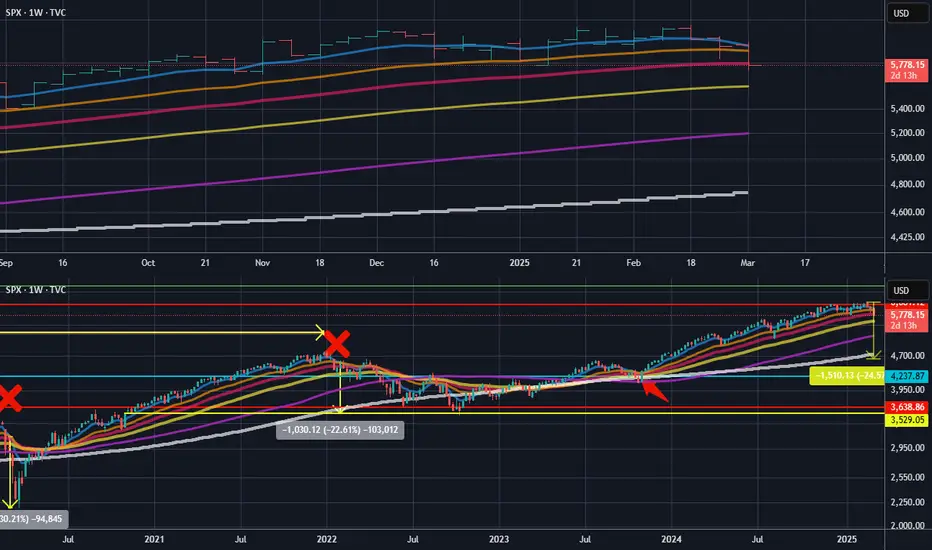
SPX chart update after calling moves to the $ for 3 yearsHere is the 1st chart I did of SPX back in Jan 2022:
I called the drop to the yellow line on chart. Nailed it to nearly the exact $.
Then in October 2023 I mentioned this:
The rally was confirmed for the next 6 months minimum.
Then in Jan 2024 I posted a red horizontal line as target for the rally:
Now you can see on current bottom chart that price hit the red line target.
This chart setup you see on bottom chart also shows relevance to the 1st chart I did on SPX where when the blue EMA8 went below the orange MA21, a drop happened as per the red X marks and price changes shown on chart. This is close to happening currently which is easier to see on the top chart as I give a close up view on current price action and the EMA/MA's.
Are we about to see a drop as per yellow price change on chart or can SPX bounce from here and move up to the green horizontal line on chart? The EMA/MA crossunder will tell us.
Even though I called the moves all correct previously, at this time in the markets, things are alot trickier so I cannot say with conviction this time around as to which way it will go.
I will update the analysis once the bounce or cross under is confirmed.
SPX Target 6270 - Can It Get There?SPX Targets 6270 – But Can It Get There? | SPX Market Analysis 20 Feb 2025
The SPX is climbing like a caffeinated squirrel... ok, maybe not. It’s more like a slightly confused sloth trying to find second gear!..., while DJX and RUT are stuck in the mud.
The breakout move we’ve been waiting for has arrived, and now the question is—does it have enough fuel to hit 6270, or will it stumble and trigger my hedge at 6100? Bollinger Bands are too tight for reliable setups, so I’m sticking with my 6 money-making patterns until volatility expands.
Let’s break it all down…
---
SPX Deeper Dive Analysis:
📈 SPX is Soaring (like a fat pigeon!) – But the Other Indexes Aren’t Joining the Party
While SPX is off making new highs, its friends DJX and RUT seem to have lost their invitations.
DJX is struggling to gain meaningful ground 📉
RUT can’t even catch an uptick, making it the weakest of the bunch ❌
Meanwhile, SPX is leading the way, with a clear breakout in play
A closely following NDX is nipping at SPX's heals
💡 Breakout Confirmed – But Can It Hold?
Scenario #1 from our previous discussions has unfolded—the range has broken out.
Target: 6270 🎯
Hedge trigger: 6100 in case the move fails
This is the good kind of waiting—waiting for profits to materialise
🔄 Why I’m Avoiding Tag ‘n Turn Setups Right Now
Normally, after a breakout, I’d shift back to Tag 'n Turn setups. But there’s a problem…
Bollinger Bandwidth is too tight, making moves too fast
Price is flipping from one side of the bands to the other
A Bollinger Band pinch is forming, indicating more compression before expansion
So, what’s the plan?
✅ I’ll continue to use my 6 money-making patterns
✅ I’ll wait for volatility to expand before returning to Bollinger setups
✅ No forced trades—only high-probability moves
🚀 Final Takeaway?
The breakout is here, the target is set, and the plan is clear. Now, it’s time to let the market do its thing and wait for the move to play out.
---
Fun Fact
📢 Did you know? In 2018, Amazon briefly became a $1 trillion company—but it only stayed there for a few hours before dropping back below the threshold.
💡 The Lesson? Even the biggest breakouts can be short-lived—just because a stock (or index) makes a new high doesn’t mean it will stay there forever. Always have a plan—targets and hedge triggers matter.

SPX In Limbo - Which way will it break?SPX in Limbo – Will It Break Up or Down? | SPX Market Analysis 19 Feb 2025
Still waiting. Yep, that’s where we are.
The market is about as exciting as watching paint dry, but this is not the time to get impatient. As much as I’d love to jump into a trade just to feel productive, I know better—waiting for the right entry beats chasing the wrong one.
Let’s break it down while we sip on tea and pretend to be Zen masters of market patience.
---
SPX Deeper Dive Analysis:
Why Patience is Everything in Trading
There’s an old trading rule that never fails—the market will always move… eventually. But right now, it’s in one of those frustrating, indecisive moods where:
Nothing is confirming (so forcing a trade is a bad idea)
It’s stuck between two key levels (meaning we wait for the breakout or breakdown)
Volume is sluggish (which means false moves are more likely)
Still Watching Two Scenarios
☑ Scenario #1 – The Bullish Breakout Entry
Needs price to confirm above key resistance
No fakeouts—just clean, strong momentum
Only then do I consider a bullish trade
☑ Scenario #2 – The Bearish Reversal Entry
Needs clear rejection at resistance
No weak, choppy movements—just a solid confirmation
Only then do I take a bearish setup
Why Forcing Trades is a Losing Game
Let’s be honest—waiting is boring. But do you know what’s worse? Jumping into a trade just because you're impatient… and then watching it immediately go against you.
Every trader, at some point, has thought:
"It looks like it’s going to move, maybe I should enter early…" (Nope.)
"I don’t want to miss the move…" (You won’t—if you follow the plan.)
"Other traders are jumping in—should I?" (Nope. They’re probably wrong.)
The right trade at the wrong time is still the wrong trade.
What’s Next?
✅ Stay patient—the market will tip its hand soon enough
✅ Wait for clear confirmation—not “I think this might be it” confirmation
✅ Don’t trade out of boredom—trade because the setup is 100% valid
📌 Final Takeaway? Patience = profit. I’m still waiting, tea in hand, and when the market finally makes its move, I’ll be ready.
---
Fun Fact
📢 Did you know?
The stock market used to take 5 months to process a trade before the 1970s. Now? It happens in milliseconds—but traders still struggle to wait a few hours for the right setup.
💡 The Lesson?
Patience has always been a trader’s best tool. Some things never change.

Bearish Bias Locked int - Now We wait for the dropBearish Bias Locked In – Now We Wait for the Drop | SPX Market Analysis 11 Feb 2025
The bullish chapter is closed, and our focus is now entirely bearish as we eye a move toward 5980. Futures are already pointing lower, teasing a 20-point drop at the open.
Will we get the full range move, or will SPX keep stalling?
Either way, we’re locked and loaded—now, we wait for the market to tip its hand.
---
SPX Deeper Dive Analysis:
📉 Bearish Positions Locked In
SPX is now fully bearish, with bullish trades wrapped up profitably or at break-even following the bear turn signal. This continues to aligns perfectly with our 6 money-making patterns, where we expect a move from range highs to range lows.
📊 Futures Hint at a Lower Open
Overnight futures are already down 20 points, suggesting:
✅ A weaker SPX open
✅ A potential move toward 5980
✅ Confirmation that momentum is shifting lower
🔍 ADD Still Has Room to Fall
Yesterday’s ADD reading hit the upper bullish extreme
That leaves plenty of downside wiggle room
If ADD pushes lower, indexes could also follow through
⏳ For Now, It’s a Waiting Game
The bearish setup is in place
Price action will dictate the next move
A clean range move to 5980 remains the primary target
🚀 Key Takeaway? The market is aligning with expectations, but we still need follow-through to lock in profits.
Fun Fact:
📢 Did you know? In 1987, the Dow dropped 22.6% in a single day—the biggest percentage crash in history. That’s the equivalent of the S&P 500 dropping over 1,000 points today!
💡 The Lesson? Even in structured markets, major moves can happen fast. This is why having a rule-based trading system keeps you ahead of the chaos.

Bullish Continuation for SPX500After Trading in a small consolidation SPX looks to pick back up on its Bullish movement.
- Price has broken and now retesting bearish trendline.
-Price swept the lows of the liquidity and is now retesting the previous resistance of the zone.
The Retest is taking place at the H1 lvl resistance 5,903
- Rejection wick with an inside bar pattern
- There's a weak bullish divergence with the previous low.
-Wait for your entry signal

Rate Cut Disappoints: Stocks and Gold Experience Sharp Declines◉ Abstract
On December 18, 2024, the Federal Reserve lowered interest rates by 0.25%, marking its third cut in a row. However, the Fed also said it might not cut rates much more in the future because it expects the economy to grow stronger and inflation to continue. This cautious message worried investors, causing a sharp drop in the stock market.
The S&P 500 fell about 2.96%, its biggest one-day loss since August. Gold prices also dropped by around 1.6%. The declines in both stocks and gold show that investors are feeling uncertain about the economy and are rethinking their investments based on the Fed's outlook.
Continue reading the full article:
◉ Introduction
On December 18, 2024, both the S&P 500 and gold experienced significant declines, driven primarily by the Federal Reserve's monetary policy decisions and market reactions to economic forecasts.
◉ Federal Reserve's Decision
● The Federal Reserve cut interest rates by 0.25%. This is typically a positive move for equities and commodities like gold.
● However, the Fed signalled a more cautious approach to future rate cuts, expecting stronger economic growth and persistent inflation.
● This cautious outlook raised concerns about the possibility of limited future rate cuts, which spooked investors.
◉ Market Reactions
1. Stock Market Decline
● The S&P 500 fell by approximately 2.96%, marking its largest single-day percentage drop since August 5th.
● The market's reaction reflected a realization that previous optimistic expectations about aggressive rate cuts were misplaced.
2. Gold's Decline
● Gold prices dropped sharply, with an intraday decline of about 1.6%.
● Gold, while a safe-haven asset, is less desirable in a rising rate environment due to increased opportunity costs.
● With the Fed's indication of fewer future rate cuts, investors shifted away from gold.
◉ Overall Market Sentiment
The simultaneous decline in both equities and gold can be attributed to a broader market sentiment that reacted negatively to the Fed's cautious outlook on inflation and growth prospects. This created a risk-off environment where investors were uncertain about both stock valuations and commodity holdings.

S&P 500: Long Trade Targets AheadS&P 500 Trade Details:
The S&P 500 (SPX) on the 15-minute timeframe confirms a bullish breakout according to the Risological trading indicator . Target 1 (TP1) has been successfully hit, with higher targets in sight, as the bullish momentum sustains.
S&P 500 Key Levels:
Entry: 5889.16
Stop Loss (SL): 5872.22
S&P 500 Take Profit Targets:
TP1: 5910.09 ✅
TP2: 5943.96
TP3: 5977.82
TP4: 5998.75
Analysis:
The price action indicates strong upward momentum with consecutive bullish candles. The moving averages align to support the trend. Short-term resistance at higher targets may see consolidation before further upward movement.
Outlook:
With TP1 hit, the trade looks promising to reach TP2 and beyond. Keep monitoring momentum strength and secure profits as each level is achieved. Stay cautious of reversals near key resistance zones.

S&P 500TREND ; The S&P 500 index is currently in an uptrend (Bullish), characterized by higher highs and higher lows since mid-August.
PLAN :
• The support zone around 5,670 acted as a base for a recent upward move.
• The 5,870 level seems to be a key resistance area, and price is currently testing this level.
• If the price breaks above the 5,870 resistance level, my potential target will be around 5,989.15.
• Note that the blue arrow indicates the measured move from the support level at 5,750 up to the resistance at 5,870, which could imply the projected target if this breakout occurs.

SPX Analysis for Today: What’s Next After Yesterday’s Big Drop?Wow! Yesterday was brutal for us all on SPX with a major bearish move that probably left a lot of traders scratching their heads. So, what’s the game plan for today? Let’s break it down.
1. Technical Picture After the Drop
Yesterday’s sell-off took SPX to key levels, and now we’re sitting in some interesting territory. The 5550-5570 range is what we’re watching closely—this could act as support, but if it cracks, we might be heading lower, potentially toward 5500.
On the flip side, if buyers step in, we could see a bounce back toward 5550, which was previous support but might now act as resistance. Traders should keep an eye on whether we break out of that range or get rejected.
2. The News That Matters
A lot of today’s action depends on what’s going on in the broader world. Are we getting any new data on inflation or jobs? If inflation numbers come in hot, the market could get nervous again, anticipating more rate hikes from the Fed. But if the data is lighter, we might get a relief rally after yesterday’s beatdown.
Also, keep an eye on any big headlines—geopolitical tension, tech earnings, or even Fed commentary. All of these could be wildcards that drive sentiment today.
3. Sentiment Check
We’ve got VIX (the fear gauge) pretty elevated right now, so people are still pretty nervous. Watch for whether that calms down today—if it does, we might get some relief in SPX. But if VIX stays high or climbs further, brace yourselves for more volatility.
The Bottom Line:
If today’s news stokes more fear, we could see another push lower. But if the market takes a breather, we might get a short-term bounce. Either way, buckle up—it’s going to be another interesting session!

SPXPair : SPX500 Index
Description :
Double Top Pattern in Long Time Frame
RSI - Divergence
Resistance Level
Rising Wedge as an Corrective Pattern in Short Time Frame
Completed " 12345 " Impulsive Waves
