SPX flagging, there is a good setup for a good size gap down SPX flagging, there is a good setup for a good size gap down tomorrow.
Again has to gap down below 4255-57SPX to mark the top being in place (reference to March topping pattern)
If we gap down to 4189-4207SPX (the bottom of the channel) and hold it early from the open, then I will go long for a move up into the close.
If this is what will play out, then we should re-test 4308.50-23 on Monday with a gap up and crap.
So must watch number for tomorrow is 4189-4207. Must gap down below 4255 to have this setup more probable!
Some good setups are coming, just need to be patient.
Maj resistance is at 4308.5SPX on closing level.
Spxanalysis

SPX needs a Gap Down below 4255-57 tomorrow...Quick update.
The price needs to gap down tomorrow below 4255-57 to confirm the top being in place.
Usually this type of the move trap bulls for long, so as long as we gap down hard tomorrow, I can mark the top being in.
There is still a room to squeeze to 4330-34, but Im not really playing it unless I see a good setup.
If we gap up tomorrow, will have to revisit my charts.
Tomorrow should continue today's day, we had a reversal to downside and if this is real we should see a low on the 22nd-23rd, small bounce 23-24th and last low or higher low on the 25-26th
24th is a panic cycle day! Mark it on your calendar
Numbers to watch tomorrow:
- Maj resistance is the same - 4308.50 (on closing level)
- First main support is at 4255-57
- 4220 and next is at 4175
- Ideal target of this move is at 4125-46
Ideally we should see something similar of a move from EOM Mar high. You can revisit a gap down below 4520, which was retested and never seen since after.
Tomorrow's move should be a start of the first move down, fits with cycle lows into 22-23rd or 25-26th, then a rally into Labour Day high/lower high.
The week of Sep 5th is a panic cycle week, so a gap down from there is expected to trap all the bulls, especially after staying long over the long weekend.
Have a good night

spx500Hello everyone,
We have a very clear 3 wave structure here that has extended the 3rd over the 1.618% fib extension after breaking up from the ending diagonal in the intermediate 4th wave position. I wouldn't expect SP500 to fill the 3,800 or 3,600 gap anytime soon guys. So I think 4,000 or maybe , possibly over shot 3,900 worst case IMO. The 1 fib level will likely hold as strong support, but let's see.
We also know our buddy Jim Crammer is bearish, so there's that...

SPX needs to break 4245 to be bearish on this moveSPX needs to break 4245 to be bearish on this move, otherwise still in the trend channel.
Watching 4248-52 level, can be a good r/r long there at least for a bounce with a stop below 45

SPX Aug 17th updateExpected a high being hit today, we got it. Expected a close below 4308.5SPX, we got it. Expected a red close, got it only on NASDAQ and Small Caps.
As long as we stay below 4340SPX we should see lower is my next expectation.
VIX (see my update earlier) has a clear ISH pattern.
Main support is 4177SPX
Tomorrow must watch numbers are
- 4285 and especially 75, failure of holding the last number can be a good sign of the local top, need much lower to mark the maj top!
- Resistance is the same 4308.50 on the closing level.
- Upper target zone is around 4330-34SPX in case it wants to tag it, Im not playing it and will be looking for a short setup instead.
I expect this to dive down to 4150+- SPX zone by the 24th-26th and one more push to lower low /double top, or if broken above - 4425+ sometime early Sep.
Not favouring the second scenario, but can be a case for the larger B wave top in Jan.
Im not in the camp of new ATH's and the lows being in, I dont change my count to fit the price or put many counts to be right regardless.
If Im wrong at some point (everyone makes mistakes), I will admit and only then change my view. We are not even close to have that view changed at this point.
Also want to bring the attention to Sep and hope many will make a note of this warning - there is a chance we could crash that month and my charts do reflect that.
Will it be serious or not as much, I have no idea, but I see some serious signs of something happening that month.
You have been warned.
Have a good night

SPX hit 4308.50 target!Ideal target has been met!
Watch to close below 4308.50, ideally we close red, tomorrow will be a bigger sell off with the bounce on the 18th.
The target zone is at 4300-33, it can stretch into 20s, I will short it there, or short if we close below 4308.50
Timing should be right as per my last night update.
I will post a zoomed out chart after the close with the expected pathway into Oct low.
One thing to mention is I wont be holding any longs after end of this month!
Sep can produce a good crash, you've been warned!

SPX is in the target and maj resistance zoneNothing much to add since my most recent updates.
The price is in the target zone I had for a while now. Was expecting a good size pullback, never happened.
Im still in some trapped ES short, as well as RTY from Fri close and some SPY puts.
We got right into the Yellow dotted line I had for months now, its the main resistance line and right in our 4308SPX target zone.
Maj daily resistance is at 4308-35SPX
Maj support (and I expect it to hold) is at 4000-08SPX
Might stretch into 4930-50, but low 4k has higher chance in holding on the upcoming pullback.
As noted on the RTY chart, there is a chance we wont tag 200MA, too many are looking for one to get hit.
We should get some sort of pullback next week, how deep it will be, I dont know, but it can be quite fast.
Maj turn dates are the 16th and week of 29th, Im assuming that week will mark the high, might be lower high.
We have 9 unfilled gaps since Jun low, I expect those to get filled by Oct low.
Im expecting a double bottom or a marginal lower hit in to below 3450SPX zone before a good size rally into EOY.
Sep comes up as a panic month, I expect a good size reversal that month and it can get quite ugly in Oct.
I see some serious market movers Sep/Oct time, might stretch into Nov Midterm elections.
Those in power will do everything to rig it, so expect more international instability as well as something serious in the states.
Interesting and very dangerous times we live in.
Very important to gap down tomorrow to mark temp high.
Expect a counter trend next 2 weeks into week of 29th.
2 scenarios Im watching:
- top in main target zone of 4308-35SPX
- top at 4425SPX in case it wants to extend into mid of Sep

SPX quick updateNothing much I can add, but few things:
Lots of evidence of the market hitting the ceiling
- SPX is at 61.8 fib retracement, very important to watch
- Added a trendline off Feb 2020 and Sep 2020 highs, we are right at the resistance zone.
- Main target (4308-30) is getting close to hit with no 4th wave pullback but relentless grind in a C wave up.
- Weekly bullish reversal is only at 4385SPX on closing level, we are not going to hit it today.
- Daily is at 4308, same as the main target, also a gap to fill.
- MACD, RSI, Stoch etc are all in overbought territory, can last for several days more to hit that 4308+ target
- We have 9 gaps on the downside left, I expect those to get fill in Sep/Oct
- VIX is giving another long signal and sell to equities, need to watch the close below the Bollinger band to confirm
Im only day trading and have few ES under the water I m holding.
Will be short over the weekend with NQ, especially if we reverse into the close and close below the highs.
My internet is still very bad and technicians are only coming tomorrow end of the day, cant trade much in this environment but using my cell data for small trades

SPX bulls are backSPX500 has dropped 25% from its peak on Jan 22.
It has recouped around 14.5% loss and it is above 200 EMA.
The trend appears to have reversed. The market is in a bull phase now.
It is safe to be long if the market is above 4,200 levels.

SPX is at 100% extension still see the whole move as bear rally- VIX gave a long signal and short signal for the markets, same as we had on the 29th of July.
Tomorrow we have a directional change as well as Fri with clear low on the 16th. I would like to see a good move lower starting tomorrow or Fri and a gap down on Monday. Volatility spike on Monday supports my view on this possible outcome. And then reversal day on Tuesday with lower low in am and higher close then Monday to mark a temp bottom.
Im swing short both ES (under the water) and NQ AH's.
I did trade NQ and ES on the long side last night and woke up to some very nice gains, happy with seeing a good long setup last night. So my paper loss on the ES short was very well offset today, not counting every day day trading.
Im fine holding those shorts with no stop for now.
Can we extend, 100% we can if it wants too and my ideal target still seats at 4308-30SPX. Please note that we are supper close to my min target I had for second month now - 4225SPX (very close and I wont be upset that we wont hit it:). I didn't expect that we get there on a straight line with such low pullbacks, but we did. And I'm trapped with some swing ES short for second week now (which is fine with me as I day trade through the day with NQ and make all that paper loss back with both long and short trades, like I did from last night entry)
My downside targets are the same - 4012-28 and ideal 3992 and 3950SPX. All we need is to break 4125SPX
Important levels (on closing level) for tomorrow and rest of the week to watch are:
Support, Daily:
- Maj is at 4135 and then 4079 on closing level
- Air below 4079 all the way to 3860-70SPX and 3810-20SPX
Weekly:
- There is only one support on weekly level and its at 3636SPX
Resistance Daily
- Maj is at 4308SPX
- Air above 4308 all the way till 4460SPX!
Weekly Resistance is at 4385SPX
I will update NQ chart tomorrow, it was updated to those who are on my email list though.
Enjoy/Share/Like

SPX has broken 2 main supports todayIm watching 3992 and 3938-40SPX zone for a possible support zone by Aug 16th.
Should stay below the broken channel and gap down tomorrow

SPX500 OutlookHello there all,
Here's the SPX analysis outlook potential direction.
Please do let me know if you are seeing what I'm seeing or have a different perspective on it, I would love to see your analysis.
Please do drop the chart link below in the comment section.
This is not financial a advice. 🙂
Thanks all.

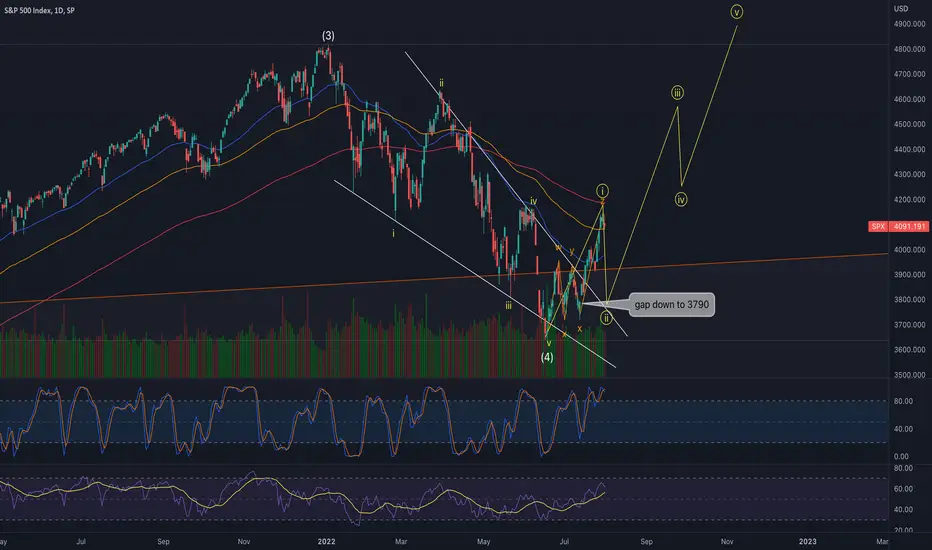
SPX500Seems like the perfect time to fill the gap down to 3790 retest the breakout of the leading diagonal and confirm wave 2 is what we want to see.
Pelosi in Taiwan today and China about to fail to start WW3 IMHO. ;)
SPX target for tomorrow is 4058-62Im looking for a low tomorrow at 4058-62 and ideally we stretch to 4012-4027.5 which I expect to hold.
My timing is showing a low on the 3rd (if we wont reverse tomorrow), then high on the 5th or 8th and low into the mid month.
That would mark the B wave and one more push into EOM, ideally we see 4330+

SPX weekend update
Im slightly short as of Fri close, not planning to hold for long, looking at other day to get in with swings.
Notes from the chart:
4308.5SPX is the main resistances now (must hold for continuation lower)
Resistance - 4158.50, 4160.2, 4177.60, 4168.80 (Maj) SPX
- Low target for tomorrow 4052, 4027 and Main support 4012SPX - Buy if seen in am, don't buy if we see higher first
- 3910 and 3943 are the maj support zone now
Buy zone for tomorrow with stops!
- 4012, 4027.50SPX
- 4000 must hold on any try or it falls apart and will get 50MA tested
Short
- 4154-60SPX, no short above 4175, going to 4216-25
- Low (intraday) was on Jun 17th;
- No current long position, only short
Old pathway still can be in play:
- rally for a week or 2 back to 4150-4205 SPX (we are here now), retest of 3890SPX or 3830by Mid Aug and then main target of 4330+ and possible 4425+ summer time
- Ideally extend to 4425SPX (4300 main resistance on the way up) summer rally target - 110MA
After revising my chart, there is a high chance we are in a 5 wave down pathway with 4 being almost over.
Larger ABC pathway down into Sep/Oct low as being just an A wave, B wave up to Jan high and C down to Apr low
Potential 5 waves down is forming! Next mid Jun low can be lower low! Came as a main low and possible 5 wave down is over and we are in a B wave up
Additional to add:
We did hit 110MA on Fri high and retraced, that target alone can be enough for this move and the price doesn't have to test 200MA in case of a serious bear trend.
There are 2 downtrend channels, either of them can be in play, those are visual on my chart.
- We have a high volatility going into the 4th Aug
- As well as from the 8th of Aug to 15th.
I'm expecting at least a temp high on the 1st or the 3rd, if was not hit on Fri .
Low mid month and another advance into the week of 29th on neg div .
After that expect a huge move down and my targets as of now are 3430 and 3455. There is a Fib fan confluence at the same levels
I really don't want to see lower, as if that happens,then we could be in a 5 waves structure into Q1 of 2023 instead of ABC move down.

SPX updated bear channelI did send this chart during the last trading hour yesterday to those who are on my email list.
I have revised the bear channel and it fits much better with the current price action as well as the fibs.
Im short here and looking to add if we see a double tap of a bit higher high, otherwise doing only day trading.
Its a weekly and monthly closing day today, so must watch numbers are:
- 4090.80PX on closing level for weekly continuation or rejection of the price.
- 3950.50SPX on closing level for monthly continuation or rejection.
If closing below the second number it will be a huge tell of much lower levels to come.
Closing above 4090 can bring the 4300 into play earlier then I thought and that would make me change the ABC pathway with Jun 14th being as a B wave.
Main supports are:
- 4060SPX
- 4002-10SPX
- 3939SPX
- 3890SPX
Im mostly off today, will do a weekend update only.

SPX Long, expecting closed all week highSPX closed at $3998.95 (Almost $4000) today. Expecting a higher close point between $4010-4038.
Watch for turning point -- but mostly followed with a pull back to retest 30F(Green) pivot ZG (higher support line around $3970), and move uptrend.
Red -- drop back into the consolidation area for more wave.
-- News -- in next 10-days Xi & Biden will have a meeting (video meeting?) We'll see whether supply chain issue will smooth a little -- If works, SPX go towards $4300s.

Last night updateCopy pasting of what I sent last night to those who are on my email list:
It seems the market is going to test 3965-80 zone after all. I was expecting it first part of July but it took time.
So some "wave slapping":
- My target is 4030, it can top at 4013-18 but it doesn't really matter - A wave (around 25-26th of Jul)
- Down to higher lows into 37xx zone (with possible overshoot into 36xx zone), where 3696-75 fits better - B wave (around 15th of Aug)
- C wave up into 4330 and the 200MA should be around that number when we should approach it, perfect fit for the count (late Aug, early Sep)
So the whole move should look like the move from Feb and Mar lows.
Volatility is set to rise from the 25th into early Aug
We have only 1 gap to close and 5 below, I think all will get filled
SPX gaps to close:
- 4017.81
- 3830.81
- 3800.91
- 3790.14
- 3674.85
Weekly resistance level is at 4090SPX
Monthly resistance level is 3950.50SPX
I do expect to close the month below the last number, closing above could shif the bearish outlook on longer term view.
So far I do think we will hit 32 handle at min with ideal erase the whole move of 2020 low and even retesting those lows. That would be the most bearish scenario and could last into 2024 instead of Q1 2023 as Im expecting now.
The level of importance tomorrow is - 3918 and 3911 on closing level. Below 3880 is the most important number, below it we should fall back into high 3700 territory.
So I expect this move to turn tomorrow and have 2 days correction and one more push into the 25-26th to finish up this move and fall into Aug 15th (or so) low. Then we should get a non stop rally Mar like back to the 4300 handle.

BEARISH ON SPY-currently forming a bearish rising wedge
-lower highs in supply zone from 385-393
- ultimately bearish since FOMC is 7/26-7/27 and J. Powell was considering another 75 BPS hike
-looking for a reject at 385 to then come down to retest 373 again
-crossover of the 20/50 SMA at 10:30 July 14-15 on the 4HR chart
IF SPY pushes above trailing resistance line from 393-383 then this bearish set up has failed
I will only swing a put if we close at 383.70 or under
Always trade your own plan ;)
Sincerely Kai D3 Trades <3

SPX longer term updateThis is a quick update with levels of importance.
I will update in more detail those who are on my email list, cant do it all.
So
I think we will see a really this week and I have 2 targets - 3880 and 3960-90SPX
Both are good for the lower lows to come sometime mid of the month, ideal bottom target is July 14-18th.
The top in 3960-90 zone actually better fit with expected by me 3500 test.
3500 is a very important level and failure of that level will get us to 3200 very quickly.
Off that expected low, Im expecting a good size rally, maybe a month or month an half (into end of Aug) all the way to 4300 and maybe even 4425SPX.
From there we will see either 3200 or 2900-2800 (depends on the July bottom 3500 and 3200 respectfully) sometime in Oct.
That low alone will be a one big A wave of the correction and the bigger B wave will go up into Jan and final low might come in Mar of 2023, unless its really extended and we wont see the low till 2024. But its too far out to speculate at this point.
So my this week trading plan is to exit longs at 3880 and it taken out re-enter to ride to 3960-90 zone and then I will be naked short for the trip down to 3500 zone.
If we lucky to see 3750-60 tomorrow, then I will be long for the trip to 3880 at min.

SPX setting a up a test of 3760, next is 35 for the EOM runIm back from my little trip. So far so good since my last update, we are going to test 3760 and ideally 35 today/tomorrow and then a run back to 4017-20 by the 4th-6th.
There is a chance we see 3500 sooner then later, so have to be very careful in sizing on any trade.
Im going to buy longs today starting from 3780 and 60 will add if we see 35

ES is at Bull/Bear lineES is at Bull/Bear line, hit 110 MA and 50% retracement. A real test of who is in charge is right here.
As well as ABC move up with perfect 100% extension hit on the SPX close.
Jumping over the 110MA and test from the above will be a good sign of continuation of this move.
There is also a possible fakeout to watch.
A perfect place for a pause of this move up and some retracement.
An ABC move up to 4017SPX or so is what Im looking for with A being done and we get to test 3730-40 zone before the continuation higher.
Ideally we see the whole move going into the 4th of July weekend!
Im slightly short as of close, kinda risky trade as this can just continue extending to 1.618
Will send a separate email with more charts to those who are on the email list.
Enjoy your weekend, lots of volatility is coming after the 28th, so prepare for huge moves both ways

SPX500 Rising Trend TARGET !!This analysis is for 1h so it's very dangerous.
Median is good for buy.
Target :
🎯 3779.16
Stop Loss Level :
🛑 3753.95
Not Financial Advice.
