S&P 500 ForecastS&P 500 moved towards the 3980 level as traders prepared for tomorrow’s CPI data meanwhile, the tech heavy NASDAQ Composite was up by 0.4%.
Today’s rebound is led by energy stocks. WTI oil managed to get above the $73 level as traders focused on the Keystone pipeline outage.
From a big picture point of view, S&P 500 continues to consolidate in the range between the support at 3915 and the resistance at 3975. RSI is in the moderate territory, so there is plenty of room to gain additional momentum after the CPI data and the Fed decision. If the CPI report shows that inflation is slowing down, the current consolidation will serve as a good base for an upside move. However, it should be noted that traders may remain somewhat cautious ahead of the Fed decision.A move below the 50 EMA, which is located near the 3915 level, may be interpreted as a sign of an upcoming sell-off. S&P 500 received strong support near this level, so traders may rush out of their long positions if this support level is broken
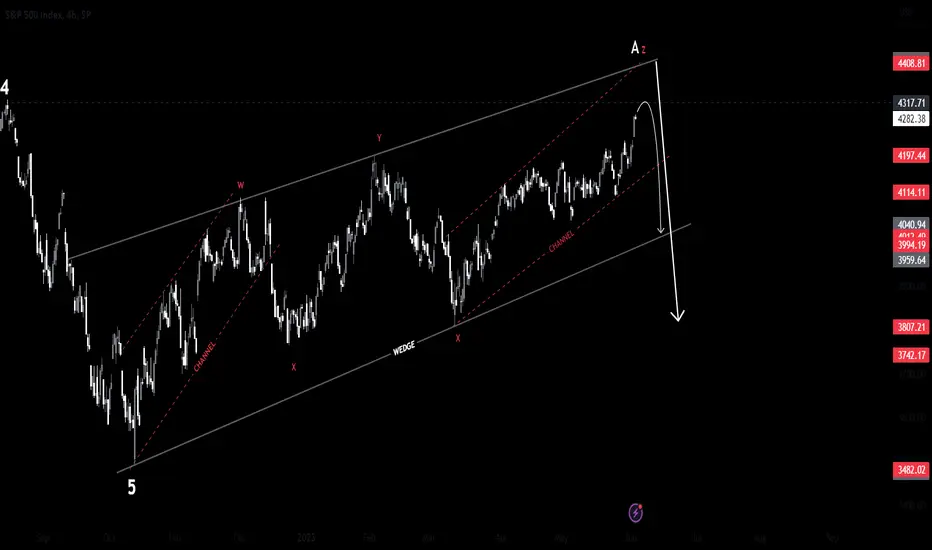
we still in down trend and we should break the yellow line and back 4100 level
The Fed is still playing catch up to tame rising prices after its protracted gross mischaracterisation last year of inflation as ‘transitory’ and its initially timid steps to withdraw monetary stimulus,
The world’s most powerful central bank is now confronted with two unpleasant choices next year, crush growth and jobs to get to its 2% target or publicly validate a higher inflation target and risk a new round of destabilized inflationary expectations. I think Rather than fall to 2-3% by the end of next year, U.S. core PCE inflation will probably prove rather sticky at around 4% or above.
Spxanalysis

Where to from here on SPXI posted this chart few weeks ago as a follow up to my short to show the few paths SPX is going to take after it begins the descent and SPX has followed the one where I explained about a break of the channel into the deviation below. please refer links below the description to look at my previous posts on SPX short idea.
The only difference is that this happened a bit slower than I anticipated, which makes this drop out of the channel less likely to be a deviation now.
As you can see, we are bouncing from the Support zone as I had highlighted in my previous post.
Which brings us to the question of where we go from here.
On The Daily TF we have first hints of a reversal or a decent size bounce from here, we have bounced from a key support and ended the day with right candle stick on the daily, but we need one more day of price action to confirm the reversal. If we get another green day without breaching the low, we are likely to head up.
But if we zoom in to 4h TF things become clearer.
Let's Look at the following chart:
On Friday we broke structure to the upside on 4h and created a strong low at 4336. That number is not random , Will cover this in the next chart.
If we get a pull back and break higher than Fridays high, we will get a full Change of trend on 4h TF. Once we do, we should be able to break all the 4h strong highs until we meet the Daily Strong high at 4502 which is what I think will be hard to break and we will get a strong rejection from there. From there we can do one of the two things, either come back down create a double bottom and try again to break the daily high at 4500 and continue higher. If not, we will continue the daily trend by breaking 4336 low and head lower.
Now let's look at why the price bounced from 4336. The following chart has the answer. If you know VPA, then you know price moves in ranges, just like candle stick patterns are fractals, Ranges can act like fractals as well. In the chart you can see There are 3 ranges R1, R2 and R3 that formed on this uptrend. R3 is the larger range that encompasses R1 and R2 and 4336 is the VAL of this bigger range and as Per VPA theory , price in a range keeps roughly bouncing between VAH and VAL of the ranges .If you look at the VAH of R3 it coincides precisely with the Daily strong high at 4500 which gives us another confluence for a rejection there into the Daily OB shown in previous chart.
Finally, if throw regular old fibs and Gann Fan into the mix we get additional confluence for a rejection at the 4475-4500 region as shown in the chart below. 4475 region is a Gann resistance and 4475-4500 0.5 to 0.618 region of the retracement.
Some Projections:
If we do get a move like the one, I have explained, i.e. move to 4500 area and reject, we will have few patterns emerge like inverse H & S and cup and handle. I have highlighted the targets if they mature. But always remember all these patterns are pure manipulation by large institutions to trap retail traders, it possible that there is a fake out into the pattern where pa comes to lower 4300s and then reverses from there can creating yet another pattern a Double bottom, so only trade confirmations based on market structure change.
Happy Trading App!!!

❗ IS THE S&P 500 READY TO REVERSE? ❗ 3.4.23 TRADINGVIEW IDEA ROC❗ I won't take too long with this so thanks for joining ladies and gentlemen. I know I haven't really done an SPX post myself in at least a few months but been thinking a lot the past few weeks.
❗ As the market currently is/my personal view, we are in a state of Extreme Greed overlall, virtually any stock or pick you go with goes up and a lot of market participants are making money, throwing that right back into stocks and the market. We've had the biggest price recovery to date the SPX has seen in years and it seems like nothing can stop us.
❗ But that's the thing. For those that understand extreme greed most often leads to things ending up overbought, ultimately resulting in reversals, big when we look at the market momentum through CNN's site which also includes the market's fear and greed indicator we can see how since the SPX regained the 125-day moving average in march how things have essentially rallied like no tomorrow sending us to
❗ Since November's bottom the SPX has risen about 30% which has been great of course and only driven even more once we exited that consolidation channel. If you look above at the main chart you'll notice two circles I've got there. Both mark the main resistance we've got at $4600 which seems to be keeping us held back and can ultimately lead to the start of a reversal as it kind of looks on the 30 minute with us already having lost that 200 day moving average. Here's the chart below.
❗ If resistance continues to hold up and SPX can't break 4600 I'd expect some kind of reversal to start in the least. I mean it's been so long since the SPX met up and touched it's 200 day EMA again, great as that's been we have to meet up with that dude at some point or another. Not to mention we've basically been in an ascending channel up the past few months. Everything's come up pretty quick amongst all the positivity from the news, market driving traders. But I personally feel the market may have priced in a lot of stocks already.
❗ I mean we're seeing many stocks form record high's and some facing resistance at their resistance points much like the SPX is right now. I'm not saying everything's going to fall and reverse, but we can't simply keep on going up like we have been the past few months, the more we do the more we risk falling back harder without healthy retracement.
❗ Don't want to keep this long so I'll end it at that but please let me know opinions and share any ideas below, I'm trying to wrap my head around a lot of stuff but overall just have the gut feeling the market's overbought on a lot. I won't mind if I'm wrong of course but if I'm right I'll take the opportunity to use some cash reserves and reenter into some positions and possibly crypto's depending on the viability/ use case.
❗ That's all for this idea, I have to move on to my XRP idea and work on that so thanks for joining, feel free to leave any likes or follows, always helps me out, thanks.
~ Rock '

SPX500 Next MovePair : SPX500 Index
Description :
Bullish Channel in STF and LTF as an Corrective Pattern
EXP FIAT
Daily Resistance Level
Divergence
Break of Structure
Completed "12345 " Impulsive Wave

Bing Short on SPX in progressIn my previous post on SPX ( link attached below the description ), I explained how we are going to see a rejection on this uptrend soon and we beginning to see that now.
In this post I will explain how I am playing this short setup.
In the previous post I had a pitchfork. I simplified it with three parallel channels, one larger and two inside it in its upper and lower half so we now have four rising trendlines which will be our point of interest when Price Gets there.
In the image below I have highlighted the properties of these trend lines based on past price action within the channel, which you can observe yourself.
I have indicated three take profit levels on the main chart. I don't think TP1 would be necessary as I don't expect the trendline to hold based on its past behavior.
TP2 and TP3 are my main targets, which is where I will look for signs of a nice bounce back up.
If you observe the channel, we have never really resumed a trend back up without creating a double bottom on the one of the lower two trendline in the chart as highlighted in the image below, if that happens, we resume the uptrend to new highs. That's when you take a swing long position on SPX.
On the other side if TP3 doesn't hold we are looking at a potential change of trend a macro scale, but I won't give up on the upside just after the break as we could possibly see deviation and bounce back in the channel after testing the support area as highlighted in the main chart.
What happens if we lose 4300 level, we go way down, I will leave that detailed analysis for another post.

SPX500 Next MovePair : SPX500 Index
Description :
Bullish Channel as an Correction in STF and LTF
Divergence - RSI
Break of Structure
Completed " 12345 " Impulsive Wave and " ABC " Correction
Consolidation Phase

S&P500 hits target, Time for a correction?The S&P500 has hit our first target a couple of days ago. Now the price is at the lower level of the resistance zone. This could mean that a correction is due.
I believe that the resistance will be either broken or held at the end of the week. In this case, the most likely scenario is that the resistance will hold, and that we'll see lower prices for the upcoming weeks.
This post gets invalidated the moment the lower resistance level breaks.

Dow Jones forming a Bullish IHS PatternAfter the Fed came up with the interest rates pause look at the chart of Dow Jones on weekly TF.
It is forming a Bullish Inverted Head & Shoulders Pattern.
Look a new ATH

SPX 500 Analysis(Rising Wedge Pattern)!SPX 500 Analysis on Weekly Timeframe!
Rising Wedge Pattern in SPX500
Rising Wedge Pattern Formation after a Strong Downtrend
SPX500 was in downtrend before now we are seeing a temporary uptrend but if we observe carefully it is an unstructured uptrend, for trend reversal it has to break 4323.56 level. Now SPX500 has formed a Rising Wedge Pattern. This pattern formation happened after a long down move. Now SPX500 is taking a pause and trading inside a wedge. If SPX500 able to break Support Trendline then the Primary trend will continue which is a Downtrend. I have done all important Analysis on the chart. I hope this will help you to forecast the further direction of SPX500.

SPX medium term pathwayThis update will be quick, Im very lazy this weekend.
ES short term was already posted earlier today.
There are 2 pathways Im following:
1 - H&S pattern, visible on the chart. That pattern if triggered will make full 5 down into early next year low to finish the whole move down from Jan high.
(Fits perfectly with VIX sky rocket from its below 20 level)
2 - Finishing the C wave up with A being over and B about to start.
Im still looking for 3750 level being hit to close the gap and one more rally over 4200 from there.
This scenario should play out quick or I will take it off the list if B is not reached by mid Dec.
Then a good rally into Jan high above 4200, check the number of the C ending on the chart.
Fibs align perfectly with this pathway!
We have a full Moon on Dec 8th, usually markets tend to make a high or a low at or around the full Moon.
It seems we are going to get one here early next week.
My best pathway is down to 4k tomorrow and rally from there into Tuesday high. There is a huge SPY put wall at 400 for tomorrow, Im sure it will hold on any test tomorrow, so if tested it will be a perfect long entry with a 15-20 points stop.
Or if 4k is broken then we should see 3940-50SPX zone tested which is the strongest support for the whole bull move here, should hold on at least 2 tests imo.
Also VP (volume Profile) line is around 3960SPX level, a perfect magnet.
So my next week game plan is - buy tomorrow low, sell Tuesday high (might stretch to Wed am high), then down we go into a rabbit hole with ideal target at 3745-50SPX.
Main bear bull support line is at 3940-50SPX level for the next week! Below it and this move up is over and the price will retrace back to 3750.
Have a very profitable week!

SPX Must hold 3970 tomorrow am or its goneAs you can see there is a lot of confluence at 3970 level (This chart become quite busy with the trendlines)
If we do gap down tomorrow below 3970, I will be looking to buy 3928-39SPX level for a broken trendline test, if not more.
This chart is similar to the ES, but has a higher level of support, so they have a bit different short term look one from another to my eyes, but the main picture is the same.
I really dont have much of a support if 3890-3910.50 is gone till 3744SPX!
So it better hold that level and ideally the 3928-39SPX support box.
Same as the ES, SPX has its trading cycles bearish now, expect short the rips all the way till the 19th of Dec!
Have a good night

SPX500 Next MovePair : SPX500
Description :
Completed : Impulsive Wave " 12345 " and Corrective Wave " A ( 12345 ) " Corrective Wave
Impulse Correction
RSI - Divergence
Break of Structure
Bullish Channel in STF as an Corrective Pattern
Consolidation Phase
S / R Level

SPX500 New Week Possible MovePair : SPX500 Index
Description :
Bullish Channel in Short Time Frame and Long Time Frame as an Corrective Pattern
Break of Structure
RSI - Divergence
SMC - CHOCH
Completed " 12345 " Impulsive Waves
Fibonacci Level - 38.20%
💥SPX 4H-TIMEFRAME ANALYSIS💥 S&P 500 INDEX SPX 4H-TIMEFRAME ANALYSIS
💗Hello ladies and gentlemen
This is my new idea for 💥S&P 500 INDEX
I hope my idea is clear
Support me by like and share thank you
Stay Safe💯💲💲💲
Good luck💰😍

The S&P 500 Death BedIn this analysis, we explore the potential consequences of a US debt ceiling default on the S&P 500, one of the most widely followed stock market indices. We believe that if the debt ceiling issue remains unresolved, we could witness a significant downside in the S&P 500, comparable to the crisis experienced in the US economy in 2008. Our analysis suggests a selling zone between 4,154.77 and 4,290.49, with an initial target of 3,090.41 and a final target of 2,034.79.
1. The US Debt Ceiling Crisis:
The US debt ceiling refers to the limit on the amount of debt the US government can incur. Failure to raise the debt ceiling can lead to a default, causing significant disruptions in financial markets and a potential decline in investor confidence.
2. Historical Parallels:
Drawing parallels to the 2008 financial crisis, which triggered a major downturn in the US economy, we anticipate a similar scenario if the debt ceiling issue remains unresolved. Such a crisis could have a substantial impact on the S&P 500, potentially leading to a significant downside movement.
3. Selling Zone and Potential Targets:
Our analysis identifies a selling zone between 4,154.77 and 4,290.49. This range represents a critical area of resistance and selling pressure for the S&P 500. Traders should pay close attention to price action within this zone as it could provide valuable insights into market sentiment.
Regarding potential targets, we project an initial target of 3,090.41. This level represents a significant decline from current market levels and aligns with historical support levels. Our final target is set at 2,034.79, signifying a more substantial downturn in the event of an extended debt ceiling crisis.
4. Impact of Debt Ceiling Default:
A debt ceiling default scenario could result in a loss of investor confidence, increased market volatility, and a potential flight to safe-haven assets. These factors, coupled with concerns about the US economy, could significantly impact the S&P 500 and contribute to a potential deathbed scenario.
While it is important to note that this analysis is based on the assumption of a debt ceiling default, traders and investors should remain vigilant about the potential risks associated with such a scenario. The S&P 500 death bed analysis suggests a selling zone between 4,154.77 and 4,290.49, with initial and final targets at 3,090.41 and 2,034.79, respectively. Traders are advised to exercise caution, implement appropriate risk management strategies, and closely monitor market developments to navigate potential challenges and capitalize on opportunities.
Disclaimer: This analysis is for informational purposes only and should not be considered financial advice. Trading involves risks, and traders should conduct their research and analysis before making any investment decisions.

spx500 Analysis Hey guys Looking at spx500 we can see we have some Solid Market Structure in play with some in effeciancies regarding price action and its left behind some imbalance or (gaps) in the market and we may see price action start to fill these gaps
now just because a gap has been created doesn't mean that its going to be filled there after it was created... price may take hours/days/ weeks or even Much longer to revisit these areas and mitigate the Gap
now from what we are currently seeing, looks like we're starting to see price reject somewhat here With the structure we have recently created and/or respected ( Please Check my Analysis for Possible Trade ideas
Disclaimer - past profits don't guarantee a future result... trading is risky and one can loose some or all of their trading capital!
Disclaimer - information shared is for educational and demo purposes only!!

ATTENTION: S&P 500 - Medium Term Right Side is DOWNTechnical Analysis:
- S&P is going to finish wave ((B)) in black in the next 2-4 weeks
- Short Term Right Side (H4) is turning up
- Medium Term Right Side is down to complete a wave II in red
Technical Information:
- Don't buy now S&P if you're a swing trader
- If you're a position trader please wait for wave II in red to be completed

SPX 500 New IdeaPair : SPX500 Index
Description :
EXP Fiat in Long Time Frame as an Corrective Pattern and Completed " ABC " Corrective Wave
Divergence
Break of structure
Completed " 1234 " Impulsive Wave
EXP Fiat STF
CHOCH - SMC

Bearish Harmonic pattern in SPXSPX price chart has printed a bearish harmonic pattern along with a bearish divergence on RSI which indicates trend may reverse from bullish to bearish if the support level of 4060 is broken.

S&P 500 reaching next resistanceHello traders, I am expecting such a move from S&P 500 in Long term 1d time frame which is indicated in the chart above...
hope y'all enjoy trading <3

$SPX at consolidation pace.$SPX currently trending at consolidation paste. No strong catalyst for monday for market to pump
but the momentum looks strong for bullish continuation.
1 hour & 4 hour chart the RSI at the overbought level.
expect a pull back soon. for now just ride the trend.
below is my price level for SPX calls and puts.
Calls: buy above 4143.30 sell at 4180.26+
Puts: buy below 4068.79 sell at 4008.24 or below
=================================================================
SIDE NOTE:
- make sure that you setup a price alerts on those key level so you wont miss the move.
and always to take your profits as you see one.
- sometimes, the fist 30 minute after of the opening bell is always volatile.
is either you can catch the move there. or wait for an 1 hour for better or cheaper price.
- as always if you have any question feel free to leave me a comment here.
if you're enjoying my ideas please don't forget to follow me or hit the like
to boost the post. thank you guys and see yall soon.

SPX | Bearish ABCD PatternWait for the price to rejected from the potential reversal zone ( PRZ ) its is likely to reverse the trend from point D and divergence should be formed to reverse the trend. Trade plan is mentioned in the chart. Manage your trades accordingly.

DeGRAM | SPX500 shortSPX is near the major resistance level and a psychological level of 42,000.
The market is consolidating on the daily timeframe .
Notice, how the price pulled back from the resistance in previous testing.
Price action created a bearish harmonic pattern .
We anticipate further consolidation and a rebound.
-------------------
Share your opinion in the comments and support the idea with like. Thanks for your support!
