Spxshort

Critical Move For The Markets. (SPX)We are watching this compression point currently under this horizontal Resistance level.
Paying attention to the upward support that we are approaching after breaking our first price average as the candle crosses over the black line.
We hold that as bearish movement.
Would like to see it crack and have a nice Retracement.
50% short. Playing roughly 3% stop-loss, we will stay on top of it and see how she wants to move.
Have an awesome trading week! Cheers. ✌😁✌

#SPX SHORT.. We see head and shoulders pattern in daily chart of #SPX, also ma10 and ma20 turned their directions to negative.. We can easily say that there are some bearish signs for #SPX.. It is likely that the price will go down.. We will wait and see..
Disclaimer: Please do your own due diligence when it comes to forex-trading.. Invest at your own risk..
I wish you all the best..

#SPX ANALYSIS.. We see head and shoulders pattern in daily chart of #SPX, also ma10 and ma20 turned their directions to negative.. We can easily say that there are some bearish signs for #SPX.. It is likely that the price will go down.. We will wait and see..
Disclaimer: Please do your own due diligence when it comes to forex-trading.. Invest at your own risk..
I wish you all the best..

Bearish Bat #2We are looking like retesting 200MA as support flipped resistance before we head back down.

It all comes down to this point - the battle for 2900.We are approaching an exciting moment. A big battle in the far right corner, with SPX retesting the support line it broke out from last week, and meanwhile finding support on exactly the same level on the trendline going from the low late march to the recent low’s early may. A downwards trendline. An upwards trendline. Colliding.
And that exactly on the 2900 level. How is it possible? I don’t know.
Where will it go? No clue.
Should we step in if it breaks out? Hell yeah.
The battle of 2900.
This is the moment that waiting is more important than action.

SPX / SP500 - Inevitable collapse incoming...Price is floating around the highlighted area, once broken it will fall to highlighted support or even lower
Divergence is spotted on weekly / monthly and daily... Market Collapse in bound.. ;)

ES heading down to 2500s?The big picture clearly shows that ES could not get back into the trend. We can expect sharp down movements. I have market the middle of the trend line on the chart. That's the most important support.
Disclaimer: This is not a financial or investment advice.
Remember to follow me
Stay healthy, Trade safe...
Atilla Yurtseven

S&P Extended wave v Rally Facing Significant resistance The S&P extended wave 5 should be at least equal to the price distance from the beginning of wave I. The maximum length of the 5th extension should not exceed the 261.8% retracement of the length from “0” formed in March 20th at the level of 3373.

SPX/USDHI
SPX / USD will hit its resistance line and will move towards the specified arrows.
And it's the best time to get into a deal
FOLLOW ME FOR LOOK MORE ANALISES
GOOD LUCK

SPX500 SELL SIGNAL Hey tradomaniacs,
welcome to another free trade-plan.
Important: This is meant to be a preparation for you. As always we will have to wait for a breakout and confirmation.
Market-Sell: 2796,00
Stop-Loss: 2830,00
Target 1: 2759,00
Target 2: 2727,00
Target 3: 2680,00
Stop-Loss: 34 pips
Risk: 1-2%
Risk-Reward: 2,57
LEAVE A LIKE AND A COMMENT - I appreciate every support! =)
Peace and good trades
Irasor
Wanna see more? Don`t forget to follow me.
Any questions? PM me. :-)

9-day EMA in the Put/Call ratio is in no man's land9-day EMA in the Put/Call ratio is in no man's land

Bearish Bat - ShortBearish Bat Pattern.
Parabolic Sar flipped to sell.
Fisher Transform indicating sell.
Fundamentals - speak for themselves.

#SPX - One high came finally #spx500usd #S&P500A high with a break of the 2,830 mark came after all.
61.8er return was not reached so far.
Encircled red A = Encircled red B
RSI is turning down.
EWO also decreases.
CRV = 5.5 to 1 for 36 days is very good.

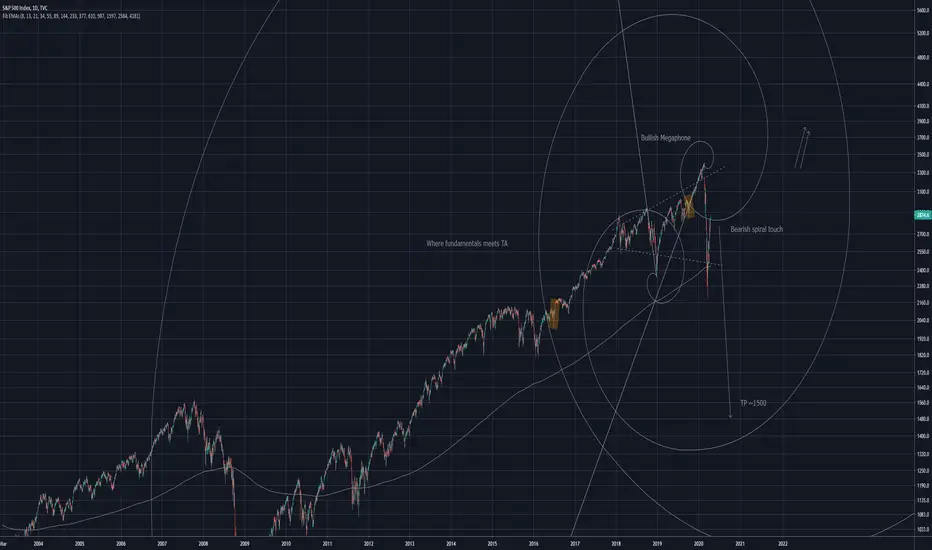
SPX Too good to be trueIt seems too good to be true! a bullish megaphone has emerged amidst all this chaos. This is where TA and fundamentals clash. Or do they?
As you can see the Fibonacci spiral provides sufficient resistance for a large drop. With the price gapping over the spiral!
I believe this to be one of the biggest bull traps i've seen.
I highly DOUBT we will see a follow through of this bullphone and a collapse is next.
Top Could be in Place in the S&P 500Top could be in here at the 1:1 extension confluent with the ML of the channel and the 2-year key horizontal level (around 2875). Notice that the C of the Y would be short here, like the C of the W. We are just below the GZ. We are drifting away from the ML of the PF. Nice 4H bearish divergence. Lets see what happens before the close.

S&P 500 INDEX (SPX) WeeklyDates in the future with the greatest probability for a price high or price low.
The Djinn Predictive Indicators are simple mathematical equations. Once an equation is given to Siri the algorithm provides the future price swing date. Djinn Indicators work on all charts, for any asset category and in all time frames. Occasionally a Djinn Predictive Indicator will miss its prediction date by one candlestick. If multiple Djinn prediction dates are missed and are plowed through by same color Henikin Ashi candles the asset is being "reset". The "reset" is complete when Henikin Ashi candles are back in sync with Djinn price high or low prediction dates.
One way the Djinn Indicator is used to enter and exit trades:
For best results trade in the direction of the trend.
The Linear Regression channel is used to determine trend direction. The Linear Regression is set at 2 -2 30.
When a green Henikin Ashi candle intersects with the linear regression upper deviation line (green line) and both indicators intersect with a Djinn prediction date a sell is triggered.
When a red Henikin Ashi candle intersects with the linear regression lower deviation line (red line) and both indicators intersect with a Djinn prediction date a buy is triggered.
This trading strategy works on daily, weekly and Monthly Djinn Predictive charts.
This is not trading advice. Trade at your own risk.

Don't Ignore This Clean Bullish Alternate in SPX FuturesBelieve it or not, this is the cleanest count in the S&P 500 futures. The second W2 didn't even reach the 0.236 which is quite doubtful, especially below such a potentially strong resistance. Are we hyper bullish? I don't think so but this market is capable of anything and may want to pump at each pretext (covid19 vaccine rumour like last night, tweet, etc.). Of course, these must not impact our technical approach.

One Final Push in the SPX?The Elliott wave micro count is getting very tricky and not ideal. Within the suggested upward corrective structure here, we can see a clean impulse coming off the low, followed by a flat. The third move is composed of 7 subwaves where we should expect 9 to complete this pink submicro ABC up.


Every MAJOR Market Cycle! (SPX)Symbol: SPX
Open your eyes this could just be the beginning of a new disaster.
----------------------------------------------------
Want to level up your trading skills?
We just realesed our new course! Follow our tradingview page and visit the link in our bio if you are looking for new strategy to add to your arsenal.
Also checkout our trading indicator available in the link on our page.
---------------------------------------------------
Thank you for your continued support, God bless.
- Major League Trader

SPXU long SPX short I am looking to use this as a way to fade the recent rally. Will update manually when I close trade, I may be in a bit early, we shall see.

