SPX, welcome to new recession. Dear Gamblers,
I never thought I would make such statement, but I have reasons to believe that coronavirus have just triggered the new recession.
Prepare yourselves, this is gonna be painful.
Nobody likes to wake up from "the way overvalued market" but it is like it is.
Strategy:
You can choose whether to say in cash, buy bonds (preferably treasuries) or just short. Bear in mind though that shorting for long periods is expensive, be aware of the fees you will face.
I will be shorting SP500 with an INVERSE ETF from 2830 that will be my entry point with stop loss at 3500. This is a risky play, for more conservative investors i would reccomend the two above.
I am projecting a 3-4 year crysis. Bear in mind that will be huge, you just have to look governments debt compared to the growth.
TIPS TO SURVIVE: Finish soon to pay all your debts, this will smooth the hit.
Stay safe,
BeniGo
***I am not your financial advisor neither I intend to be, do your own research before puting your money at risk***
Spxshort

S&P500 the BIG pictureThe peak of the flu will be around end of May after that with some positive data and everything priced markets will rally for the B wave and after US elections when the virus will be back we going for the last and biggest dive

$SPX 200-week average is a 20% drop from the top200-week moving average is 2640. Will be a little higher each week. Currenty implies 22% drop, may well be 20% by time it is reached. Dec 19 panic exactly hit the 200W. Also very close in Jan 16.
Good news will stop this, but if there is none, there is your bottom.

SPX reversed from resistance, potential drop!
SPX reversed off its resistance at 3134.6 where it could potentially drop further to 2751.5.
Trading CFDs on margin carries high risk.
Losses can exceed the initial investment so please ensure you fully
understand the risks.

SPY / SPX short. Are we in corrective C wave? Or larger A wave?Some possibilities I'm preparing for:
We finish wave 5 in the wave C down. Then we bounce from there into a wave 1 up.
Or this whole down move is part of a larger A wave down, which means there's a lot more left to fall.
I'm kind of thinking the latter, but time will tell.
Either way, I'm expecting lots of volatile moves up and down, so I'm managing my positions very closely. Lots of risk but lots opportunity! Good luck everyone.

SPX map for next weekMay be wrong, but has the right "look" right now. Today, the 4 wave correction threw me off. I don't think the C of 4 is finished, so I'm expecting monday to open green, fill the gap, and then fade for the day into the close. Median line is the target, would be great if the trendline and median line work as shown.
Good Luck!

SPY / SPX - C wave down?I think we finished the B wave up, which was 50% of the A wave down, but it might bounce up a bit more.
Then there's the C wave down, which will probably be 100% of wave A, but you never know. It could be truncated or more likely, extended. The Fed is meeting Mar 18 so I think that timing lines up for the end of wave C.
Thoughts?

SPX ?Further downside potential.. May be bias with my view on cryptocurrency, but chart doesn't look great for a rebound continuation. Lets see what happens. Target is Poo EMA. Again if you want to go long its always great to head in at these lower prices and not focus on short term changes in price, as history has proven that this market is extremely bullish in the long term.

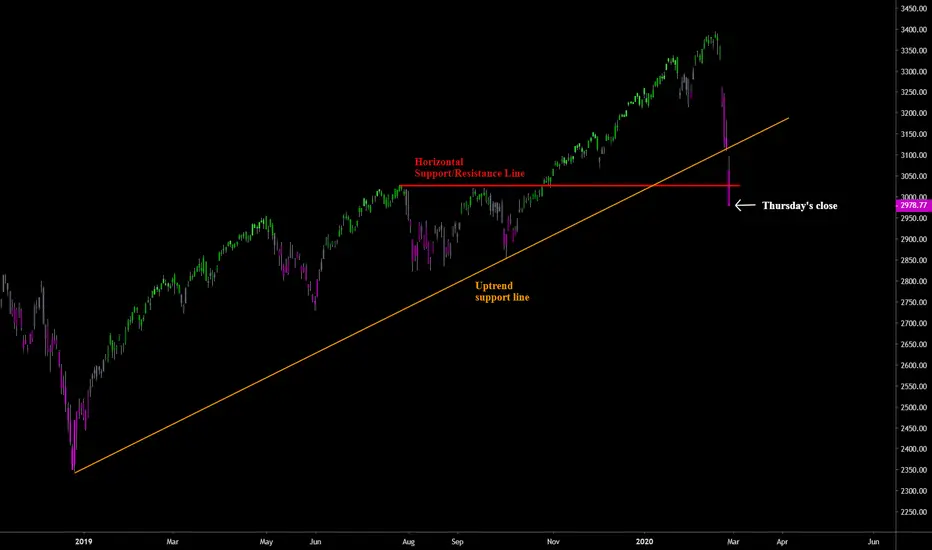
SPX Fails Two Support LinesToday the S&P 500 opened at $3,062 and closed at $2,978 for a -4.4% loss in one trading session and its largest one-day decline in the current pullback from all-time highs last week. Other indices, such as the DOW Jones, saw its largest 1-day decline in history, it's fastest 10% drop in history this week, as well as its worst 6-day performance since 1928, just before the Great Depression.
I prefer charting the S&P 500 due to it being a gauge of US economic health as well as it being a more reliable indication of how the overall stock market is performing since it tracks more stocks than the DOW, which is comprised of only the top 30 stocks trading on the market while S&P 500 tracks the top 500.
As for the S&P 500 price move today: after holding at the orange uptrend support line on Tuesday and Wednesday price fell below it today and reached the red horizontal support line that I've pointed out as a likely target in previous SPX charts this week. Not only did price reach the red line, but price closed below it which shows the level of bearishness from traders over Covid19 fears; what should have been a level where dip-buyers stepped up to bargain-hunt simply did not manifest. Price pushed lower into the close after briefly attempting to rise mid-day and ended up closing at the low of the day which is bearish and usually an indication of further losses to come on the next trading session(tomorrow).
Price has now failed to hold above two key support levels which is further indication of just how bearish traders are right now. Normally you would see some kind of bounce, or relief rally, but all attempts to buy this market are swiftly being wiped out by fearful sellers and rightfully so.
I'm waiting for the weekly close tomorrow before writing up a more detailed analysis of the market, but considering the moves in prices this week and the deteriorating Covid19 outlook, it's safe to assume that barring some surprise interest rate cut from the Federal Reserve markets will likely be taking another dip.
If all hope of a market rebound is resting on Covid19 conditions improving, here are some recent items of news showing that the situation is getting worse, not better:
8,400 people in California are being monitored after commercial flights:
www.marketwatch.com
Northern California reports first case of Covid19 not tied to travel:
www.livescience.com
700 people in New York being monitored for possible Covid19:
www.msn.com
California's UC Davis sends exposed workers home:
www.modbee.com
Trump administration considers using Defense Production Act to expand manufacturing of protective masks:
www.reuters.com
Netherlands confirms first Covid19 case:
thehill.com
Iran's vice president has contracted Covid19:
thehill.com
Saudi Arabia halts travel to Mecca:
www.aljazeera.com
Pope Francis sick a day after supporting Covid19 sufferers:
nypost.com
CDC waited days to test California's latest 'Mystery' patient for Covid19:
www.nytimes.com
I don't foresee many traders wanting to buy tomorrow and hold over the weekend given the news cycle this week and the obviously deteriorating Covid19 situation.
When Is The Next Stock Market Crash?First of all, I have zero financial knowledge. I am not educated and finance is not my profession. I barely understand your language. I'm only a technical guy.
Looking at charts, I have predicted some possible targets of the next stock market crash. The worst scenario begins around $2600's. Hopefully this never happens. Maybe there's only 1% probability or maybe less. According to my analysis, S&P 500 is more likely going back $2600 any time sooner. And i think AMZN will crash more than 50%
Not all my predictions are accurate. Nobody is 100% accurate. But, what if I'm right? Are you ready for that?
Here are my targets
S&P current price: $3103 / 04-Dec-19
1. 3090 - Already hit and please ignore this
2. 3045 - 1.87% / 01-Nov-19
3. 2925 - 5.73% / 10-Oct-19
4. 2845 - 8.30 / 26-Aug-19
5. 2670 - 13.95% / 30-Jan-19
6. 960 - 69.0% / 23-Jul-09
Disclaimer: This is not financial or investment advice.
Trade safe,
Atilla Yurtseven

Corona Virus UpdateLet's check how fast it comes. Or not but it somehow is showing a lack of strength.
What are your thoughts?
Thanks.

SPX 2h, possible ending wave 5 up in wedge now ?SPX 2h, possible ending wave 5 up in this wedge now ? Still possible for an overshoot >> 3400 (like an magnet), and then quick drop, from there, but we don't know yet, if and why it should happen. Wait for those first reactions, and then move for a position. China-virus-fear, will beat any repo now... my belief.
Bear dvg also in several TF's now, in this position... SMOO MOMO -indicator.

SPX bounced from support, potential for a further rise!
SPX bounced off 3304.75 where it could potentially rise further to 3367.99.
Trading CFDs on margin carries high risk.
Losses can exceed the initial investment so please ensure you fully
understand the risks.

SPX --Short the Madness for correction TVC:SPX TVC:SPX TVC:SPX
This could very well just keep on going, but imo its time for some correction first

SPX to climb from upside confirmation, potential bounce!
SPX to climb from its upside confirmation at 3305.65 where it could potentially bounce further to 3364.42.
Trading CFDs on margin carries high risk.
Losses can exceed the initial investment so please ensure you fully
understand the risks.

SPX reversed from resistance, potential drop!
SPX reversed off its resistance at 3306.05 where it could potentially drop further to 3257.90.
Trading CFDs on margin carries high risk.
Losses can exceed the initial investment so please ensure you fully
understand the risks.

SPX bounced from support, potential for a further rise!
SPX bounced off 3257.90 where it could potentially rise further to 3306.05.
Trading CFDs on margin carries high risk.
Losses can exceed the initial investment so please ensure you fully
understand the risks.

SPX to climb from upside confirmation, potential bounce!
SPX to climb from its upside confirmation at 3257.90 where it could potentially bounce further to 3306.05.
Trading CFDs on margin carries high risk.
Losses can exceed the initial investment so please ensure you fully
understand the risks.

SPX to climb from upside confirmation, potential bounce!
SPX to climb from its upside confirmation at 3257.9 where it could potentially bounce further to 3306.1.
Trading CFDs on margin carries high risk.
Losses can exceed the initial investment so please ensure you fully
understand the risks.

SPX to climb from upside confirmation, potential bounce!
SPX to climb from its upside confirmation at 3257.9 where it could potentially bounce further to 3306.1.
Trading CFDs on margin carries high risk.
Losses can exceed the initial investment so please ensure you fully
understand the risks.

SPX to climb from upside confirmation, potential bounce!
SPX to climb from its upside confirmation at 3257.9 where it could potentially bounce further to 3306.1.
Trading CFDs on margin carries high risk.
Losses can exceed the initial investment so please ensure you fully
understand the risks.

SPX to climb from upside confirmation, potential bounce!
SPX to climb from its upside confirmation at 3257.9 where it could potentially bounce further to 3306.1.
Trading CFDs on margin carries high risk.
Losses can exceed the initial investment so please ensure you fully
understand the risks.

SPX potential reversal!
SPX expected to rise up to 1st resistance at 3257.9 where it could potentially react off and drop down to 1st support at 3155.6.
Trading CFDs on margin carries high risk.
Losses can exceed the initial investment so please ensure you fully
understand the risks.
