SPX to climb from upside confirmation, potential bounce!
SPX to climb from its upside confirmation at 3257.9 where it could potentially bounce further to 3306.1.
Trading CFDs on margin carries high risk.
Losses can exceed the initial investment so please ensure you fully
understand the risks.
Spxshort

SPX to climb from upside confirmation, potential bounce!
SPX to climb from its upside confirmation at 3257.9 where it could potentially bounce further to 3306.1.
Trading CFDs on margin carries high risk.
Losses can exceed the initial investment so please ensure you fully
understand the risks.

SPX potential reversal!
SPX expected to rise up to 1st resistance at 3257.9 where it could potentially react off and drop down to 1st support at 3155.6.
Trading CFDs on margin carries high risk.
Losses can exceed the initial investment so please ensure you fully
understand the risks.

SPX potential reversal!
SPX expected to rise up to 1st resistance at 3257.9 where it could potentially react off and drop down to 1st support at 3155.6.
Trading CFDs on margin carries high risk.
Losses can exceed the initial investment so please ensure you fully
understand the risks.

ridethepig | SPX 2020 Macro MapMarkets closing down for 2019 right on time for the 3254 target, focus is now shifting towards event risk positioning into 2020 and participants seem happy to play the reflationary trades. This is an interesting swing to track with US election flows providing the ebb and flow.
The flows will now reflect in a lagged currency move with the Year-End repo funding. Smart money is on the back-foot since the crisis from September, the recent spike in DXY is coming from markets pricing another year end spike in funding tightness:
There is far better bang for your buck than buying US Equities at these levels, markets trading the final stages of an exuberance leg from the Phase 1 agreement and UK election tail risk and starting to run out of steam. This chart highlights only 4 times in the past 30 years has the US 2's vs 5's curve inverted whilst being in an upward moving yield environment, via Fed QT.
As usual thanks for keeping the support coming with likes, comments, questions and etc! Feel free to jump into the conversation in the comments with your views/charts.

ridethepig | SPX Market Commentary 2019.13.12An end of year update for US Equities with valuation targets at 3240/54 I am tracking for an overshoot into the 3200 handle to sell into. For those tracking the current flows, the most important chart I have been showing to all clients is the 2s 5s curve:
The major top in USD will help for a few months at most, as soon as we enter into the next chapter in the economic cycle it will be too little too late. With tail risks making positioning very tricky, here we have a very good macro chart showing the high bar for any growth shock and how it weighs heavy on risk appetite.
All year long expectations around monetary policy easing have been in the driving seat while geopolitics shouts loudly from the sidelines. The protectionism we are seeing is already starting to show effects on global growth and with a soft backdrop the exposure to these shocks enhance.
Rotation is in full swing as we see large large hands move from equities to bonds, and from higher risk credit to lower risk, we naturally are seeing a rotation from cyclicals to defensives and finally into safe havens like Gold, Yen and Swiss Franc to a lesser extent.
The map is clear that we are still yet to have a relative breakout in Cyclicals vs defensives as shown below:
With Yields miles ahead of the moves lately we are approaching a major breakout in US banks, a relative breakout here of the downtrend will be significant going into year-end.
On the FX side, USD devaluation will help and yields finding a floor indicate smart money is turning the titanic. It should now be a matter of 'when' rather than 'if' Utilities are going to breakout assuming we do not get any major updates on the impeachment front. Defensives still look relatively strong, despite technical patterns starting to top in things like Consumer Staples:
Lastly the infamous Long Term Consumer Staples Chart:
Thanks all for supporting these ideas with likes and jumping into the conversation with your ideas and charts in the comments. Good luck those trading US Equities into year-end and positioning for 2020, we will update the chart as we go through the coming weeks with a technical dissection of 2020 flows and targets.

SPX500 selloff PENDING to 3070 *history repeats itself* MID-LONG WHEN IN DOUBT, ZOOM OUT!
ON the SHORTSELL we're looking at possibility 1-2 (maybe even 3 ATHs on SPX500 index) to follow suit -- a consolidation in what is/will be a a continuation of this bullish priceaction we've been seeing; the same I've been calling for since the start of Q4 yet we are almost at the apex, the mountaintop is approaching which will *(presumably after the holidays)* lead to further bullish priceaction followed by a selloff treading us down toward the $3070.5 area, a bearish dump which should approach fast & furiously if the pink trendline from DEC '17 is any indication, we're seeing a repetition in priceaction that will ultimately lead to a retracement -- though keeping it on the EMA for you forex swing traders , SPX500 has had an UNDOUBTEDLY FANTASTIC RUN THE PAST 2-3 QUARTERS, FOR ALL OF 2019! yet all good things must come to an end.
Remember this publication is LONG so although the slope between the green TP line & current price seems miniscule, it could actually take a while (pointless to speculate timeframe) but >30D before it reaches that apex leading us to the selloff @ 3070.5
Great thing about stock predictions is that much less volatility == much more predictability == much less $ROI due to lower risk/low reward.
Like riding a bike with training wheels on flat terrain as opposed to riding a mountain bike on gear 10 up everest (forex trading wallst vs forex trading @coinmarketcal)
This could very well be fantastic news for $crypto priceaction as (much similar to all other commodities) it parallels precious metals, XAU, etc. as a means of FUD for those looking to liquidate assets in times of speculative uncertainty aka FUD. I'll leave it at that for now. Also, $BNB priceaction looking solid for entry (defer to linked publication below) but I digress.
Peace & Love.
Happy Holidays & New Years -- will follow up with daily publications (as promised) after the Holidays circa Jan 10-12th.
Disclaimer
Not financial Advise. Please invest wisely & always set stop-losses.
-@a1mTarabichi

Bond yields rising, divergence shows a slight 2020 SPX pullbackThe S&P 500 has been on a tear in 2019, rising nearly 30%, from low of the year to high it has surpassed the 30% growth mark. However, there has been a prevalent divergence between bond yields in the US and the SPX, which are correlated to move the same way. This means there could be a convergence in the near future to get back to the "regular" pattern.
Over the past few months bond yields have been climbing slightly, but year to date there has been a 23% drop in the 30 year and 31% drop in the 10 year. About the same amount as the S&P has risen. Those bond yields have risen about 15% since September while the S&P 500 has risen exponentially. This means we are expecting a pullback in the S&P 500 since the bond yields have started to do their part and slowly rise. We are not expecting a 30% gain in bond yields, not a 30% drop in the S&P 500 but a moderate move to regularity. Based on the monthly, the S&P 500 could pullback 9.5% to the 2926 level where the impulse for the move higher happened. The volume is extremely weak on all time highs which is another indicator. From there the upside potential is 3500+ based on a Fib extension.
If the S&P 500 pulls back we do expect another rise of 15+% ideally in bond yields. This can be contributed to eased tensions between China and the US and a hold on rate cuts from the US Fed.

SPX500 SHORT SHOULDER HEAD SHOULDERSPX500
Entry 1 3197
Entry 2 3200
Sl 3208
Tp.1 3190
Tp.2 3183
Tp.3 3174
Tp.4 3168


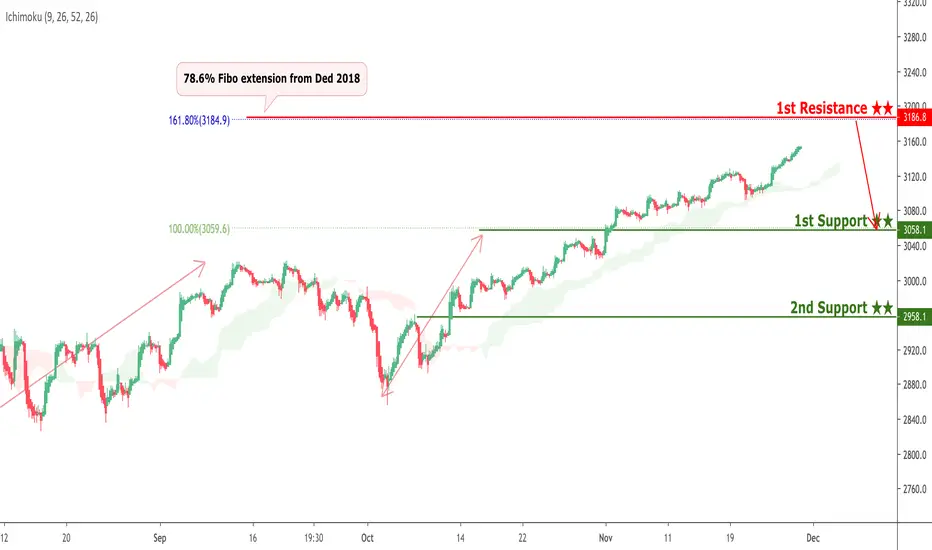
SPX approaching resistance, look out for potential reversal!
SPX is approaching its resistance at 3186.8 where it is could reverse down to its support at 3058.1.
Trading CFDs on margin carries high risk.
Losses can exceed the initial investment so please ensure you fully
understand the risks.

SPX bounced from support, potential for a further rise!
SPX bounced off 3058.1 where it could potentially rise further to 3186.8.
Trading CFDs on margin carries high risk.
Losses can exceed the initial investment so please ensure you fully
understand the risks.

SPX pulled back, is it going to hit all time highs now? 3245!The SPX was due for a pullback, we had anticipated the move lower before a pop would be more extended than it was and it was driven on trade news. We did, however, curl back into the wedge that was broken and use it as support before slightly rallying throughout the past few sessions. It did not seem like the downside was over after Monday, considering we saw an 80 point drop in just 2 days, which was about 2.7% from all time high. In our previous idea we mentioned that the SPX would have a really hard time moving up without pulling back just a bit. We got our pullback but we did not expect the price to rebound so fiercely off that support structure.
Now the question is what is the move to the upside? How far can we see the price on this rally? Last time we said that we would probably come into an all-time high a new one that is, somewhere above 3175.
A measured move is 3245 based on the Fib extension.
IF the trade talks continue to deteriorate then we could see more downside in the SPX bringing price down to 3025.
Disclaimer: This idea is for educational purposes only, this does not constitute as investment or trading advice. TRADEPRO Academy is not responsible for market activity.

Gold up to $1500? Trade war seems to think so...Gold was recently looking really bearish as trade news started to flush out of the US that did not look to good for the remainder of the year and the schedule they had planned. A double bottom formed on Gold at $1447-1450 where price rallied and nearly hit $1490 on its way up. The idea here is that there is strong resistance at $1485-1490 based on the low volume node from the year to date volume profile and the previous structure support that is going to act as resistance this time through. Should that level break we can see a move into the year to date POC and ultimately the $1500, the $1490 area will act as support on the retrace lower as well. This upside can be further opened on gold if the trade talks continue to deteriorate over the next few weeks and it puts downside pressure on the US equity markets. If this area holds resistance and there are intraday rotations at the level then we could see another move down to $1445-1450.
Disclaimer: This idea is for educational purposes only, this does not constitute as investment or trading advice. TRADEPRO Academy is not responsible for any market activity.

SPX bounced from support, potential for a further rise!
SPX bounced off 3058.1 where it could potentially rise further to 3186.8.
Trading CFDs on margin carries high risk.
Losses can exceed the initial investment so please ensure you fully
understand the risks.

SPX potential reversal!
SPX expected to rise up to 1st resistance at 3186.8 where it could potentially react off and drop down to 1st support at 3058.1.
Trading CFDs on margin carries high risk.
Losses can exceed the initial investment so please ensure you fully
understand the risks.

How the Russell 2000 indicates a correction in the S&P 500The Russell 2000 small cap index has been a prevalent lagger throughout the whole US equity rally into all-time highs. This is of concern for the health of the economy and the health of the S&P 500 index. The small-cap sector reacts the most to economic conditions and monetary policy, being the most affected if they cannot make new highs and are over 8.5% away from all-time highs we can infer that a stronger correction of 8-10% may occur in the S&P 500.
The S&P 500 is full of companies that have been artificially inflated by stock buy-backs and also monetary policy allowing for cheaper borrowing. There is a healthy retrace coming out to catch down to small caps since they have not relished in the strong economic conditions. Which presents another concern, is the economy that strong to begin with? If there is a correction, there could be more buyers in both the S&P 500 and Russell 2000 companies to help markets reach all-time highs yet again.

The correlation: Bond yields indicate SPX CORRECTIONUS treasury yields and the S&P 500 have a positive correlation. The two usually move lockstep to a certain degree and when they diverge, they don't stay divergent for too long.
This time, however, at the beginning of 2019, the divergence occurred and has continued for nearly 12 months now.
The idea behind the correlation is that bond prices are typically inverse to the equity prices, due to the yield of bonds being related to the SPX.
From darkest blue to lightest: 30-year yield, 10-year, 5-year.
The area at which the divergence began, the S&P 500 gained over 25% while bonds fell about 35%. This leaves us with three alternatives.
1. The S&P 500 corrects 50% to catch down with the bond yields (least likely)
2. Bond Yields for the 30, 10 & 5Year all rally 50% (not likely)
3. The two meet somewhere in the middle. Meaning bond yields rally 15-25% or so, while the S&P 500 drops 10-15%. (a most likely scenario)

SPX potential reversal!
SPX expected to rise up to 1st resistance at 3186.8 where it could potentially react off and drop down to 1st support at 3058.1.
Trading CFDs on margin carries high risk.
Losses can exceed the initial investment so please ensure you fully
understand the risks.

SPX potential reversal!
SPX expected to rise up to 1st resistance at 3186.8 where it could potentially react off and drop down to 1st support at 3058.1.
Trading CFDs on margin carries high risk.
Losses can exceed the initial investment so please ensure you fully
understand the risks.
SPX potential reversal!
SPX expected to rise up to 1st resistance at 3186.8 where it could potentially react off and drop down to 1st support at 3058.1.
Trading CFDs on margin carries high risk.
Losses can exceed the initial investment so please ensure you fully
understand the risks.

SPX to climb from upside confirmation, potential bounce!
SPX to climb from its upside confirmation at 3186.8 where it could potentially bounce further to 3058.1.
Trading CFDs on margin carries high risk.
Losses can exceed the initial investment so please ensure you fully
understand the risks.

SPY SHORTS if the week close is under 311.The first red week out of the last 7 weeks, price had rallied over 6% since early October and this is the first sign of a reversal for the continued move. The volume had been weak over the last few weeks on new highs. Price did make a new all-time high this week before reversing on the week. The doji candle that formed at the top of the trend on a weekly chart indicates the start of a reversal and looking at the multi-timeframe analysis on a daily candle chart as well we've seen the downside begin to open up.
If price breaks below 311 this week and closes under we can see more downside open up and the start of a slight reversal. The first target is the broken top at 301, where the volume profile that measures year to date tapers off for an edge of low volume. This ties into the order flow trade. The longer-term potential target for the downside is the start of the impulse move higher at 293.50 which is the year to date POC.
Disclaimer: This is not trading or investing advice, the idea represented is for educational purposes only.
