TRADERSAI A.I. Powered Model Trades for Today, WED 06/19When Everyone and Their Grandmother "Knows" What the Fed and the Market are Going to Do...
When everything looks and feels so obvious and everyone knows what the market is going to do ("Fed indicates they are going to lower the interest rates soon, and the market rockets upwards", of course), it might be time to pause a bit and let the noise settle down.
The above chart gives the Aggressive Intraday Model trading plans for today. Please check out the full plan on our website.
Good luck with your trading today!
#ES #SP500 #SPX #SPY #Fed
Spxshort

SPX reversed from resistance, potential drop!SPX reversed off its resistance at 2952.1 where it could potentially drop further to its 2729.1.
Disclaimer:
Trading CFDs on margin carries high risk.
Losses can exceed the initial investment so please ensure you fully
understand the risks.

TRADERSAI A.I. Powered Model Trades - Outomes (updated chart)Updated chart levels to reflect the morning's published levels on the chart.
For the original chart levels published in the morning, please see:

A.I. Powered Morning Trading Plans - OutcomesThe chart depicts how the trading plans published in the morning - idea published on TradingView at 9:52am - tracked the market action. You can read the detailed results tracking at our site tradersAI.
Hope you all had a good trading day, and if not, remember that tomorrow is another day of opportunity to utilize the lessons learned and the experience gained. Good night!

TRADERSAI A.I. Powered Model Trades for TUE 06/18Markets Waiting for the Fed Tomorrow to Unwind
The following trading plans are indicated for the regular session today:
Note: For the trades to trigger, the breaks should occur during regular session hours starting at 9:30am ET. Due to the intraday nature of the aggressive models, they indicate closing any open trades at 3:55pm and remaining flat into the session close. No opening of new positions after 3:45pm. Only one open position at any given time.
Medium-Frequency Models: For today, our medium-frequency models indicate carrying the short from yesterday until the trailing stop is hit. When closed, the models indicate opening a long on a break above 2910 and opening a short on a break below 2882, both sides with a 10-point trailing stop.
Aggressive Intraday Models: For today, our aggressive intraday models indicate using the 2895 as a pivot - going short on a break below 2895 and going long on a break above 2895, both sides with a 7-point trailing stop.
#ES #SP500 #SPX #SPY #Fed

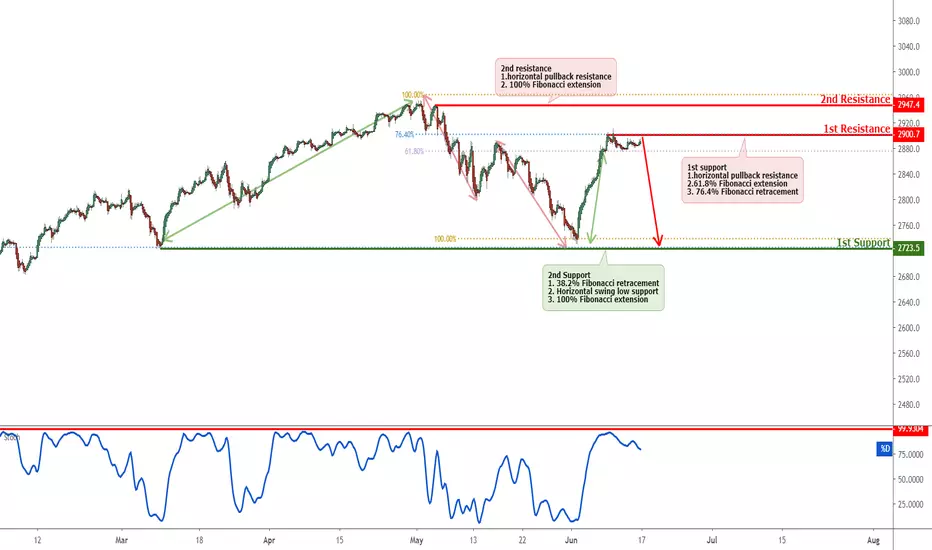
SHORT SPX Approaching Resistance, Prepare For A ReversalSPX is approaching its resistance at 2900.7(61.8% Fibonacci extension , 61.8% Fibonacci retracement , horizontal swing high resistance) where it is expected to reverse down to its support at 2723.5(38.2% Fibonacci retracement , 100% Fibonacci extension , horizontal swing low
support).Trading CFDs on margin carries high risk.
Losses can exceed the initial investment so please ensure you fully understand the risks.

SPX Approaching Resistance, Prepare For A ReversalSPX is approaching its resistance at 2900.7(61.8% Fibonacci extension , 61.8% Fibonacci retracement , horizontal swing high resistance) where it is expected to reverse down to its support at 2723.5(38.2% Fibonacci retracement , 100% Fibonacci extension , horizontal swing low
support).Trading CFDs on margin carries high risk.
Losses can exceed the initial investment so please ensure you fully understand the risks.
SPX Approaching Resistance, Prepare For A Reversal
SPX is approaching its resistance at 2900.7(61.8% Fibonacci extension , 61.8% Fibonacci retracement , horizontal swing high resistance) where it is expected to reverse down to its support at 2723.5(38.2% Fibonacci retracement , 100% Fibonacci extension , horizontal swing low
support).Trading CFDs on margin carries high risk.
Losses can exceed the initial investment so please ensure you fully understand the risks.


SPX Approaching Resistance, Prepare For A Reversal
SPX is approaching its resistance at 2900.7(61.8% Fibonacci extension , 61.8% Fibonacci retracement , horizontal swing high resistance) where it is expected to reverse down to its support at 2723.5(38.2% Fibonacci retracement , 100% Fibonacci extension , horizontal swing low
support).

SHORT SHORT SPX Approaching Resistance, Prepare For A Reversal
SPX is approaching its resistance at 2900.7(61.8% Fibonacci extension , 61.8% Fibonacci retracement , horizontal swing high resistance) where it is expected to reverse down to its support at 2723.5(38.2% Fibonacci retracement , 100% Fibonacci extension , horizontal swing low
support).

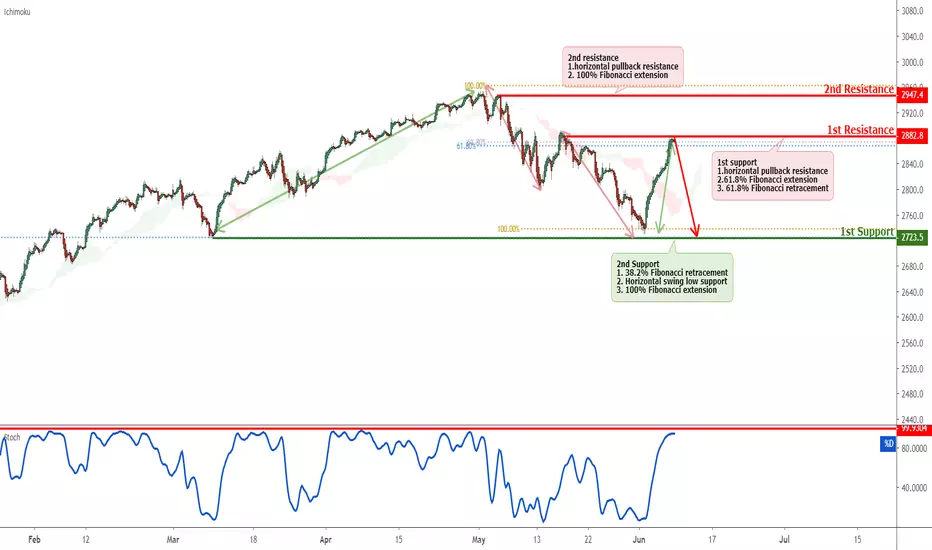
SHORT SHORT SPX Approaching Resistance, Prepare For A Reversal
SPX is approaching its resistance at 2882.8(61.8% Fibonacci extension , 61.8% Fibonacci retracement , horizontal swing high resistance) where it is expected to reverse down to its support at 0.9319(38.2% Fibonacci retracement , 100% Fibonacci extension , horizontal swing low
support).
SPY SPX Still Bullish - Nothing Stopping ThisIn theory we are up against resistance here on SPX. But scanning the pissed off comments of most traders who are short and/or missed the train, I say there is fuel for a pain trade higher. With some technicals JUST turning today, we may have many more up days. and with weeklies turning as well, many more weeks of upside.

SPX S&P 500 2 Week ForecastTrump wants to win re-election. Trump can’t win if the US economy enters recession.
The only way Trump can possibly avoid recession is if the Fed cuts interests rates now. If the Fed waits til the market has tanked in order to cut rates, it will be too late to avoid recession via monetary stimulus that point. Trump needs rate cuts now! In order to get this he is using the tariffs to tank the stock market now to force the Fed’s hand.
The Fed meets June 19, July 19, and September something. They don’t meet in August. These next two meetings are important.
I believe the SPX will find a temporary bottom right around this first Fed meeting in 2 weeks, for a 3% decline.
If the Fed comes out with a surprise rate cut in June or July this could send the market higher (not much of surprise as probabilities are now at 80% for a rate cut in September but would still be a surprise). If the Fed does nothing I’d expect more selling & finding new support lower.
If SPX continues selling after June 19, I’d look for support between 2550 & 2475. I don’t think the Federal Reserve would let the SPX get that low again though...

Semana importante!Puede que el crash ya haya empezado! / Maybe the crash has already started!
Los últimos serán los primeros... / The last will be the first ...
Si corrige puede que lleguemos al nivel de los 2570 puntos. / If there is a correction, we may reach the 2570 points level.
Debería ser así por la clara divergencia entre el precio y el indicador RSI. / It should be that way because of the clear divergence between the price and the RSI indicator.
----------------------------------
Good luck!


Elliott Wave View: S&P 500 (SPX) Has Resumed LowerShort term Elliott Wave view on S&P 500 (SPX) suggests that it has resumed the next leg lower. The Index has ended the cycle from December 26, 2018 low after a 5 months rally. After topping at 2961.25 on May 1, 2019, it is now expected to pullback in larger 3, 7, 11 swing to correct the cycle from December 2018 low. We are calling the decline from May 1, 2019 as a zigzag Elliott Wave structure. On the chart below, we can see the bounce to 2892.15 ended wave B.
The Index has resumed lower in wave C with potential 100% extension target towards 2702.4 – 2738.4 area. The internal of wave C is unfolding as Elliott Wave impulse structure. Down from wave B at 2892.15, wave ((i)) ended at 2831.29 and wave ((ii)) ended at 2868.88. Wave ((iii)) is nesting and currently unfolding also as an impulse in lesser degree. Wave (i) of ((iii)) ended at 2805.49 and wave (ii) of ((iii)) ended at 2841.94. Near term, while rally fails below 2841.94 in the first degree, and 2892.15 in second degree, expect the Index to extend lower.

Analyzing S&P Bearish Three Drive PatternTiming the market is quite a difficult task, and in predicting tops and fully committing to a bearish trade one must be cautious with their entry and analyze the possibility of different patterns playing out on multiple time-frames. Thus the subjective nature of trading is inherently flawed to push individuals on a majority-biased position with the help of the media and miss-information on technical analysis
What is playing out on the SPX on the weekly appears to be a bearish three drive pattern that is sort of like an extremely stretched pennant that has a peak that will either break upwards or down with force,
However, the SPX now has more bearish stacked positions and the market makers/institutions will attempt to screw them by running their stops to $3020 one last time in the upcoming months before completely demolishing the bulls and actually start plummeting. Not just a 3% drop in a week.
The trade here is a potential short term long entry and ride it to $3020 before converting full on short and analyzing the 1.618 extension down to $2200

SP500 Sitting on the 50MA. Striking Similarities with 2018SP500 Futures are sitting right on the 50MA at approximately 2862 this morning before the open. Striking similarities with the 2018 fractal. The market topped, paused briefly on the 50MA. Upon breaking the 50MA, the market plummetted nearly 392bps in a single session on a red 5 candle (TD indicator), which is exactly what it's setting up to do now. If the 50MA is broken, watch out below.

SP500 Breakdown Near Top of Rising WedgeI've been following, waiting patiently for the breakdown. The market was unstoppable, nothing could shake it. Yesterday's reversal was bizarre, but the breakdown provided a wonderful buying opportunity (short). Further breakdown to come...lets see where we find support.

SPXS declining wedge coming to an end: breakout incoming! SPXS declining wedge pattern coming to ahead in the next few trading days. Watch for a daily close breakout and load up on your SPXS longs. RSI screaming oversold. VIX starting to show uptrend meaning impending volatility. Hold on to your pants.

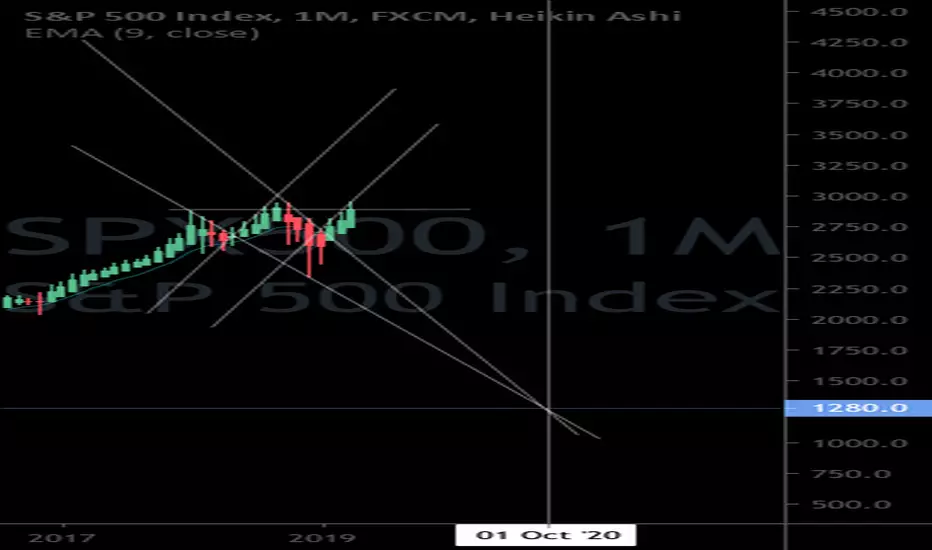
S&P 500 MARKET CRASH 2019I see the opportunity to sell SPX
it is going down crashly
i think it is the end of up trend
now it is down only
enjoy
if you like my signal please help to like and follow
Thank you

SPX500 Ultra Rare Pattern: The Bear WitchFor the superstitious out there the SPX should be giving you a macabre vibe.