Spxshort

HOW TO REALLY PLAY THE REBOUND IN THE STOCK MARKETBold move, over exposure. You ready?
Short VXX which tracks the VIX.
Buy XIV which is inverse to the VIX.
Buy SPXL which is a 3x levered SP500 ETF
Short SPXS which is a 3x levered short SP500 ETF
If this isnt just a correction were screwed, if not, then congrats.

SPX - Tonight We're Going To Party Like It's 1987?Looking at the monthly logarithmic chart of the S&P 500, this chart reflects what would happen if we had a repeat of 1987. Heading up to October 1987, there was a straight line run up of approximately 2 years, then a crash to the 0.5 Fib line quickly in 2 months, where the crash erased the gains of the prior 12 months.
If we extrapolate the same scenario for the S&P 500 for 2018, there was also a straight line run up for approximately 2 years, and if the S&P 500 retraces to its 0.5 Fib line, it would hit 2380 in approximately 2 months, which would also erase roughly 12 months worth of gains from Feb 2017 to Feb 2018.

Short SPX to 2200More of a forex and crypto guy but today the SP:SPX caught me eye for nice 2 month short to 2200. Ill update you guys as we go. If you would like a more in depth reasoning please feel free to leave a comment below.

S&P 500 signals a significant equity breakdown #SPX $SPXThe chart on the left hand side shows the macro view. According to the chart and the Elliott Wave counts, we are very close to the end of a super cycle. Since 2009, the stock market is in a bullish period but this rise will end in this year though the increase is still robust.
If you look at the other chart, which zooms in the 5th wave, SPX may see levels above 3,000 but levels above this threshold seem to be unlikely.
The next question is where will be the next support level. It will be quite early to speculate but a .50 correction to 1,800-2,000 is quite possible.
P.S. RSI shows an overbought level on the right hand side chart. RSI will be above 70 for a while but the with the upcoming correction, the indicator will gradually fall.

S&P500 Futures 1h Supply - Daily Engulfing Reversal!All Trade Parameters shown on the chart. Short setup on 1h Supply. Level on top of Level scenario. We will only short upper level due to risk and safety. Daily Reversal Pattern forming with a powerful engulfing candle! Looks like we reached the High of the Year.


Short Opportunity SPX500 (700 points/1 month)A Deep Crab pattern on SPX500, potentially leading to a drop to 2480 in 1 month.

S&P500 Short PositioningTrump policies, profit realization requirement and some technical indicators base this strategy.
It doesn't have SL level, cuz don't need :))
Profit levels are on the graph.
Good luck.

RoadmapThis is based on the Nikkei 225 price action from late 1987 to 1990. The existing action fits well, we are now at early November 1989.
This chart presumes one more fast ramp by SPX to 2620, then a sharp 18% fall wiping out all the Trump gains. This would be followed by a 50% rebound, and then further falls into the next few years, eventually reaching the 2007 high of 1572.


Short S&P 500Looking at a resistance area that proves to be stronger than expected. Ready for a trade against the trend?

$SPX two pitchforksBoth the horizontal and channel show the same short-term result. But only a break of, say, 2310 would be dangerous.

SPX 1h , BEAR DVG, Fake break up big resistance 236xish ?SPX 1h , BEAR DVG, Fake break up big resistance 236xish ?
Maybe down in triangel again, down retest Ichimokucloud 235xish... ?

SPX 5 rejections at 2350Hello Traders,
today we would like to share with you the SPX as it shows very interesting moves currently around the 2350 level.
"White House says vote on healthcare bill scheduled for 19:30GMT (via. Reuters)." Therefore, the market currently tumbles sideways as uncertainty arises, everyone is looking at a decision which could move the SPX as it currently flirts with 2350 zone on the downside, after the break of this zone on Tuesday. Will we see lower prices? First clue was the 5th rejection of the strong resistance zone at 2350. However, important is today's close together with new from the White House.
We always mention the importance of intermarket flows, as we believe that investors only repark their money due to sentiment and global macro-economic conditions. Therefore, we always keep in mind the in-and outflows with the help of our intermarket indications that lead us towards better timing when making a trading decision. As you might know that timing is one of the most important things when it comes to trading together of course with risk/money management.
As seen in the chart, two of our three intermarket indications already moving in lower areas territory. They might be the possibility that they soon reach extreme zones of more outflow of capital to other asset classes. We always take into account the BIG 4: Currencies , Bonds, Stocks and Commodities . Only the SPX/USDX ratio shows still more potential to the downside. Movements could be soon momentum driven based on intermarket indications.
As always, trading is a probability game nobody is 100% right and always use a stop-loss when trading. Trade with care.
We wish you much success,
The Secrets2Trade Team


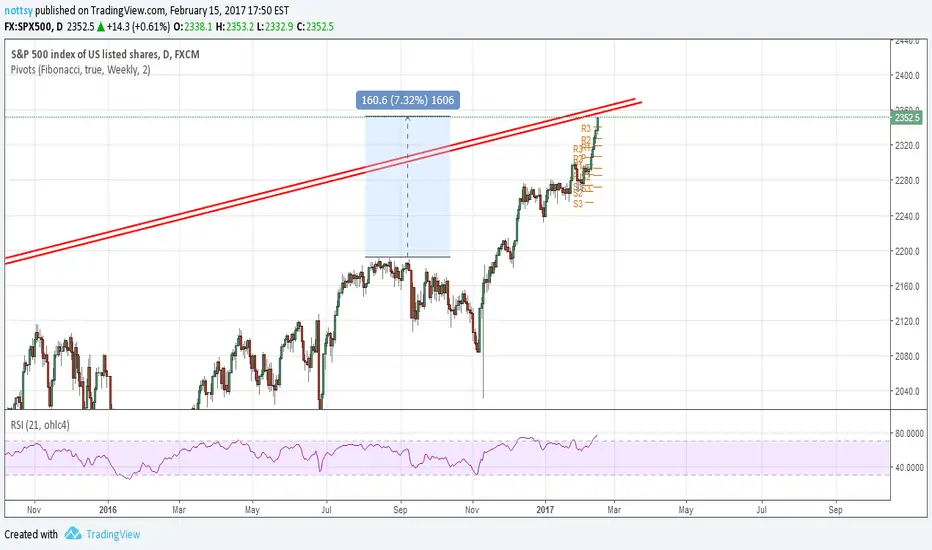
Short SPX around 2360This rally is overextended in my opinion. Again RSI is oversold, Pivot R3 broken substantially and SPX is meeting substantial resistance. Volume on FXCM and OANDA has been pretty low, and we already up 7.5% since the pre-election highs.
SPX 45min Bear dvg MOM+MACD,short in a maybe big M top-formationBelive a small corretions here now >> retest 2304 >> retest 2298.... then we will see, how it react, if this going down there. If against my idea now, start to break out up, then this idea is a failure now.

SPX 15min next wave 4&5,retest neckline 2285 >> retest ATH 2304Bear dvg MOM, RSI, MACD in 15 & 30 min chart, at this 2297 hit..... just a suggestion if this could happen. I know my EW-labeling is probably wrong ?, but it's just helpful to use...and learning.

SPX see potential downtrend?After long period of correction, SPX start to see an triangle converging soon. It's likely it will do down if it continue to break below 2260

