SPX 500 index: local peak at 3850 - key turning point: Today we're here to talk about the SPX 500 index
Today: The index is trading at 3795 and yesterday we saw the market attempt to move up to the 3850 level. Here is a link to the idea. Today, market participants will continue to push the market to the 38 50 zone. Where I expect the formation of a new local peak.
Today we are waiting:
Today, like yesterday, we are waiting for an attempt to move to the level of 3830 - 38 50.
What I recommend:
If you want to go short:
It is better to open short positions from the level of 38 35, but limit your losses.
If you want to buy:
Buying now is too risky. If you want to buy, it is better to wait for the bottom of the market around 3550 - 3480 and buy there.
If you are not in the market:
You can try to go short from the 3835 level or wait until the market bottoms around 3550 - 3480 and then buy.
Like and subscribe, thanks!
Also remember to contact me in 2 or 3 days for further trading advice.
Don't forget to like it, it really motivates me to share my market knowledge and subscribe to me, and you will always be aware of the movement of the SPX 500 index.
See you next time!
Bye!
Spxshort

Understanding The SPXThe hot focus at the moment is on the FED and their MPC decisions.
We are seeing now that the rising of rates is to SLOW the economy and drag inflation down. The problem is this is rarely ever a fast process and markets can drift for a long time to the downside.
Market crashes can last a long while and it is important to trade IN LINE with sentiment. There is no good lumping in when the sentiment surrounding the particular Asset Class you are Trading is poor.
Take decisions on your size in a risky market. Understand what is going on and trade accordingly.
This is how you maintain solvency and profitability regardless of the swing in market price.

SPX short term is bearish, medium term is bullish!SPX is simple here, short 4165-80 Zone, buy low 3900 for the move up to 4300!
Im looking for a bottom early in a week, ideally by Tuesday and move up to at east 4215SPX and ideally to 4300 before a test of 3885-90SPX
On the other hand we could see 3885-90SPX next week or pre-Fed and move up to 4300+ into early July high
Buy zone for tomorrow with stops!
- 4060-65SPX
- 4055SPX light level of support
- 3927; 3908SPX
- 3885-90SPX is the main buy zone
- 3850 and 34 must hold on any try or it falls apart (main support, not expected to get hit any time soon)
Short
- 4175-70SPX and 4215-25, no short above 4225, next target is 4300

SPX/USD Daily TA Neutral BearishSPX/USD Daily neutral with a bearish bias. *Janet, Jerome and Joe all got together yesterday and it's fair to say they all agree they want more pain before more gain ("do anything it takes to bring down inflation"), and they want it mainly to be done through monetary policy (Fed). Fed also started rolling off TS and MBS today.* Recommended ratio: 40% SPX, 60% Cash. Price is currently trending down at $4100 after being rejected by $4175 resistance on the first test. Volume remains moderate and is on track to favor sellers for two consecutive sessions. Parabolic SAR flips bearish at $3869, this margin is neutral at the moment. RSI is currently trending down at 50.24 after getting rejected on a retest of 52.68 resistance. Stochastic is currently crossing over bearish at 91. MACD is currently testing the uptrend line from March 2020 at -44 after breaking out above -76.22 minor resistance. ADX is currently trending down at 23 as Price is attempting to continue rallying, this is mildly bullish at the moment. If Price is able to bounce here then it will likely retest $4175 resistance before attempting to test the upper trendline of the descending channel from November 2021 at ~$4400. However, if Price continues to break down here then it will likely retest the lower trendline of the descending channel at $4000 before potentially falling lower. Mental Stop Loss: (two consecutive closes above) $4175.

SPX ready for Y to 3219Im tracking SPX Elliott Waves and SPX is about to close a Flat ABC (yellow). Next targets are 3582, 3220, 3002 and even 2633 is possible. Also Fed should announce new Rates hikes... everything is sync to present new oopportunies lower.
Cycle Wave 4 top entry fibs are
in between
0.3 - 3573 and
0.5 2743

SPX Planned Formation Update 5/23/22Right now we are experiencing the early stages of a big breakdown on the SPX
I say this based on the formation provided, which has even been produced on a smaller scale for observation on the SPX chart
A break down like this will be disastrous, but not the end of the world
The formation provides bottom points along the dot come bubble, 08 crisis and what is yet to come.
The Aptiv chart shows also a great representation of this within the Fibonacci circle, with a big extension (similar to that on SPX) leading to big downfalls to complete the broadening wedge pattern
I have made charts of this in the past please check them out
Above is the smaller formation VS the larger formation we can see on the Monthly timeframe
Above is the original post

SPX500 index: Let's go to 3910 today!Today we are here to talk about the SPX500 index.
What's on the market now:
The index is trading at 40 13. And in the last trading session, we saw the price stabilize, as I expected earlier, here is a link to the idea. Globally, the index is moving towards the level of 3830 - 3780.
What are we waiting for today:
Today we expect a decline to the level of 39 00, and then an attempt to rise to 4100. If the movement to 41 00 is canceled, then we expect a sharp move to the 37 80 zone
What I recommend:
If you want to open short:
I recommend you go short above 4100. If you want to avoid risk, going short above 4145 seems to me the safest.
If you want to buy:
Long positions are possible from the 3910 level, limit your losses.
If you outside the market:
You can sell above 4100 or wait until the market bottoms around 3820-3780.
Like and subscribe, thanks!
Also remember to contact me in 1 or 2 days for further trading advice.
See you next time!

Will Supply Hold? SPX - I want to see price hold this high and reverse, have nice confirmations that it could happen with the HTF, BOS and momentum, let's see what happens when price gets into the PRZ
Let me know your thoughts!
Disclaimer
I never trade these ideas until price is in the zone and i get LTF confirmation!

SPY in bearish modeDays like these are perfect opportunities to enter your shorts.
FOMC meeting next month
Rising rates

SPX Short Side TradingHere is another SPX analysis. After we called it long and exited at targets we are now looking at the short side.
Market Sentiment remains poor, Which you can see everywhere. This aids Short side bias. Look for faster exit.

SXP500 Index: ready to U-turn Today we are here to talk about the SXP500 index.
Today: The index is trading at 4462. In the last trading session, we saw a sharp rise in prices to the level of 4485, which I mentioned earlier here is a link to the idea.
What's on the market now:
The market continues to develop lateral movement. Perhaps there is a good place to enter the market.
What are we waiting for today:
Today we are waiting for the market to try to rise above 44 85. And then the subsequent stabilization of the price to the level of 44 15.
What I recommend:
If you want to open short:
I recommend going short above 44 85, limit your risks
If you want to buy:
Long positions are possible below 44 15. Limit your losses to the last low.
If you want to ask a question about an idea:
If you would like to get more info, please do not hesitate to contact me in the comments below.
And please don't forget to like. This greatly motivates me to share my trading ideas and market knowledge.
Also take a look at my profile where you will find the full history of trading every day on the SPX 500. Contact me in 1 or 2 days for further trading advice.
Don't forget to subscribe to my channel.
I post SPX 500 analytics every day, so check back tomorrow!
See you next time!
Bye!

SPX S&P500 inverse Head and Shoulders patternSPX S&P500 is looking bearish for now.
I think we might see an inverse head and shoulder chart pattern before closing higher this year.
Looking forward to read your opinion about it.

Potential Butterfly Forming 🦋 SPX - Again, similar story with SPX (95% Correlates with the DOW) This moves, dow moves, again today not respecting anything (Due to the sell off), another butterfly forming here, if we don't see this demand respected ill be looking for shorts on Indices, lets see what the opening bell brings.
Let me know your thoughts!
* Disclaimer **
These ideas I never trade until the end target with my initial lots, I focused on high probable entries with higher lots and use a specific partial taking strategy giving me a very high win rate and take most of my profits very early, I only leave a small % of my capital to run the entire trade. On the flip side im constantly monitoring LTF momentum and will close early if things change, these analysis's are for research purposes only.

SPX W-Shaped RecoveryI think we might see the end of the war soon.
Russia says the first phase of its “military operation” in Ukraine is mostly complete.
I am considering a W-Shaped Recovery on SPX and a price target of $4710.
Looking forward to read your opinion about it.

S&P500 calls for short - Head & Shoulders TOPFollowed by the Rising Wedge Breakout, we can see very clearly that SP500 lost some momentum - all of this on the background of Fed's Rate Hikes Expectations.
The Head and Shoulders pattern is clear and obvious - let's dig some more important details:
1.Volume Distribution:
The volume distribution in a proper H&S Top should be concetrated on: The left Shoulder, The Head, or both of them - but never high on the right shoulder.
Note that high volume on the left shoulder and on the head are not that significant, while majority of the volume concentrated on the second bottom of the H&S.
The volume distribution here does not support the expected implications of an H&S breakout, and therefore, we should consider a short trade with a bit of suspicious.
2. The Breakout
The first breakout of the Neckline occurred with a little peak in volume - this situation tells the trader to wait for new lower top to test the Resistance of the Neckline.
And indeed, the patient trader received the expected new lower top, and on Friday the power of sellers was present.
The inability to raise above the neckline and the fact that the price rejected from there - was a strong tactical signal for those wanna dive deep into profits.
3. Price Target
By H&S Measurement rules, the objective of minimum potential is 3,865.
When considering the overall Technical picture, the historical resistance from September 2020 (3,592) looks very solid to serve as strong support level.
Conclusion:
Technical wise, the picture is very clear and convenient to initiate a Short trade while maintaining a Stop Loss above the last minor top.
Fundamental wise, the Fed is about to hike 25bps on coming Wednesday, and expected to hike 6 times along 2022.
The collision of Russia-Ukraine sets a descent platform for inflation super nova on commodities whom which cause a liquidity problems and chaos on international trade.
Reversal:
There is might be a scenario in which the Fed will flip over and suggest that the "unexpected" war developments will require the take the leg of the pedal of Monetary tightening and go for more dovish policies in form of QE and maybe keep IR low, I think the possibility of such scenario is low, but still - In such case, all the short thesis is canceled and we should wait to see how the markets react to such case and trade accordingly.
Good Luck!

Something That Bothers Me - SPX On the Weekly chart it can be seen that the wedge pattern is respected with three down waves
The same pattern arose on the Monthly timeframe, yet a third wave is absent, and bullish continuation was the result
Thoughts?

SPX500 short Things are not looking very good for risk assets after the break below 200 MA.
FED interest rate increase is a headwind for stocks generally and growth stocks in particular.
It seems to us that things are going to get worse over the coming days.
Stay away from the growth stocks and darlings of low interest rate environment.
Most important -> manage your risk.

SPX500 - In a very bad and tight spot. It is in a tight spot. Extremely bad spot. If it breaks the trendline it goes kaboom.

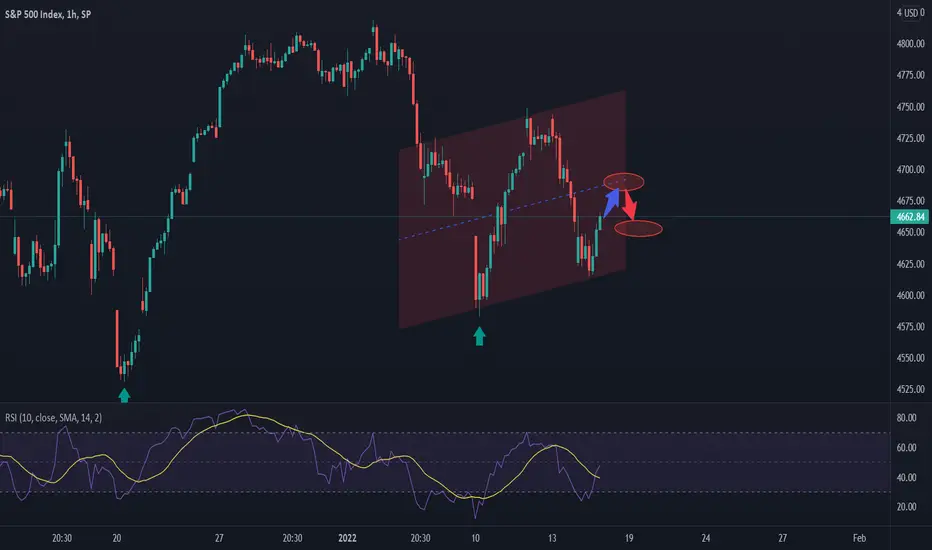
SPX with some room to move..For more daily detailed analysis, don’t forget to click on the follow button. Also, please ask any questions you may have and I will be happy to answer them.
After exiting our long side Trades on the SPX we are looking short at the labelled short zone. It is great for a short intraday based on key TECH aspects like our MA’s.
Exit at eclipse symbol area.
SP500- Bearish Engulfing announce correction?In yesterday's Nasdaq100 analysis I said that I expect a drop for the index and 14k is my first target. Things are not different for SP500, here also expecting the price to drop.
Also, SP500 has started the year badly, with a bearish engulfing weekly candle and, although the price structure is not so bearish like in Nasdaq's case, a drop is probable here also.
4600 is trend line support, that kept the price elevated for more than a year now, and a break here would increase chances for a drop to 4250-4300 horizontal support.
In bearish this index too and I will look to sell rallies.
A new ATH would delay this scenario.

SPX to fallDon't forget to click on the follow button for more professional analysis. Please ask any questions should you have them!
Here we have our SPX chart.
The SPX has rallied on positive market sentiment. It is now rising to a short zone. Make sure your risk is correct to cater for any further rise.
Price target on short side is noted.
We like prices high to sell. do not be scared of this.

SPX rising back to short zones.For more daily detailed analysis, don’t forget to click on the follow button. Also, please ask any questions you may have and I will be happy to answer them.
After the recent target hit on the SPX long side we are looking short back down to comfortable exit areas, noted on our chart.

SPX500USDHello. Due to the negative divergence and the formation of a lower floor, I predict that the 4500 will decrease again
