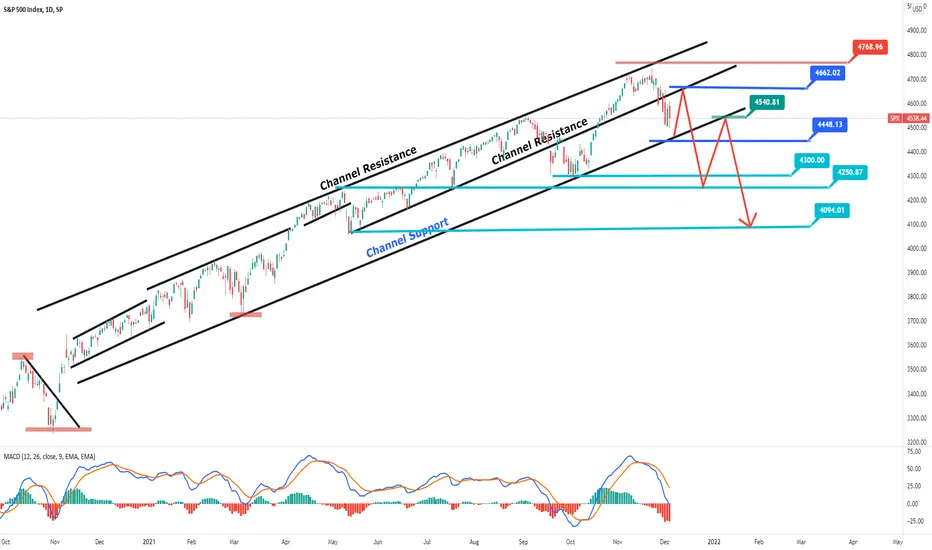
S&P Weekly Forecast: Breaking below 4450 will confirm bearish. The S&P 500 could see a dip in its value if it continues downward, though it is still on an uptrend.
But the recent pandemic concerns and ahead of year-end profit may grow some volatility and hampered S&P 500 upward momentum.
But the good news is the backdrop of a supportive fundamental environment, strong corporate earnings, and constructive profit outlook will be the driving force for most U.S stocks in this market. However, omicron variant uncertainty can also drive price action over short-term periods.
Technically, 4448 is the channel support from the present rates. So, as long as S&P 500 holds these points, we should wait. Fundamental reports are positive as well.
So, we can't sell instant.
But this is also true; pandemic and year-end profit may break the 4448 points. If the market can break below 4448, we will go short, and our first target will be 4300 /4250. and the final target to the downside is 4100.
I don't think the market will drop more than 4100 points if something doesn't happen like the US-China or US-Turkey trade war again.
On the other hand, the market still has chances to go upside down and may test 4650/4670 points nearly first channel resistance again. And final target to the upside is another trend line resistance 4770/4800 points.
Spxshort
SPX to 5000, then big correctionFollowing weekly chart.
There was a big cup & handle formation that takes 16 years. After breakout in the beginning of 2017, target was 3350 and.
After hitting the target, covid broke out!
Actually it was a big corection of this 4 years trend.
Then, a new cup & handle formation formed and it broke the resistance at January 2021.
Target is 5000 and we're really close to this target. After that, my plan is to short till red line.
But important part is there is still a GAP in 2574 and what if we hit there?

US Market Technicals Ahead (15 November – 19 November 2021)As U.S. inflation has surged to the highest level in over thirty years, inflation is likely to remain in focus in the coming week with investors looking ahead to the latest U.S. monthly retail sales figures along with earnings results from major retailers, including $WMT (Walmart).
With $SPX (S&P 500) erasing its weekly losses from Friday’s late week rally, the bearish Rising Wedge formation of $RSP (S&P 500 equal weight) remains in play. Attention has being turned towards small-cap companies after a nine month consolidation breakout on $IWM (Russell 2000), setting a potential new leg of multi month long market rally leading by this companies. It is worth to note that $GLD (Gold) have also broken out of a multi month long trendline resistance, gaining +2.71% as the leading asset class of the week.
China will provide an update on the economic recovery via industrial production and retail sales and wide there are expectation for a slowdown in its economic recovery, just as Europe is experiencing a fresh surge in Covid-19 infections.
Here’s what you need to know to start your week.
Market Technicals
$SPX (S&P 500) vs $RSP (S&P 500 Equal Weight)
The benchmark index $SPX retraced with a weekly loss of -0.31% (-14.68 points) confirming last week’s highlight on the over-extension of this rally which was 200% ATR away from its short term moving average, the first time since September 2020. With $SPX reducing its intraweek losses with Friday’s +0.72% gain, it is worth to note that $RSP (S&P 500 Equal Weight) has yet to break its Bearish Wedge Formation, which was has already played out in $SPX. The upwards consolidation of $RSP may be reflecting signs of fatigue, signaling downside potential of $SPX in near term.
The immediate support to watch for $SPX this week is at 4,645 level, a break of its short term pivotal level.
U.S. retail sales
The highlight of the week’s economic calendar will be October retail sales data, due out on Tuesday, with economists expecting an increase of 1.1%, after a 0.7% rise in September.
U.S. inflation has surged to the highest level in over thirty years amid a global supply chain crunch and data on Friday showed that consumer sentiment fell to its lowest in a decade this month, as higher prices eroded living standards.
Investors are betting that the Federal Reserve will have to raise interest rates sooner than currently indicated to stop inflation spiraling upward.
Retail earnings
Third quarter earnings season is continuing to wind down, but investors will get an additional update on the strength of consumer spending this week with results from major retailers, including Home Depot ($HD), Walmart ($WMT), Target ($TGT), and Macy’s ($M).
The earnings reports will face extra scrutiny ahead of the start of the holiday shopping season, with investors looking at guidance from retailers to determine whether inflation will eat into profits or be passed on to consumers.
Third quarter earnings season has largely been upbeat. 459 of the companies in the S&P 500 have reported with 80% of earnings results beating analysts’ forecasts.
China slowdown
The recovery in the world’s number two economy is weakening and data on Monday, which includes reports on retail sales, fixed asset investment and industrial production is expected to confirm this. The loss of momentum in China, a key driver of global growth, is casting a shadow over the uneven global economic recovery from the pandemic.
The recovery in China has been hit by an aggressive approach to containing Covid-19 outbreaks, a massive debt crisis in the country’s real estate sector and an energy crunch that has weighed on manufacturing activity.
Analysts think the country’s central bank is likely to take a cautious approach to loosening monetary policy to bolster the economy as slowing growth combined with soaring inflation fuel concerns over stagflation.
Meanwhile, U.S. President Joe Biden is to hold a virtual meeting with Chinese leader Xi Jinping on Monday, amid rising tensions between the world’s two largest economies.
Pandemic resurgence hits Europe
Europe is seeing a resurgence of the Covid-19 pandemic, adding to headwinds for the region’s already fragile economic recovery.
Europe accounts for more than half of the average 7-day infections globally and about half of latest deaths, according to data compiled by Reuters, the highest levels since April last year when the virus was at its initial peak in Italy.
Several countries, including the Netherlands, Germany, Austria and the Czech Republic are implementing restrictions or planning fresh measures to slow the spread.
Holland entered a three-week partial lockdown on Saturday, the first in Western Europe since the summer. Germany reintroduced free Covid-19 tests on Saturday and Austria is to decide on Sunday whether to impose a lockdown on people who are not vaccinated.

S&P500 imminent short and massive collison of SPX in few weeksThe biggest depression ever seen will happened in front of our very eyes.
In comparison with it, "Great depression" will be like a baby.
Complete crash on this price of stock level on S&P 500, biggest 500 companies in US will enter into greatest recession ever seen in history of economy it self.
US stock stock index grew 13 years so far, (during depression 9,1 year).
As per mathematical parameter of price mechanism and number of calendar years (4-5 calendar=1 technological year) of continual growth along with more than 700% (nearly 800&) is something which is MAYHEM in stock world and imminent drop toward 3,3,xx, and further drop towards 2.2xx index points and further drop with continual lower highs on each of levels mentioned above which will lead moving of money on $BITCOIN which will most likely " levitate" which will absolutely delude masses of people and afterwards majority will $stock market collides and money moves to " digital sector", After decribed scenario of #s&p500, majority of people who invested in $Bitcoin will lose initially 67% of their capital in 2 moves. #BTC will drop from 75K (most likely target) towards 25K in certain point of thime (after sucks in majority of money from $forex and $dax $spx$nikkei225 and so on so so forth. Moment and further collision of #BTC in rate of " 85%+ bleed rate" in lowest point in cycle with many currencies involved in #stocks will move their money to " safe harbout" which is nothing but the trap for naive and greedy and 85%+ people will lose everything as $BITCOIN drops towards 14k and potential 8200 lowest low (depending on HIGHEST HIGH in cycle). PEAK OF #BTC should not surpass 75.000$ and probably will lose 85% of its ATH value, which will result MASSIVE loss of liquidity right after #stocks collide BIG time, so people will experience " exponential loss. (i.e. 30% stocks and 80% in $BTC) which is at best 2.4% of initial 100% had " in pocket.
#stockmarket #depression #shorts #collision #dropin #forbes30under30 #bloomberg #blackrock #vanguard #jpmorganchase #goldmansachs #bankofamerica #bonds #equities #financial #financialadvice #newyorktimes #forbesmagazine #time #EVERYBANK #ECB #experience #experience #money #money #banks #banks #like #money #T
Good luck #bitcoin #economy #people #spx500 $crypto $btc $stocks $bonds $equities $loans $banks $EVERYTHING.

US Market Technicals Ahead (8 November – 12 November 2021)Investors are to take note of the end of Daylight Saving Time (DST) that will effectively have the US exchanges open at an hour later, depending on your time zone starting today.
$SPX is currently closed at 200% ATR(14) away from its 10 days moving average, the first time since September 2020. Data on inflation will be the highlight of the U.S. economic calendar in the week ahead as investors continue to digest the Fed’s decision to begin tapering stimulus measures, marking the beginning of less accommodative monetary policy.
Earnings season is winding down, but there are still several companies set to report during the week. China’s Communist Party looks set to green-light a third term for President Xi Jinping.
Here’s what you need to know in the coming week.
Market Technicals
The benchmark index $SPX continues its high octane rally with a fresh new high established at 4,718 level, gaining +2.00% (+92.15 points) during the week.
$SPX is currently closed at 200% ATR away from its 10 days moving average, the first time since September 2020.
The immediate support to watch for $SPX this week is at 4,660 level, a break of its short term uptrend momentum.
Inflation data
Data on producer price inflation for October is scheduled for release on Tuesday, followed a day later by figures on consumer price inflation.
The CPI numbers are expected to hit their highest levels so far post-pandemic, with economists forecasting an increase of 0.6% month-on-month and 5.8% year-on-year. Core inflation, which excludes food and energy costs, is expected to rise by an annualized 4.3%.
At its latest meeting the Fed stuck to the view that high inflation would prove “transitory” and is not likely to require a rapid increase in interest rates, prompting investors to call it a “dovish taper.”
While the central bank has so far managed to communicate plans to begin scaling back its monthly bond purchases without triggering a taper tantrum, elevated inflation figures that fuel rate hike speculation could change that.
Earnings
Better-than-expected third-quarter earnings have boosted equities and Wall Street’s main indexes closed at record highs on Friday following a strong U.S. jobs report and positive data for Pfizer’s ($PFE) experimental antiviral pill for COVID-19.
Companies reporting in the coming week include entertainment company Walt Disney ($DIS), drugmakers AstraZeneca ($AZN) and BioNTech ($BNTX) along with Softbank ($SFTBY), PayPal ($PYPL), Coinbase ($COIN) and AMC Entertainment ($AMC),
China
The top leaders of the Chinese Communist Party are set to meet in Beijing from Monday through Thursday, where the decision-making Central Committee could give the go-ahead for an unprecedented third term for President Xi Jinping.
The meeting comes at a time when growth in the world’s second largest economy is faltering amid stringent measures to curb virus outbreaks, a clampdown on the property market, energy shortages and disrupted supply chains.
Data on Sunday showed that Chinese exports slowed in October, but still beat forecasts while imports fell short of forecasts, pointing to continued weakness in domestic demand.

US Stock In Play: $SPY (SPDR S&P 500 Index)S&P 500 is overly extended from its short term trend channel establishment. looking to do a short at break of day low and size my stop at day high.

SPX500 2021-2022 PredictionA prediction , or forecast, is a statement about a future event. They are often, but not always, based upon experience or knowledge.
Although future events are necessarily uncertain, so guaranteed accurate information about the future is impossible. Prediction can be useful to assist in making plans about possible

SPX500SPX500 narrowly missed my 1.618 W3 TP by 60 base appoints or there about, then began what we are now currently in and I am calling W4 and expect another ABC correction here to lead us into W5 which can break above 5,000 EOY

SPX500 Rangebound againS&P500 had another nice day of price action but still no direction. Tested the lows early and tested the highs late. Selling the rallies and buying the dips until a direction is revealed.

SPX500USDIt's likely that we will see a little bit of a pullback as we are at the top of the range. The S&P 500 has rallied a bit during the course of the trading session on Thursday before turning around to form a bit of a shooting star. The candlestick of course is very bearish, and it is worth noting that the NASDAQ 100 has formed something along the lines of a “evening star.” That of course is a negative sign, suggesting that perhaps stocks are going to roll over. To the downside, the uptrend line continues offer support, right along with the 50 day EMA. Beyond that, the 4500 level before they are also offer support, so I think it is only a matter of time before we see some type of bounce. We have been in an uptrend, and I think that does not change anytime soon, so therefore it is only a matter of time before buyers get in on dips and take advantage of “cheap stocks.” After all, this has been a bit of a “buy on the dip” type of market for ages, especially as the Federal Reserve continues to offer cheap money for traders to indulge in. Despite the fact that there has been talk of tapering later this year, the reality is that there is no real sense of them raising interest rates anytime soon.
If we were to turn around a break above the top of the shooting star, then the market is likely to go looking towards the 4600 level, as the market tends to move in 200 point increments. After that, it will be interesting to see where we go next, but it is very possible it could be 4800. There is always the negative turn of events, and that would be something that I would play via puts, because flat-out shorting the S&P 500 has been a very dangerous thing to do for ages, and as a result it is difficult to imagine a scenario where I would actually do that.
You look at the chart and you could see a plainly carved out up trending channel, so as long as that remains in effect, it tells you where you are going to be a buyer and perhaps take a significant amount of profits along the way. Because of this, as we are at the top of the range is likely that we will see a little bit of a pullback.


SP500 - SHORT; Nothing but Shorts (SELL!!) here!A ~25% decline from here should be rather quick and uneventful. However, such a decline is likely to be just the first leg on a long road to a full ~70% decline by the end of this full cycle. - Which would be nothing more than a garden variety return to the Historic Norm ! The same goes for all US Indexes and those who are historically informed (or reviewed the evidence, presented in virtually every single recent post) should not be surprised at all.
The Carry Trade Currencies - and equivalents relative to the VIX post;

Short S&P 500Hello everyone, one of my best analyzes. We are near the end of a cycle, it should end before 2027. The fibonacci retracement follows the crash of 1929, which is also the start of the uptrend. We can see that we have only exited the yellow channel twice. Once from 1997 to 2001 and again from December 2020 to today. The bullish trends inside the bullish channel end when the white support line is broken. The second bullish base lasts about 70% of the time of the first, if we project that the third bullish base should last around 6500 days. When we have been above the 2 years * 1.2 EMA there has been a decline each time, we are currently above that moving average. The RSI: We can see that every time we hit or cross the 77, it follows a decline. Crashes are preceded by a bearish divergence, there is currently an unconfirmed bearish divergence. The crashes lasted 2250 days and 3100 days, each time we returned to the previous level of fibonacci and the channel support. If this is repeated we can expect a drop of more than 35% from the current level.

$SPX - memeline shortMemeline supporting uptrend has broke
Backtest of underside of SR
Seems a good bet especially with growing inflation concerns
Close through the SR box would make me re-evaluate and likely close though!

NDX/SPY and NDX/DJI looks like the NASDAQ is popping a bubbleIntroduction
For my adult life the advice has been to buy just by ETFs. And for the last decade or so the advise has also to been buy the NASDAQ ETF because it over-performs the other indices. It seems that advice is on the precipice of ending due to some long term indicators on the verge of flipping their switches.
The MFV VSTOP is set to 3x and right now price action has gone below the stop. IF we confirm below the arrow stays in place and right next to it we get that black dot which means the move is confirmed. Not shown to keep the main chart clean is the VSTOP on the current time frame which has already flipped bearish.
Price action is also leaning heavily on the 20 month SMA which, due to its use in a variety of other indicators is rather important.
The Chart also declares that we have a lot of divergence on some popular indicators
indicators
I could almost exactly use the same write up for NDX/DJI but this chart has the RSI with a double top instead of clear bearish divergence.
A look at NDX, SPY and DJI to try and guestimate what this dump could look like is very bearish indeed. The dotcom bubble burst was a historical economic event and it seems its ghost has come to haunt us. SPY and DJI will be less affected by this downtrend but will still take significant beatings over the next coupe of years. The fact that they don't go down as much means they are less likely to get a playable/dupe-able bull trap
Here is a replay of the dotcom pop on NDX with my general thoughts. It is on the three day with the daily BB in orange and the weekly in blue. There will be a lot of technical bounces on the way down and a put/short strategy seems very advisable.
My Conclusions
I am not going to go on at length about the dollar or inflation in consumer staples or the wallstreetbets effect. It looks pretty bad out there when you compare the most bullish US index to its brothers and that is generally bearish for the broader market. I am not a financial advisor and I don't have a CMT... purely self taught. But I am going to look to short in one way or another these bearish continuation patterns and I might even take some opportunistic logs when the price action first hits the weekly bollinger band. There is going to be a lot of pain over the next couple of years but there is nothing moral about being bad with money, or losing money.
Here is TSLA based off of my linked idea. Plenty of chances to swing trade in this dumpster fire of an equity if I can get some indicators to back up the TA. The main chart suggest we will get a multi-month bull trap. The chart where I replayed the NDX bubble burst also suggest a multi-month bull trap. Even though the macro situation is bearish you still have to be nibble enough to deal with the rallies however you decide. My other linked idea is how I potentially see BTC affected by the everything bubble

SPX Intraday Week 18 UpdateI think a minor correction is starting, generally considered three waves. You can count five in here but I don't have enough time for that right now. Risk management is essential in this choppy defensive market condition. The five wave obviously finished at 4220 last week. The buying strength just isn't present at these levels. A wise man once told me the five wave is the riskiest to trade. Manage accordingly.

UVXY 1D KISS Test
Holding UVXY next 10 days could be the best or worst decision you've made in terms of hedging for volatility . Diamond Reversal Or Diamond Continuation H&S target $3. 01 or less. Otherwise diamond reversal should occur.
5 day MACD is bullish
Just remember no one gets any awards for being the first to recognize a decent short op and take it. It's not going to manifest as quickly as you think to $10. However, it should recover to this by the latest March 2022.
Short term target is $5.27 from previous analysis with $5.75 upside.
If Head and Shoulders configuration plays out $3. 01 or less in May.

SPX has found its top As you can see based on this chart, SPX has fallen anywhere from 2 to 6 percent every time it touches its top trend line. The "further down" we get in this channel, the bigger drops we have. This only means logically that this next drop should be the biggest shown on this chart. Spx has yet to have a candle close above the top trend line. If we do see it hold then a new high would be imminent. I see this to have a nice drop back down to around the bottom trend line, to the 3975 zone.

Look At This! Please.An extremely rare pattern for an extremely rare time in the U.S.
Ending Expanding Diagonal patterns are not seen very often.
Not a natural looking pattern because the wild price swings aren't natural.
You know what else isn't natural?
The M1 money supply increase from 4 trillion to OVER 18 TRILLION in 2020. They increase the money supply by over 400%!!
Why do you think Bitcoin and blockchain is getting so much support?
Because people are realizing this ship is SINKING!!!
Why do you think decentralized finance is manifesting? You think that's random? No!! Things are created when someone see's a need and the world reaffirms the value in it through their belief and investment.
A break back below 3,800 would be a major sell signal for me and a break below 3,200 indicates the end of the bull market.
Not financial advice. Just what I'm seeing and what makes sense to me based on the data, wave counts, and price action.
I appreciate feedback on my wave counts though, so feel free to comment that I'm an idjit if you want.

2021 is like 73s2021 is like 73s. let's see how this play. if it went well, buy dips at bottom if you can.
1. The four most expensive words in investing are: 'This time it's different. '” So said Sir John Templeton, the legendary investor and mutual fund pioneer. The phrase contains tremendous wisdom, but only if you truly understand what it means. ... “This time it's different” has become a ubiquitous phrase...
2. we will see increasing inflation & Covid case worldwide rising this year. they printed many trillions for check stimulus also fourth stimulus check again? also seems coronavirus won't go anywhere. you can see that Covid cases is still rising on worldometers site. Imagine 1-10 million cases daily? it's not great for economy & stock market. seems vaccine is still processing but not completely at all.
3. some investors will say " dollar is in bubble but stock market won't go down" they say same thing in 73s. that's not how this works. dollar inflation makes stock market volatility & shock..
4. The Buffett Indicator at All-Time Highs Is This Cause for Concern?. it shows 223% radio of market value GDP, 79% higher than long term trend line not internet bubble.
seems too higher.
5. 2021. many poor & middle bought stocks & meme from check stimulus while rich people buying at same time. this doesn't age well. "BUY, BUY, BUY" poor getting rich, rich getting richer? nah.
that's not how this works. 2008 & 2020 was different because market was bottom but 2021 Is top not bottom. that's why. Illuminati stays. in 2030, we will see 0.1% top getting richer ever while poor & middle bottom.
my prediction could be wrong or right.
Thank you. Sorry For My Bad English. Enjoy.


You know(!!) you are in a bubble ...... When:
The funding a 36-year stream of expected inflation-adjusted spending requires over 38 years of money up-front;
Every single decile of S&P 500 components is at record valuation extremes; www.hussmanfunds.com
The amount of leverage in the system (U.S. equity markets) is now easily the highest in history, by any measure, not just in absolute terms! (relative to GDP, etc. Margin Debt/GDP = Margin Debt/Market Cap x Market Cap/GDP Showing insane over-valuation across the board!);
In a world where speculators now value the stock of bitcoin at one-fifth the value of the entire U.S. monetary base;
The current SPAC mania is identical to the South Sea Bubble in as much as: "Let them see not what they do!";
In an economy with $11 trillion in corporate debt at $58 trillion in equity market capitalization;
When U.S. Market Capitalization exceeds 263% of U.S. GDP (the norm, not the low, being 78%);
Anyway, this is likely a Double Top here.

SPX 3943 + 0.1 % SHORT IDEA * REVERSAL PETTERNS & PRICE ACTIONHey everyone
Hope everyone had a good weekend, new week new opportunities. Here's a look at the S&P 500 from the 4H chart.
* The index has been trading in an ascending channel, looking for reversal pattens to capitalize on a move with the bears.
* We are trading at the formation of a doule top so should this pattern hold looking for a move with the bears.
* entries on lower time frames for marging and less risk.
* follow your entry rules on entries
* significant moves with the bulls change the plan.
lets see how it goes.
AS ALWAYS PROPER RISK MANAGEMENT AND A LOT OF PATIENCE & AGAIN many stars must align with the plan before executing the trade, kindly follow your rules.
HAPPY TRADING EVERYONE & LET YOUR WINS RUN...
_________________________________________________________________________________________________________________________
ENTRY & SL - FOLLOW YOUR RULES
RISK-MANAGEMENT
PERIOD - SWING TRADE
__________________________________________________________________________________________________________________________
If this idea helps with your trading plan kindly leave a like definitely appreciate it.
