SP500 & Channel.As you can see on these charts-the price is once again beating the channel resistance (purple dotted line). Perhaps the price will have to adjust to the level of $1950, equal to the Fibonacci correction of 0.618%. There is another more positive and desirable scenario for everyone - if there is very good news, the price will be able to gain a foothold above the purple line and go even higher-up to the pink dotted line.
Spxshort

Shooting Star forming W chartHi everyone,
It is too early to confirm it but if this candle close like this next friday on the W chart in Shooting Star or Gravestone we will have something to worry about.
Best to you !

ONLY CASE FOR A GLOBAL DEPRESSIONthis is not what i'm expecting but , if global economy is really going into a severe depression phase , then stock market can run for more unrealistic valuations before it happens.

SPX500 - distributionBefore the Chinese New Year.
I think we will go for a correction.
China is the engine of the global economy.
After the Chinese New Year I expect growth in all markets.
Push like if you think this is a useful idea!
Before to trade my ideas make your own analysis.
Write your comments and questions here!
Thanks for your support!

SP500 - SHORT; SELL it here!With the credit spreads looking like they're about to blow out, equities don't stand much of a chance here, either. Look for at least a >-11% dive here.
.... or ... SELL the Nasdaq100 ...
... as it doesn't look much different, either. A little difference without much distinction.
Here is an other clue;

US Market Technicals Ahead (25 Jan – 29 Jan 2021)As we enter into the last market week of January, investors will have lots to focus on in the week ahead with a series of major U.S. companies including Apple ($AAPL), Microsoft ($MSFT), Facebook ($FB), and Tesla ($TSLA) all reporting earnings. The Federal Reserve is to meet, and markets will get their first look at fresh GDP growth figures in the final quarter of pandemic ravaged 2020. Elsewhere, the IMF is set to release its World Economic Outlook and growth figures from Germany, Mexico and Hong Kong will also be in the spotlight.
Here’s what you need to know to start your week.
S&P500 (US Market)
The benchmark index ($SPX) recovered from the earlier week of losses, posting a weekly gain of +2.23%. The rebound have reaffirm the significance of 20DMA supporting the rally since 4th November 2020. The significance of 20DMA towards $SPX daily current price action is also observed in the various rebound highlighted in the chart (arrow), particularly thrice in December 2020 and once in January 2021.
As $SPX continues to creep up with a higher high at every bi-weekly swing, it is observed that volume is diminishing at every of this top establishment – essentially plotting out a technical bearish divergence between price rally with volume decline.
At the current junction, the $SPX remains firmly within the congested 3 months trend channel. The immediate support to watch for any further weaknesses is at 3,660 level. This level would see $SPX breaking down the highlighted trend channel convincingly, along with the first break of a minor classical support established on the opening week of 2021.
1. Earnings heat up
After leading markets higher for most of 2020, tech stocks took a backseat late last year amid a rotation into value stocks which were boosted by hopes for the economic recovery promised by vaccines.
That shift has stalled in recent days as investors weighed lackluster outlooks from big banks and a blockbuster quarterly report from Netflix ($NFLX) that saw shares climb 17%.
Microsoft ($MSFT) reports after the close on Tuesday, followed by Apple ($AAPL), Facebook ($FB) and Tesla ($TSLA), which recently joined the S&P 500, a day later.
The results could push the combined market cap of the FAANGs – Facebook, Amazon ($AMZN), Apple, Netflix and Google-parent Alphabet ($GOOGL)- back above their all-time peak of $6.16 trillion.
2. Fed meeting
Fed policymakers will hold their first meeting since Democrats last week took control of the Senate, which has increased the likelihood that new President Joe Biden’s proposed $1.9 trillion stimulus package could be passed.
The Fed is not expected to make any policy changes at the conclusion of its two-day policy meeting on Wednesday and is likely to reiterate that the economy is still far from its goals of full employment and 2% inflation.
There is some speculation among investors that increased government spending to boost the recovery could prompt the Fed to begin tapering its massive bond-buying program as soon as the end of this year.
But Fed Chair Jerome Powell said earlier this month that “now is not the time to be talking about exit.”
3. U.S. GDP data
Market participants will get their first look at how the U.S. economy performed in the fourth quarter from Thursday’s figures on gross domestic product after already weaker consumer spending numbers and falling employment in December.
After a record 33.4% annualized rate of growth in the third quarter, economists are forecasting growth of 4.0% in the final three months of the year. The economy is expected to have contracted by 3.5% for the full year.
The economic calendar also features data on durable goods orders on Wednesday, initial jobless claims numbers on Thursday and personal income and spending data on Friday.

US Market Technicals Ahead (11 Jan – 15 Jan 2021)Market will likely be focusing on the prospects for a bigger stimulus package after Friday’s employment report showed the U.S. economy shed jobs for the first time in eight months in December amid a resurgence of Covid-19 infections. A further snapshot of how the economy is performing will be presented with upcoming Friday’s release of data on inflation and retail sales.
Additionally, earnings season will get underway with major US banks set to release fourth quarter earnings results on Friday.
Here’s what you need to know to start your week.
S&P500 (US Market)
The benchmark index ($SPX) continued with a 3rd consecutive week of rally, closing with a modest gain of +1.83% (68.6 points) for the opening week of 2021. This rally have continued to establish a new all time high level at 3,826 points, also breaking out of a 9 weeks trend channel congestion that was highlighted over the weeks.
With plenty of eutrophic moves in highly speculative themes over the past weeks (i.e. Electric Vehicles, Bitcoin, Alternative Energy and Biotechnology), there were observation that some of the previously market-leading mega cap companies are not in participation of the week’s rally. Several of the higher profile companies, particularly the FAANG, remain either in a consolidated triangle chart pattern, or a box ranged rectangular chart pattern. Additionally, $SPX traded lower on the first two days of the year, with the month long highest sessional volume observed on Tuesday alone.
At the current junction, the 20DMA have been nicely supporting $SPX in rally since 4th November 2020. The significance of 20DMA towards $SPX daily current price action is also observed in the various rebound highlighted in the chart (arrow), particularly thrice in December 2020 and once in January 2021. There is also a significant pick up in trading volume since the start of 2021, and it is imminent for market volatility to further uptick towards a 50 points ATR14 range within the next two weeks.
The immediate support to watch for any potential weaknesses is at 3,780 level, a confirmation retracement for Friday’s Bearish Hanging Man candlestick pattern.
Top 3 things to watch this week:
1. Stimulus hopes
Stocks closed at record highs on Friday, despite data showing the U.S. economy suffered its first net loss of jobs in eight months in December, after Biden said his economic relief package will be in the trillions of dollars.
Biden said his administration’s economic package will also include unemployment insurance and rent forbearance. The package is due to be unveiled on Thursday.
2. Economic data, Fed speakers
The U.S. is due to release data on consumer price inflation on Wednesday, while retail sales figures for December are due out on Friday. Inflation is expected to tick slightly higher, but remain subdued, while retail sales are expected to have been dampened by the surging virus.
Fed Chair Jerome Powell is to speak on Thursday. The U.S. central bank has indicated that interest rates will remain on hold near zero through at least 2023 and said the path of the economy will depend significantly on the course of the virus.
3. Banks kick off earnings
Big banks will kick off the U.S. corporate earnings season in earnest with JPMorgan (NYSE: $JPM), Citigroup (NYSE :$C) and Wells Fargo (NYSE: $WFC) posting fourth-quarter results on Friday – the first S&P 500 companies to report for the last quarter of coronavirus-stricken 2020.
Some investors expect company earnings and economic data to play a greater role in moving stock prices this year.

SPX vs. NIKKEI225 SELL; Massive SHORT!!SHORT this spread endlessly!!
Here is the Weekly
The "math" bears this out, readily! NIKKEI225 has a 13%-15% advantage - including FX - over the SPX. This is by far the best Equities/Risk spread out there if one must be long equities. (... which one ought Not to want to do under any circumstance, at these levels! :-)
Here is the FX component - USDJPY

UVXY bounces on pre-March 2020 crash supportUVXY which is a 3x leveraged etf tracking the VIX(volatility index or in simple terms fear in the market) has bounced from the pre march stock market crash support of around $10.5. The RSI has registered higher lows while the OBV looks like more shares are being accumulated. Plus the trading volume has increased considerably over the past few months.
Possible reasons for more upside:
1. Short term correction in S&P after the long 2020 bull run despite the economy being in shambles. Also the greed index is very high with wide consensus that the market will keep going up forever. Possible rotation of large investment bank funds from equities to safe havens such as gold and bitcoin.
2. New stimulus bill not being passed for $2000 instead of $600.
3. Trump not conceding & other election uncertainties.
4. Iran & Israel/US standoff. Israel submarines and US aircraft carries are near the strait of hormuz.
5. China & India standoff. China deployed large amounts of radars & air force personnel in the Ladakh border.
6. Another country wide Covid shutdown due to a new strain.
7. Vaccine delays or issues of unintended side effects
8. Trade wars affecting supply chains. This is already happening.
Possible reasons for downside:
1. Fed injecting more magic money into the system.
Suggestions:
Buy some January & February call options . Do not hold this long term. It has a high decay due to being 3x leveraged!
Move funds into undervalued sectors such as commodities.
Note:
This is not financial advise. Please do your own research.

What are your ideas?
TVC:SPX
If you liked the analysis, follow me so that you can be informed of the analysis in the shortest possible time.
Support me with your likes and comments
SPX is facing bullish pressure, potential for more upsideDescription:
Price is facing bullish pressure from our pivot level and showing room for possible further bullish momentum. We see a medium probability bullish scenario above our pivot 3639.9, with 1st resistance at 3783.0 as a possible target. Failure to hold above pivot at 3639.9 would see price swing the other way towards 1st support at 3590.3.
Pivot: 3639.9
Supporting Points:
38.2% Fibonacci retracement, 61.8% Fibonacci extension, Graphical overlap support
1st Support: 3590.3
Supporting Points:
Graphical swing low support, 61.8% Fibonacci retracement, 127.2% Fibonacci extension
1st Resistance: 3783.0
Supporting Points:
161.8% Fibonacci extension
Trading FX & CFDs carries high risk.

A Planned Formation - WedgeSPX is clearly extending above levels of speculation and lacks reality.
evaluating crisis based on impact, it is clear COVID is the dominator.
The price does not accurately represent the current state of the economy, not just in the US but around the world, it is clear we are in times of turmoil.

SPXUSD SELL TP_3232.4_10.44%_376.8pips_SL_3676.1_1.85%_66.9pipsSPXUSD SELL TP_3232.4_10.44%_376.8pips_SL_3676.1_1.85%_66.9pips

SPX losing streaming SPX is losing its streaming on daily just like starting from 12 Oct each day closing lower than its previous. Near supports are 3510, 3487, and 3406. Definitely, this is base on technical unless some other news catalyst invalidates this trend.

No Election Winner For Weeks, No ProblemElection day is finally here. My wave projections have changed a little, but not for the worst. I previously suspected us to be near the end of a major Grand SuperCycle, but I no longer believe that is the case. I shifted some of my waves around after running multiple tests and found a different mapping of the waves provided for more consistent ratios of wave lengths and movements. I previously had the “COVID crash” ending at Cycle wave 4 and leaving us about 18 months to complete the final Cycle wave 5. I now have that bottom in March ending Cycle wave 2 after it began in September 2019. Furthermore, instead of Cycle wave 1 only lasting a few years (2009 to 2011), I now had it run 9 years (March 2009 to September 2019. This all means the major market crash I was projecting in 2022 is now pushed to 2030 or later. Also, we are in for a major market boom beginning this December.
But first, we must move down. The next few weeks will likely be difficult as we wait for results, legal challenges, and other circus acts. I believe we are in the early stages of Intermediate wave 2. The top we find today, or likely found this morning will be the end of Minute wave 4 and we should find the end of Minute wave 5 / Minor wave A on Thursday around 3150.39. We should tick up for Minor wave B until around November 20 with a top around 3384.68. We should finally end Intermediate wave 2 in mid-December (Dec 14-17) around 3024.09.
THE NUMBERS
Why those levels on those dates? Intermediate wave 2’s typically retrace the length of wave 1 by 34.49%. This would have wave 2 lasting about 48 trading days. Of those days, wave A normally comprises 37.55% (18 days), B is 25.20% (12 days), and C is 37.24% (18 days).
Intermediate wave 2 typically retraces the movement of wave 1 by about 45%. The minimum retracement over the past 88 years is 28.84%. I am conservatively sticking with a retracement around Fibonacci 38.2%. This would have wave 2 ending around 3021.44. Wave A typically accounts for 77.9% of the wave’s overall movement which would equate to a drop of 399.46 or a bottom around 3150.39. Wave B makes up 45.69% of the total or a rise of 234.29 points with a top around 3384.68. Finally wave C accounts for 70.32% of the larger wave which is a drop of 360.59 with the bottom around 3024.09.
REAL WORLD CAUSATION
Why the roller coaster? Lack of a clear winner tonight will likely cause some anxiety, additionally multiple states will not have all ballots counted until early next week. We may get the first glimpse of a projected winner after that but Congress must make it official and the lawyers on either side will likely be busy. Right now, Electoral College vote is set for December 14 and the lame duck Congress would certify shortly after. Once the winner is declared the jubilation will begin. I think I know who wins based on the trajectory of the market. We are about to start Intermediate wave 3 in Cycle wave 3 in Primary wave 1. This will lead to huge gains on continued cheap debt. The market is working on its day of reckoning when debt will be due. This date will be catastrophic, especially if we have another decade or more of cheap debt to rack up. Beyond 2030 will certainly see a prolonged great depression, but worrying about that now is unnecessary as the event is inevitable.
If the index moves above 3466 before it drops below 3234, my projections and even wave structure could be wrong. We shall see. Let me know where you think this mess is going. Thanks for reading.

Get Ready For November 3rd (S&P 500)Uncertainty will cause a minor drop. But things should pick back up as long as D.J.T stays president. This is how I'm looking to play things if you disagree let me know why I'd love to hear from you.
This is a MACRO trend analysis so I'm leaving some room for breaking news and price action.

S&P500 Performance In US Election. What to Expect This Week?Only two days left until the elections and Wall Street is bracing itself for the next president of the United States - Trump or Biden.
US Elections have been and are always expected to be an extremely volatile event worldwide. Elections, similar to other political or banking sector events, are notably treated by market participants with anticipation and speculation.
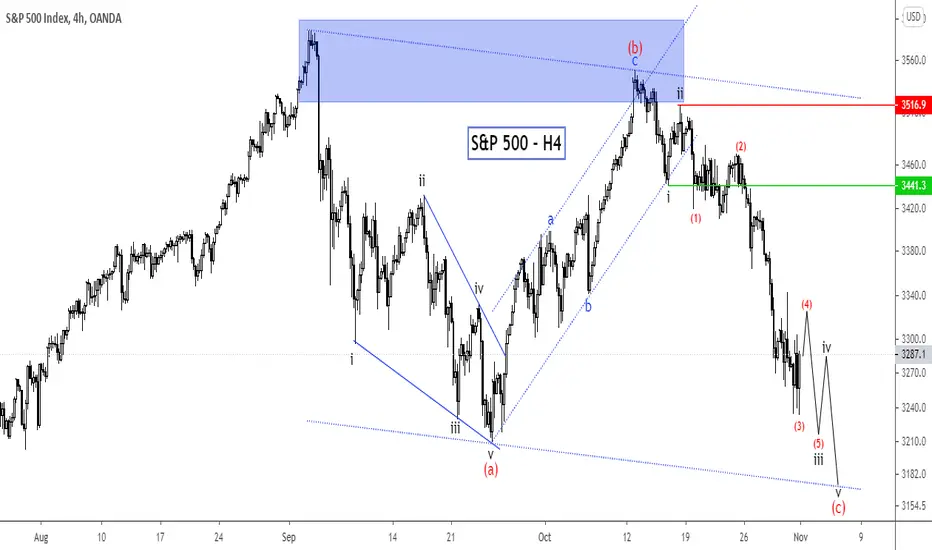
Last week, the S&P 500 has taken its deepest dive, dropping 5.5%, while the US GDP increased by a surprising 31%. Below is my previous analysis of S&P500 and how Elliot Wave prepares us for the crazy decline.
What to expect during the week?
The chart above shows that SPX decline is still making an incomplete five-wave impulse sequence. The price is expected to keep heading lower and selling the rally after a short-term swing higher is ideal. The price has the potential to retest the lower boundary of the channel to complete the bearish sequence.
What's your view on S&P500? Let me know in the comment.
Safe Trading!
Veejahbee.
SPX Wave (2) Correction The S&P corrective wave (2) with support levels at 3032 and 2871setting up for an decrease into short term corrective wave (2). So far, volatility of the overall markets has increased and we’re looking to deploy some downside hedge on the overall markets with some butterfly spreads or verticals. Exact trade details on Video Update.


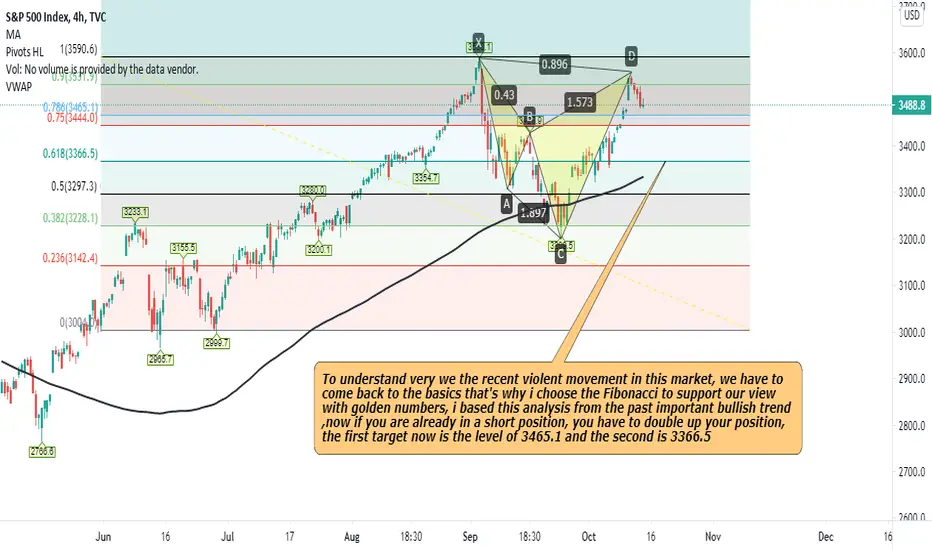
SPX AND THE BIG SHORT To understand very we the recent violent movement in this market, we have to come back to the basics that's why i choose the Fibonacci to support our view with golden numbers, i based this analysis from the past important bullish trend ,now if you are already in a short position, you have to double up your position, the first target now is the level of 3465.1 and the second is 3366.5
Macro Bearish Trend on US Dollar IndexThe scenario above is an incredibly bearish macro trend I have noticed in the US Dollar Index.
The base trendline shows a convincing downward trend that has been forming since the start of the 1980’s.
Peak 1 shows us that the strength of the USD was at a peak of 164.72 in March of 1985, representing a +94.37% increase that occurred over the course of 1,796 days. The crash that followed was the longest experienced in the trend, representing a -52.44% loss over a 2,832 day period.
Peak 2 shows us diminishing strength over the longer-term and peaks at 120.33 over the course of a 3,196 day bullish run of +55%, followed by a crash triggered by the 2000 bubble. The crash lasted 2,465 days and represented a loss of -41.04%.
Peak 3 is in the midst of forming and if my analysis is correct, it represents a bullish run of +44.4% over a 4,354 day period. The predicted crash will run the course of 2,072 days and represent a loss of -40.2% from the peak experienced during COVID-19 market crash on the day 03/23/2020. My prediction for the index is that it will continue to downtrend towards the first major support and then begin to enter a resistance phase, possibly showing signs of recovery sometime between December 2021 and December 2022. The Index will break the support zone and slide past the final support zone towards my target price. The target price is 61.96 on December 1st of 2025.
I noticed a relationship that as the index has moved through time, the bullish run on all 3 peaks has increased in duration but has decreased in the total percentage change. For the bearish scenarios, all 3 have decreasing durations but also have decreasing percentage changes.
Recently over the past 6 months, the dollar index has been moving in a fairly close to perfect negative correlation, in which the dollar index is rapidly losing value as equities are climbing to all time highs. There have been other examples of this negative correlation at play, such as when the dollar index was on the rise as the Dot Com bubble was playing out. These negative correlations never hold up and the markets always follow in the direction of the Index or vice-versa, which leads me to believe an inevitable crash is on the way. I will be doing another post on the correlation between the S&P 500 (SPX) and the USD Index (DXY); showing exactly how I think this could play out.

SPX500 and ANOTHER DIP before it goes UP!Hey tradomaniacs,
SPX500 is testing a very great zone to sell as we might see lots of bearish confluence here.
Orderbook still showing bulls to protect the previous buy-zone but now we see more sell-stackings incoming.
We might see another dip down before it actually goes up again.
I still trade SPX500 with my hedge-strategy and use these chances to stack shorts before I go long again if we get confirmation for this idea.
LEAVE A LIKE AND A COMMENT - I appreciate every support! =)
Peace and good trades
Irasor
Wanna see more? Don`t forget to follow me.
Any questions? PM me. :-)

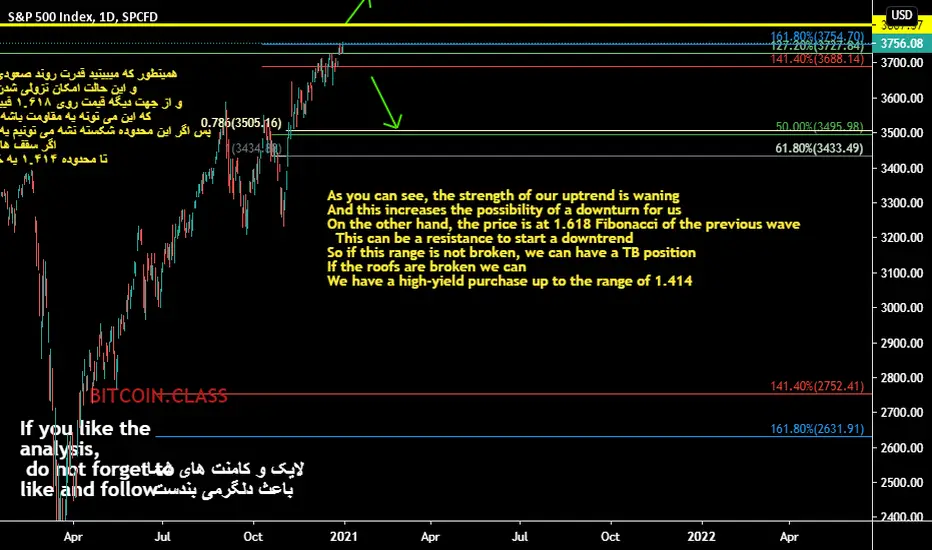
S&P falling in a accelerated phaseS&P
----------------------------------------------------------------------------------------------------
Good day friends Hope you all like our analysis do follow our profile so that you can get every new updates and trade related tips and ideas
----------------------------------------------------------------------------------------------------
The S&P was declining in a accelerated phase as compared with the recent stocks rally .The deeper correction has started on September 03 And the index value fall below the .50 Fibonacci retracement And even felled below the 0.618 Fibonacci retracement
The series of Higher high , Lower low , Lower high and Lower low pattern was forming in a downward parallel channel
The index value also falls below the 03 Moving averages and the potential target would be around 3100.00
----------------------------------------------------------------------------------------------------
Kindly share your ideas and thoughts in below comments section
