SPX so far so goodFirst target is at 3808-09SPX We came super close to it
Next and most important target is at 3789SPX, closing below will be bearish.
Im looking for a low into EOM, will it be a re-test of Oct 2nd lows or just 3680-3720 I have no idea, today AHs will be a telling story
Spxsignals

Trend channel is brokenIm not buying till at least first support is tested.
Tomorrow should mark the top if it was not done today.
Im not trading the "last move up" as it might or might not come.
Those who are in ATH camp will get destroyed like they were all this year.
Its not going to bottom (for the year) till Nov low and the bottom would not come will Apr/May next year and it can be so much lower from where we are now!

SPX my pathway for the next week or 2First of all I want to say thank you to my 1k+ followers as of today!
Means a lot to me, as it shows me that my work helps others to navigate the markets and my time spent posting charts gets respected.
Solar eclipse! Seems we have topped here, at least for now
There is also a lunar eclipse on Nov 7-8th, watch for a possible higher high if not lower high there.
So my pathway is down to 3689 or so, then up to 3908 or so and only after we go down to 3500SPX level again
Again, I do think we will re visit Oct 2nd lows at min, so that move could be it.
If this pathway will play out up to Nov 2nd, then I will be huge long from that level going into the Midterms and short that lunar eclipse high.
If in fact this all plays out, I do believe we will see my 3212SPX by Nov 21st week if not 2855SPX
This is my game plan, I do have a right to change it at any time if I see changes going against my pathway.
Have a good night and please dont forget to press that 🚀 button to push this chart up so more people will see it.

SPX updateI have missed all todays rally, had only a long from 3792 and exited at 3805
My swing short isnt in a best shape, but I have protective longs going till they stop working.
Maj resistance today is 3798SPX and its going to close above it.
Next maj resistance is at 3907 on daily and 3913-14 on weekly
Today is a solar eclipse day, usually markets top on or around solar eclipse day.
Im not buying this move up, its just all 3 waves moves up with extensions, nothing else.
The price is already getting to overbought zone and the fear and greed is already in neutral zone and getting close to cross the greed zone.
VIX is in support zone, but close to be broken to the downside, still lots of room there.
SPX supports are at 3825 and 3808-07 and then maj support is at 3789SPX
I have some price confluence in 3900-20SPX zone as mentioned yesterday and closing above 3820SPX will confirm that target.
Watching the price and 3820-25SPX test to enter with longs for 3900 target
SO far there is a small H&S on ES and NQ on 15min, not touching anything just yet.

SPX nothing much to add, still no confirmation of a breakoutIdeal target if the re-test of a broken flag holds
3798SPX is what Im watching on closing level.
Daily chart is setting up for a squeeze to 3900+
So lets see what the close number brings

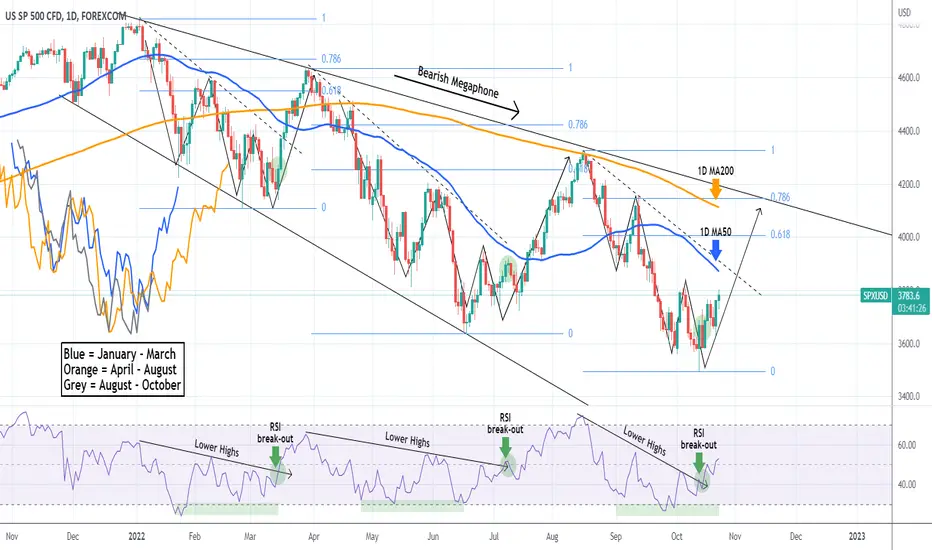
S&P500 Huge confirmation of our bull pattern repeat.Right on the October 13 2022 low, when the CPI number came out higher than expected and the market was in extreme fear mode, we posted the following idea on the S&P500 index (SPX), explaining how fundamentally the report was still lower than the previous month and more importantly how technically the index was flashing some early signs that it would repeat the previous two rebounds on the Megaphone's Lower Lows on February 24 and June 17:
As you see, our expectation is so far being materialized as 10 days later, the index hasn't just avoided making a Lower Low going against the majority's belief on the CPI but also rebounded on the exact same day and is testing the October 05 High/ Resistance. This time we will see this in more detail, focusing on the 1D RSI.
As you see, when the RSI broke above its Lower Highs trend-line, the rebound basically started and on both previous sequences, it was as early as anyone could get. This time (October 14), it appears to be even earlier. The 1D MA50 (blue trend-line) is just above and if the current Lower High leg follows the previous two, then it should break rather fast and target just above the 0.618 Fibonacci retracement level, which as you see is where the 1D MA200 (orange trend-line) is headed. This trend-line is critical as it was exactly where the August 16 Lower High was made and the price was rejected, so right now is the most important long-term Resistance.
As with the previous analysis, we have plotted all Lower Low/ Lower High sequences on top of each other with Blue being January - March, Orange April - August and Grey August to October (now). It is evident that all are very similar and compared to the previous ones, the current S&P500 levels constitute still a good buy opportunity, at least on the medium-term. For the long-term, the price has to break above the Bearish Megaphone's top (Lower Highs trend-line), which is the pattern that has been dictating the 2022 Bear Cycle so far.
-------------------------------------------------------------------------------
** Please LIKE 👍, SUBSCRIBE ✅, SHARE 🙌 and COMMENT ✍ if you enjoy this idea! Also share your ideas and charts in the comments section below! This is best way to keep it relevant, support me, keep the content here free and allow the idea to reach as many people as possible. **
-------------------------------------------------------------------------------
You may also TELL ME 🙋♀️🙋♂️ in the comments section which symbol you want me to analyze next and on which time-frame. The one with the most posts will be published tomorrow! 👏🎁
-------------------------------------------------------------------------------
👇 👇 👇 👇 👇 👇
💸💸💸💸💸💸
👇 👇 👇 👇 👇 👇
SPX is in mid range decision pointHappy Sunday everyone
Here is a 4h chart.
We are getting close to the breakout point, has to hold at that upper trendline
Main resistance is at 3775SPX, dont rule out a fakeout into 3800 to finish up C wave up.
- If breakout happens, will be watching for the test of the breakout trenline from the bottom and if broken out from the top.
- Will do a long trade on the test with a tight stop (if breakout happens)
- 3800-20SPX will be a very important level to watch or 3798SPX on closing level (bull/bear closing number)
- above 3820SPX we will see 3910-25SPX
Few things to mention:
- TRIN is at .69 on Fri close (can mark a top or within 2 days)
- VIX at support
- All main moving averages are pointing down
- Bull flag broken to the upside on Fri (something to pay attention to!)
- Right shoulder is getting close to invalidate, watching
Will be watching 3800 and 3645 SPX levels this coming week.
We have a directional change tomorrow as well as following Tuesday.
My thinking we will turn down hard on Monday and bottom on Tuesday fulfilling cycle low on the 24th
Then rally into the 27th high and down again into EOM or 2-4th of Nov
Will be looking a rally after the Midterms, which will be short lived.
A maj low on week of Nov 21st and then rally into Jan
Nov low will be a good swing long imo will be looking for dips to buy after that low is behind us.
Will post long term view next

SPX is in decision modeIm always honest with my homework, I dont like to have several counts to be always right.
At this point Im seeing both scenarios:
1 - We break the orange trendline and we are off the races to 3900-4000 (not preferred)
2 - We break 3500 or Oct 2nd low, we see 3380-3410 at min!
I'm in lower lows camp, as you know. But the window for the strong move down to start is just almost out, has to start tomorrow!
- The bull flag noted on the chart cant be unnoticeable! If it breaks, that's it for lower levels until Midterms!
- On the bear side, we have perfect H&S as well as the price being so weak and bounces being so muted, its ready for the crash to start, it just needs a little help to push the markets off the cliff!
Will we have that catalysis? I bet yes, the question is when!
Will repeat again, November is a panic month. Can be an avalanche of events! War, elections, bonds going off the roof, all the economic issues around the globe.
My conclusion here is this:
- Im net short, I will flip if we get above that trendline shown on the chart and enter on re test. I dont want to do it as it will cost me in stop losses
- Im not adding to short till we break 3500 or Oct 2nd lows!
- If we break, we will see 3380-3410 and then should have a good bounce to 3500, then it will be another perfect show for a move down to at least 3200-10!
Have a good night everyone!
P.S. Please press that rocket button below, push this chart up for others to see.
Also feel free to share my charts with anyone, lets get 1k followers, means my work is important for others to see.

SPX broke down, nothing changed since amHi everyone,
I slept in today and did few things around house, needed some time off the screen.
Yesterday wasnt a good day for me, I had some losses with stops, its not an easy market to trade, too wide stops get triggered as well.
Im doing swing trades now only till the first extreme hits.
So far its short the rip game and Im looking for the first test of 3650SPX
Targets to hit are on the chart
- 3640
- 3580
- and then new lows!
Im still expecting down move to new lows, crash scenario is off the table.
At least that is not what Im warred about.
BUT I still expect 3212 within a month time frame and ideally 28 handle (super ideal is 24 handle:)
Shoot me questions, Im on my computer now!
Will post other charts next.
VIX to hit $60+ imo and that could be my 28 or 24 handle

SPX500- Will it drop to 3k in medium term?In this analysis, I discuss SP500 using Russel2000 as a leading indicator and try to figure out what can follow for US stocks and if the drop will continue.
In my opinion stocks are not out of the woods yet and another 20% drop is looming on the medium term

S&P500 Bullish Divergence on RSI targets 4000 short-termThe S&P500 index (SPX) has been trading within a Bearish Megaphone pattern through this Bear Cycle of 2022. Since August 31, despite having the candle action on Lower Lows, the RSI on the 4H time-frame has been on Higher Lows, i.e. flashing a Bullish Divergence. The only other time that this took place within this Bear Cycle was early on from January 21 to February 24.
As you see on this chart, during that early 2022 sequence, when the RSI broke above its Lower Highs, the price also broke above its 4H MA50 (blue trend-line) and targeted the top of the Bearish Megaphone within the 0.618 and 0.786 Fibonacci retracement level. The 0.618 Fib is currently just over the 4000 level.
Also note that yesterday the 4H MA100 (green trend-line) crossed below the 4H MA200 (orange trend-line) forming a Bearish Cross. The last time we had that formation was on February 24, exactly on the (short-term) bottom at that time.
-------------------------------------------------------------------------------
** Please LIKE 👍, SUBSCRIBE ✅, SHARE 🙌 and COMMENT ✍ if you enjoy this idea! Also share your ideas and charts in the comments section below! This is best way to keep it relevant, support me, keep the content here free and allow the idea to reach as many people as possible. **
-------------------------------------------------------------------------------
You may also TELL ME 🙋♀️🙋♂️ in the comments section which symbol you want me to analyze next and on which time-frame. The one with the most posts will be published tomorrow! 👏🎁
-------------------------------------------------------------------------------
👇 👇 👇 👇 👇 👇
💸💸💸💸💸💸
👇 👇 👇 👇 👇 👇

SPX 2 pathways, all the same resultMorning everyone,
I sleep in today and missed am short, sold my puts from yesterday at 3620ES zone though, re entering those now again.
The price hit my 3720-30 (as per my yesterday's update) zone in am, was an amazing short and I missed it!
I see 2 possible pathways:
- first is the price is working on the right shoulder and will push much lower next week. My ideal pathway
- second is the touch of the upper channel of the trend channel ABC black line.
If second, we should touch 3600 and hold, then push for the final move to hit 3815-20SPX
Its Friday, do not over trade, let the trade come to you and then press!
Im swing short into EOM!

SPX is on the thin ice, can break any timeThe fall will be big imo, there will be a very long red candle, when I have no idea, but its getting close
Ideal target is 3680 and 3700, then 3735-45SPX

SPX main target for the whole move down is at low 2400!Sometime things are super simple!
This low wont be even lower then 2020 lows!
I did expect the 2020 lows to be re-visited since Jan-Feb of this year!
Well its coming imo
Will it be Oct-Nov low or extend into 2023 Mar/Apr low, I dont know.
I would like to see that low to be seen in Nov and Q1 next year to be a higher low.
Then we rally so hard into 2025-26!
Have a good night

SPX weeklyIs anyone a candle pro?
Usually it gets resolved in a direction its started, the first candle.
How it has to close tomorrow to be a valid pattern?
Please post below

SPX keep an eye on this formationIf and when it falls, the target will be much lower from where we are now.
Todays rally, can very well extend into tomorrow and hit the upper part of this chart 3730
So far its a perfect trap imo.
This month will be crazy volatile!

SPX is at Very Very Very Dangerous zone!Hi everyone,
Im on vacation from Sunday to next Sunday, but I will be trading and will be still posting updates.
I dont want to call for a crash here, chances for it are super slim.
Any trade must be protected with a stop and only you as a trader can make the decisions on what to do with the information you're getting.
Must do is your own homework!
Again do not mortgage your house and go all in as this can be a very well one big bear trap!
Im looking for that final move to be over by end of Oct or early Nov regardless. (updated about this last week Thursday or so)
My target zone is 34 handle by the time window outlined above with ideal target being 32 handle.
Below it, the markets are in real troubles!
Can it be a crash, I don't know, I'm too far out to predict such things.
Here is my quick but important update:
- I wont rule out another low on Monday am and in fact I will be shorting on Sunday if we get a bounce.
- That low can be lower 52 week low or just 3610SPX test
Levels of importance
- 3640.50 (again)
- 3610, below this level comes
- 3550-40
- 3511
- 3480-85 all SPX
Resistance is at 3735-45; 3775-85
Here is my 1h chart
On this chart I have outlined support levels, when/if broken you know whats coming next!
IF we get a strong rally into Wed, I will not be holding longs at all, line none! I will only do options (puts) on what Im ready to loose.
So here is a clue to how low this can fall in a very short time:
- check the fibs from the low of 2009 to the high this Jan, check where is 78.6% retracement is

S&P500 CPI higher than expected. Can it repeat this bullpattern?The U.S. CPI came in higher than expected at 8.2% against a 8.1% forecast but lower than the previous month (8.3%). It remains to be seen how the market will react to that.
Technically though, the bearish leg of S&P500 (SPX) since the August 16 Lower High within this 2022 Bearish Megaphone, is close to completing the exact same pattern of the previous two bearish legs, after which both rebounded aggressively above the 1D MA50 (blue trend-line) to form a Lower High within the 0.618 - 0.786 Fibonacci retracement zone above the 1D MA200 (orange trend-line). The 1D RSI has been on a similar structure as well.
The 0.618 - 0.786 zone is within 4007 - 4145 and the 1D MA200 at 4145 (and falling). Do you think the S&P500 will ignore the higher than expected CPI and repeat the pattern by completing it on a rebound?
P.S. For better comparison purposes I've plotted all fractals on top of one another (blue, orange and grey lines).
-------------------------------------------------------------------------------
** Please LIKE 👍, SUBSCRIBE ✅, SHARE 🙌 and COMMENT ✍ if you enjoy this idea! Also share your ideas and charts in the comments section below! This is best way to keep it relevant, support me, keep the content here free and allow the idea to reach as many people as possible. **
-------------------------------------------------------------------------------
You may also TELL ME 🙋♀️🙋♂️ in the comments section which symbol you want me to analyze next and on which time-frame. The one with the most posts will be published tomorrow! 👏🎁
-------------------------------------------------------------------------------
👇 👇 👇 👇 👇 👇
💸💸💸💸💸💸
👇 👇 👇 👇 👇 👇

SPX still looking for that bounceThis is what I see, a formation of H&S
This still can test 3545-55SPX level before reversal. So careful with sizing here
3610SPX is still maj bull/bear number on the closing level for today.
Im long into CPI, will re assess before the numbers

SPX last night email update chartMorning everyone,
Im sharing my last night work with you here. This was sent out to those who are on my email list.
It was a long update, I will copy paste only important stuff here:
I think we get Jun low to Aug high type of move but much faster.
Looking at the zoomed in chart (4h white background chart)
- You can see that I expect to have a deep pullback into Fri (ideal target is 3680-70SPX), another move up from there either to 3875SPX to finish up the whole move up of this 4th wave.
- Or we get Jun to Aug (but faster) move off the lows and get a move from upcoming Fri low back to 3785, down to 3645 and final strong move up to 4040-4100SPX. This pathway will make the next high not mid month but closer to the EOM (making higher monthly close)
After mid or end of the month high expect the final move down early Nov to finish up the whole move down of A wave from Jan high and mark the low for the year.
Targets to hit:
- If the price makes 4040-4100SPX , then the first target will be back to just a bit under 3600SPX
- Ideal target zone is 3475 and 3389-95SPX
- 3212SPX is the extended target
Trading plan for the rest of the week.
- Looking to start taking off my swing short at 3715-20SPX level and will start layering with longs there 25%
- Exit full short position at 3670-80SPX level and get 50% more longs to make it 75% long position
- In case we hit (less odds) 3640SPX I will be 125% long, otherwise I will add on a move above 3755-3760 test and hold.
On the simple daily SPX chart 110MA is below 50MA can be the main target to hit next, need to close above the mid Bollinger, which I think will happen on the move up after Fri low.
I really think the price should close the last gap from 3678SPX before the move up resumes.
I want to see a price gap down below 3750 from the open to have my plan playing out.
3640SPX is a very important number to hold on any closing level!
Numbers of importance for tomorrow:
Resistance:
- 3876SPX (closing above should see 3960SPX next)
Support:
- 3749-50SPX, closing below should see below 3700 next
- 3715-20SPX
- 3670-80SPX
- 3640-45SPX

Looking for a day pullback and continue higherStill think we hit 3830-50SPX at min.
Next pullback will be a telling story if we can get to 39 handle or not.
Main support is at 3715 now and one more at 3735SPX

SPX gapped above 3735The price gaped above the main resistance line, there is noting much but air above.
Main target is 3850 now, while first resistance is at 3788-90SPX
Any pullbacks should be bought imo, especially 3735-15
Level of importance is 3715 on closing level, must hold on any closing to continue higher

S&P500 Broke above the 4H MA50. 3900 next?The S&P500 (SPX) index broke above its 4H MA50 (blue trend-line), which as we mentioned on our previous analysis, it was the bullish break-out signal. In fact the current post is an update to the post Rate Hike analysis made on September 22:
The pattern remains the same and so does the current price action that appears to be replicating the late August - early September leg. As you see, when SPX broke above the 4H MA50, it was on the same MACD pattern as today and the subsequent rally hit not only the 4H MA200 (orange trend-line) but extended as high as the 0.618 Fibonacci retracement level from the previous High. If completed, the 0.618 would fall exactly on the Lower Highs trend-line that started after the August 16 High.
You can approach this in segments. First target the 4H MA200 or the 0.5 Fib and if you want to assume some more risk, pursue eventually the 0.618 Fib. This pattern may be invalidated if the price breaks below the 4H MA50, in which case we will be looking for the 1W MA200 as our target again (red trend-line).
-------------------------------------------------------------------------------
** Please LIKE 👍, SUBSCRIBE ✅, SHARE 🙌 and COMMENT ✍ if you enjoy this idea! Also share your ideas and charts in the comments section below! This is best way to keep it relevant, support me, keep the content here free and allow the idea to reach as many people as possible. **
-------------------------------------------------------------------------------
You may also TELL ME 🙋♀️🙋♂️ in the comments section which symbol you want me to analyze next and on which time-frame. The one with the most posts will be published tomorrow! 👏🎁
-------------------------------------------------------------------------------
👇 👇 👇 👇 👇 👇
💸💸💸💸💸💸
👇 👇 👇 👇 👇 👇
