S&P500 First MACD Bullish Cross formed since March 15The S&P500 index (SPX) has been trading within a Channel Down ever since the January 04 2022 All Time High (ATH). Recently (May 20) it hit the Lower Low (bottom) trend-line of the Channel for the third time (Jan 24 and Feb 24 the others) and rebounded reaching the first Fibonacci extension (0.236 Fib).
Perhaps even more important than the dynamics that a rebound on the Lower Lows trend-line creates is the fact that the MACD on the 1D time-frame has just made yesterday a Bullish Cross. That is the 4th time within this pattern we see this pattern forming. All previous formation have kick-started rises (+8.90%, +7.50% and +12.00% respectively in chronological order).
As a result, a minimum of +7.50% rise would see the index hit roughly 4090 and the 0.5 Fib, while a maximum of +12.00% would get it to around 4275 and the 1D MA50 (blue trend-line). A break below the recent Lower Low though may be enough to push the price even lower to the 2.0 Fib extension around 3630.
--------------------------------------------------------------------------------------------------------
Please like, subscribe and share your ideas and charts with the community!
--------------------------------------------------------------------------------------------------------
Spxsignals

S&P500 The 6M chart that helps us not lose perspectiveThe Standard and Poor's Index (S&P500 / SPX) has been on a strong correction these past roughly 6 months. For that reason, we present this analysis on the 6M time-frame, where every candle represents 6 months of price action.
** The RSI indicating where we are **
It is not a surprise that the current one is in deep red as its whole price action has been the aforementioned correction phase. The 6M RSI (pane below the chart) offers a valuable insight on where SPX may stand on the long-term as compared to the past mega-Cycles, which keep repeating throughout the history.
** Periods of recession **
As you see, the RSI broke below its MA trend-line (yellow line) for the first time since the first six months of 2012. Practically this was when the market confirmed the recovery from almost a decade long period of extreme uncertainty and volatility that was fueled by the two major crashes, the DotCom and the Subprime mortgage crisis. Historically, the last similar period was the roughly 10 years that followed the early 30s Great Depression.
** Same as in mid 50s **
Back to the RSI. The last time the indicator broke below its MA line, being that high (around 85.00) following the recovery from a Recession, was in the second half of 1957. Both are marked with a circle. The market posted only one red 6M candle and then steadily recovered. In fact as long as the 6M MA20 (green trend-line) was supporting, the index was making Higher Highs. Once it broke, it made a Lower Low and then after a Higher High, it broke even lower to touch the 6H MA50 (blue trend-line). That held and kickstarted a period of highly aggressive stock growth until the DotCom crash.
** The MA20 and MA50 being the multi-decade Support Zone **
Note that during both RSI breaks below the MA, the index has been way above the 6M MA20. In fact, the last time the index (almost) touched the 6M MA20 was during the March 2020 COVID crash. Notice how basically the MA20 and MA50 form the multi-decade Support (Buy) Zone since practically 1943.
** Conclusion **
This historic pattern suggests that if the current price action is modelled out of it, then the current correction shouldn't go past June and as long as the 6M MA20 holds, the S&P500 index is up for a sustainable decade of Higher Highs and Higher Lows where dips near the 6M MA20 will present buy opportunities.
Do you agree with the above hypothesis or you think a new recession is ahead of us? Let me know in the comments section below.
--------------------------------------------------------------------------------------------------------
Please like, subscribe and share your ideas and charts with the community!
--------------------------------------------------------------------------------------------------------

S&P500 made a Channel Down bottom. Rebound or break lower?The S&P500 index (SPX) made today a core technical Lower Low (bottom) on the Channel Down pattern that has been trading in since the January 04 All Time High (ATH). Last time the price hit that Lower Lows trend-line, it held and after 3 weeks of high volatility, it posted an aggressive rebound towards the Lower Highs (top) trend-line of the pattern, just below hte 0.786 Fibonacci retracement.
As long as the Lower Lows trend-line holds, it is more likely for S&P500 to rebound within a 1 month horizon, towards the Lower Highs trend-line around the 0.786 Fib, which is at 4480. The 1D RSI Channel of Higher Lows and Higher High (i.e. bullish divergence against the bearish price action), remains also intact, in fact yesterday bounced off the Higher Lows trend-line.
Keep your stops tight though if you are on a tight margin as a 1D candle close below the Channel Down, could be technically interpreted as a bearish extension signal. Typically such big stock market corrections seek their 1W MMA200 (red trend-line) before they make a Bear Cycle bottom and start the new Bull Cycle. That would almost be a -28% correction from the All Time High. As for the long-term bullish trend, in order for that to be restored, the index would have to break above the 4635 Resistance, which is the previous Lower High.
--------------------------------------------------------------------------------------------------------
** Please support this idea with your likes and comments, it is the best way to keep it relevant and support me. **
--------------------------------------------------------------------------------------------------------

S&P500 Sell in May and go away? Is it actually true or a myth?You've heard this expression before: "Sell in May and go away". It is an old Wall Street saying that basically prompts stock investors to sell in May as the market prepares to enter the Summer period that is supposedly characterized of thin volume as fund managers lighten their stock portfolios and reduce their activity due to vacation leaves etc.
But how accurate is this really? Is it reality or a myth? This is the S&P500 (SPX) chart on the 1M (monthly) time-frame where I look into the month of May price action (as well as before and after) since the subprime mortgage crisis of 2007/08.
As you see, out of this sample of 13 events (May months), we've have 8 cases where May was bullish and extended or started a rise, 3 cases where the price action was bearish on or after May for at least one month and 2 cases where May was bearish but a big rally started after. This alone shows that "sell in May and go away" isn't that accurate.
A more interesting aspect is perhaps the fact that in all cases where a big dip preceded May's price action, the actual month of May was Bullish (May 2009, May 2018, May 2020). I mention that because it is directly related to today, as we are all aware of that the price action since the start of the year (January 2022) has been a strong correction due to the raging inflation and the Ukraine - Russia war among other reasons. This indicates that then the market had already correction and is oversold, investors tend to buy in this opportunity in May.
Since S&P500 has already corrected more than -17%, will May 2022 close in green despite the current disappointing opening? Let me know in the comments section below.
--------------------------------------------------------------------------------------------------------
** Please support this idea with your likes and comments, it is the best way to keep it relevant and support me. **
--------------------------------------------------------------------------------------------------------

S&P500 targeting 4400 on this wave. Conditions for long-term.The S&P500 index (SPX) turned the price action since the start of 2022 into a Channel Down pattern. Monday's low came very close to the 1W MA100 (red trend-line), which is a level intact since May 18 2020. A weekly (1W) candle close below it, will most likely kick-start a new round of aggressive selling.
As long as it holds though, it is more likely to see the index rebound to at least the 0.618 Fibonacci retracement level, which is now a little over 4400. That would be within the Lower Highs zone of the Channel Down. That's the medium-term projection at least.
On the long-term though, based on a distant fractal of similar price action from June 2015 to January 2016, we can only expect an extended rise, if the 4640 High (currently the Resistance) breaks. That is at least what happened in June 07 2016, where after an initial pull-back, the long-term bullish trend was resumed. Notice also the similarities on the 1D RSI sequences.
--------------------------------------------------------------------------------------------------------
** Please support this idea with your likes and comments, it is the best way to keep it relevant and support me. **
--------------------------------------------------------------------------------------------------------

S&P500 Huge Inverse Head & Shoulders completed.The S&P500 index is having a very aggressive sell-off following Jerome Powell's remarks on a 50 basis point hike in May. As you see on the chart, the rejection took place on the 1D MA200 (orange trend-line), broke below the 1D MA50 (blue trend-line) and is about to test today the 1D MA400 (green trend-line).
Why the 1D MA400 is so important? Because during the February - March 'war' correction, it provided support twice (on Feb 24 and March 15). Besides the 1D MA400, the price just hit the 0.236 Fibonacci retracement level (4220 roughly). Fibonacci retracement levels during this 2022 correction have been instrumental in forming Support and Resistance levels. As shown on the chart, the 0.786 Fib has rejected the price 2 times (including Powell's rejection on the 1D MA200), the 0.5 Fib has supported 2 times while the 0.236 once. Additionally, the 1D CCI is approaching the first buy level.
But perhaps the most important development of all is the formation of an Inverse Head and Shoulders pattern (IH&S) where today's low is the Right Shoulder and is exactly symmetrical as the Left Shoulder. IH&S patterns are technically bullish reversal structures and typically form the bottom of downtrends. The trading levels during the current days may be the last chance and a unique opportunity to buy before a strong Q3/Q4 rally to new All Time Highs.
--------------------------------------------------------------------------------------------------------
Please like, subscribe and share your ideas and charts with the community!
--------------------------------------------------------------------------------------------------------

S&P500 on a strong 1D RSI reboundThe S&P500 index is on a strong green candle today on the 1D time-frame, following a bounce yesterday on the 0.5 Fibonacci retracement level. As the pull-back since the March 29 High completed a 50% retrace, and the price stayed around the 1D MA50 (blue trend-line), there are strong probabilities to see this green candle evolve into a strong rebound past the 4637 Resistance (1).
The reason is the RSI, which is also rebounding just above its Higher Lows trend-line running from January 25. As you see this was (almost) the 4th perfect contact on the trend-line. The short-term Resistance is the 1D MA200 (orange trend-line), with the medium-term target being 4750 (Resistance 2).
--------------------------------------------------------------------------------------------------------
Please like, subscribe and share your ideas and charts with the community!
--------------------------------------------------------------------------------------------------------

S&P500 can rise temporarily but 4400 likely mid-term.S&P500 print a Head & Shoulders pattern last week and naturally dropped below the 4H MA50 (blue trend-line) for the first time in two weeks (since March 15). The pull-back is now neutralized and we see today a bullish reaction. This rise can be temporary and even though a test of the recent High is possible, it is more likely to see in the medium-term a test of the 4H MA200 (orange trend-line) and even lower.
The guide for this is the fact that both price wise and based on the RSI on the 4H time-frame, the rise since the March 15 low is quite similar to that of October 01 - November 10 2021. As you see on the chart, the index formed a similar Head and Shoulders pattern that initially dropped below the 4H MA50 and even though it made one last mini-rally to the Head of the formation, it eventually pulled much lower, below the 4H MA200 and 1D MA50 (red trend-line). Currently this rough pull-back projection is around 4400.
--------------------------------------------------------------------------------------------------------
** Please support this idea with your likes and comments, it is the best way to keep it relevant and support me. **
--------------------------------------------------------------------------------------------------------

S&P500 time for this rally to consolidateThose of you following my channel here for long, know that I am a long-term stock investor and wait for the right time to buy the index at a low price. Last month even called here the bottom of the 'Ukraine-Russia war' correction based on the DotCom Bubble fractal, which is so far playing-out very well:
However, I do not hesitate to call for rally pauses or pull-backs when I see one. And currently, based on the COVID correction price action, S&P500 may enter a 2-3 week consolidation phase, as the mid-March rally loses momentum and exhausts. Keep in mind that it was the COVID fractal and its 1D Death Cross, that helped us time the bottom. See how on both sequences, the 1D Death Cross was formed right after the market bottom.
Now that the price broke above the 1D MA50 (blue trend-line) and the 0.618 Fibonacci retracement level, we should keep an eye on where the 1D candles closes. A closing above the 4595 Resistance of the February Highs, could invalidate the similarities with 2020 and sustain the rally all they way to the 4820 All Time Highs (ATH), but in any other occasion, a pull-back and multi-week consolidation is more likely.
As long as the 1D MA50 supports, dips should again be bought. This is invalidated if the price breaks again below the former Lower Highs trend-line. Note how the RSI sequences of the two fractals are virtually identical.
--------------------------------------------------------------------------------------------------------
** Please support this idea with your likes and comments, it is the best way to keep it relevant and support me. **
--------------------------------------------------------------------------------------------------------

Should the WHEAT rally worry stock investors?The current war Ukraine has caused Wheat prices to skyrocket in February and March as Ukraine and Russia export 1/3 of world's wheat. Geopolitical unrest always causes commodity prices to rise, which is something I recently looked into in early March:
As far as wheat is concerned though, it hit its All Time High (ATH), but hasn't closed the month above it, and voices in the markets have already started calling for food shortages and even civil unrest. Those stem from patterns studied as back in time as the U.S. Civil War, the French Revolution and more recently the Arab Spring. Indeed wheat, which is the primary ingredient in bread, has a long history as a commodity with significant political ramifications when the prices rise and availabilities become scarce.
In TradingShot however, we don't yet share these worries as in the stock market era, there is a pattern showing that stocks are most likely safe, unless a certain thing happens. And that is a rally way above Wheat's ATH. Last time it happened was in mid 2007 and as a new top was made in February 2008, the stock market had already began what would end up in a massive correction due to the subprime mortgage defaults, the worst economic crisis in the U.S.A since the Great Depression.
In more detail, it appears the S&P500 (black trend-line) and Wheat (blue trend-line) since the 2000 DotCom crisis, follow the same pattern as since 1968. The Wheat peak on Feb 1974, coincided with the big stock market correction of 1973/74. Then the Wheat ATH was tested 2 times (Nov 1980 and April 1996) but never closed a month above it (until as mentioned before 2007). The result was that the stock market (S&P500 as mentioned in our example), enjoyed its best historic bull run from late 1974 to mid 2000 (DotCom Bubble).
Of course it wasn't just Wheat that aided to that expansion, but at least this chart shows that until Wheat rallies aggressively and makes monthly closes above its All Time High, we most likely don't have to worry about a stock market crash or other socioeconomic concerns such as famine, civil unrest, revolutions etc that are lately making headlines in the news.
--------------------------------------------------------------------------------------------------------
** Please support this idea with your likes and comments, it is the best way to keep it relevant and support me. **
--------------------------------------------------------------------------------------------------------

SP&500 to Gold Ratio. Will stocks outperform Gold this decade?This is a very important reading to long-term investors and wealth managers. The simple S&P500-to-Gold ratio goes as back as 1889 (!) and displays in the most accurate way the relationship of stocks to the yellow metal over the decades.
As you see, every (approximately) 35 years, there is a Full Cycle where initially Gold outperforms S&P500 (SPX) in a periods that lasts roughly 11-13 years but then S&P enjoys a strong long-term rally against Gold, which typically lasts for 20-25 years.
What tends to be the most accurate indicator that confirms the rally of S&P against Gold is the 1M (monthly time-frame) MA100/ MA200 Bullish Cross. This is when the monthly MA100 (green trend-line) crosses above the monthly MA200 (orange trend-line). This Bullish Cross has taken place 3 times in past decades and all of which ended with strong rallies.
The Cross took place more recently in August 2020. S&P500 had already been outperforming Gold since mid 2011, but took a pull-back in late 2018 (as Gold started its new Bull Cycle) and resumed the uptrend in March 2020 after the Fed increased the money supply and issued trillion dollar rescue packages to support the economy from the COVID lock-down.
As a result, this analysis shows that S&P500 will most likely outperform Gold in the next 10 years. The ratio can go as high as 8.00 - 9.00, which is below the 2.0 Fibonacci extension from its most recent Higher High before the Bullish Cross. The reason we pick this value as a top is because all previous Tops follow a decreasing rate, being on the 2.5 Fib, 3.0 Fib and 3.5 Fib respectively as we go back in time.
--------------------------------------------------------------------------------------------------------
** Please support this idea with your likes and comments, it is the best way to keep it relevant and support me. **
--------------------------------------------------------------------------------------------------------

S&P500 Golden Cross on 4H and potential pull-back.The S&P500 index turned bullish last week as it broke above three critical Resistance levels: the former Lower Highs trend-line of 2022, the 4H MA200 (orange trend-line) and the 1D MA50 (red trend-line). The natural target zone is the range consisting of the February Resistance (4595) and the 0.618 Fibonacci Retracement level (4547).
Perhaps the most important technical development of this week, is the formation of the Golden Cross (when the MA50 crosses above the MA200) on the 4H time-frame, which we will see the first time since December 27 2021. However, as the 4H RSI turned lower on Lower Lows and Lower Highs, much like the March 03 sequence, it is more likely to see a pull-back first, towards the 4H MA50 and 0.382 Fib initially at 4379 and then the 0.236 Fib at 4275. Being a potential Channel Up, that should be the new buy entry. Any level below the Higher Lows trend-line, risks turning the long-term sentiment back to bearish.
Of course this pull-back case will be invalidated if the index breaks above the 4595 February Resistance first, in which case the 4820 All Time High (ATH) will be targeted.
--------------------------------------------------------------------------------------------------------
** Please support this idea with your likes and comments, it is the best way to keep it relevant and support me. **
--------------------------------------------------------------------------------------------------------

S&P500 Critical do-or-die test of the 4H MA200-1DMA50 ResistanceThe S&P500 index just made an important move today, by closing (even marginally) a 4H candle above the 4H MA200 (orange trend-line), for the first time since January 13 (practically the start of the correction).
So far it appears that it is following the fractal pattern I suggested at the start of the month with high precision:
As you see, the only barriers left based on this comparison are the Lower Highs trend-line since the All Time High (ATH) and the 1D MA50 (which on today's analysis is illustrated in red). Technically we can say that the ultimate Resistance Zone is the area within the 4H MA200 and the 1D MA50. A candle close above it, should push the index towards the 0.618 Fibonacci (4545) and the February Resistance (4595), which had two rejections on February 02 and 09. Similarly a break above that zone should set in motion a full recovery towards the ATH.
On the other hand, if the price gets rejected within the 4H MA200 - 1D MA50 Resistance Zone, it should pull-back initially to the 4H MA50 (blue trend-line). A break/ close below that trend-line targets the 4140 - 4107 Support Zone made of the two recent lows. The scenario of a break even below those lows, has SPX going for the Lower Lows trend-line and then (after possibly a re-test of the 4H MA50 as Resistance) the -0.236 Fibonacci extension. But I will make an update in such case.
--------------------------------------------------------------------------------------------------------
** Please support this idea with your likes and comments, it is the best way to keep it relevant and support me. **
--------------------------------------------------------------------------------------------------------

S&P500 Imminent 1D Death Cross. Bullish or bearish historically?The S&P500 index is ahead of a Death Cross on the 1D time-frame that can't be avoided. This is technically a very bearish formation, which is formed after a series of selling and suggests that more is coming. Reality though may be different some times, especially in the stock markets, so let's see how this signal has traded historically.
As you see on this 1D chart, since 2015, there have been four Death Cross formations. Three took place on or after the index has formed a bottom and only once (December 03 2018), did the price broke (much) lower to form the bottom. What is common in all occurrences and may help at identifying if the current Death Cross has formed a bottom or will break lower, is the RSI indicator. When the RSI respects its Higher Lows (bullish divergence with the price that is currently on Lower Lows), then the bottom is in. On December 14 2018, that trend-line broke and that was when SPX collapsed to a new Low. Interestingly enough, during that correction, the price dipped to -20%, a repeat of that would place the current bottom around 3850.
We can even go further back with the chart below, after the 2008 subprime mortgage crash, to see that the 1D Death Crosses of July 2010 and August 2011, also marked the bottom (slight lower low in 2011 but is negligible), instead of a fall to a new Low.
So to sum it up, the 1D RSI is so far holding its Higher Lows trend-line. That is an early indication that the bottom will be in when the Death Cross forms, probably by early next week. Are you buying already or waiting to see if the RSI Higher Lows break first? Let me know in the comments section below!
--------------------------------------------------------------------------------------------------------
Please like, subscribe and share your ideas and charts with the community!
--------------------------------------------------------------------------------------------------------

S&P500 Keep an eye for a repeat of mid October!The price action of the S&P500 index on the 1D time-frame since the January 04 2022 Top (left side), is so far very similar to that of September - mid October on the 12H time-frame (right side).
In both cases, there is a Lower Highs trend-line involved from the top, the MA50 (blue trend-line) providing Resistance, as well as a break below the MA200 (orange trend-line). The RSI sequences are also identical. On the mid-October fractal, the price turned bullish again only after it broke above the MA50 and the Lower Highs trend-line. The key before this, was the green Higher Lows zone that held and gave the last decisive push to make the break-out.
Right now, and of course if the pattern continues to replicate the October sequence, it seems that S&P500 is on the last pull-back stage to test the green Higher Lows zone. If that holds, look for an MA50/ Lower Highs test. A break above, most likely confirms the return to long-term bullish territory.
--------------------------------------------------------------------------------------------------------
** Please support this idea with your likes and comments, it is the best way to keep it relevant and support me. **
--------------------------------------------------------------------------------------------------------

S&P500 The Channel Down is still holdingYes another Lower Low on the Channel Down with yet another Support level broken. The index has now two natural Resistance levels, the 1D MA200 (orange trend-line) and the 1D MA50 (blue trend-line), which is unbroken since January 13. The CCI seems to have bottomed. Assuming that, at least for this phase of the Ukraine - Russia war, things won't escalate over the weekend, the index might post a short-term rebound towards the top (Lower Highs trend-line) of the Channel Down.
The previous Lower High was exactly on the 0.618 Fibonacci retracement level from the Lower Low. The 0.618 Fib from yesterday's Lower Low is currently a little over 4400. We can only expect the long-term bullish trend to resume if S&P500 closes above the 1D MA50, where it failed during the previous Lower High. Until then, trading within the Channel Down is more realistic. A break below the 4035 Support (of the May 13 Low) could deliver a flash crash to the next available Support at 3855 (the March 25 2021 Low).
--------------------------------------------------------------------------------------------------------
** Please support this idea with your likes and comments, it is the best way to keep it relevant and support me. **

S&P500 Trading plan for the next 30 days.The last break-out trading plan I posted for S&P500 worked out well enough as it failed to break above the 1D MA50 (blue trend-line), so no longs taken, but it successfully broke below the 1D MA200 (orange trend-line), which was the break-out signal for shorting:
If you took that sell, it may be a good idea to book the respectable profits gained now, despite the fact that the 4230 original target wasn't reached, as the price is rebounding strongly today having priced yesterday's geopolitical fundamentals of Russia recognizing new independent states in Ukraine.
Technically, the long target of this rebound is the 1D MA200, which is now a little over 4470 (but rising). In my opinion, after that level, buying may be resumed only if the index breaks above the 1D MA50 as well (now at 4575 but declining), which is the current Resistance and the level that rejected the price on the February 10 Lower High.
On the other hand, if S&P500 breaks below the Lower Lows trend-line of the October 01 2021 Low, then I suggest shorting again seeking targets near the next available Support of 4035 (the May 13 2021 Low).
--------------------------------------------------------------------------------------------------------
** Please support this idea with your likes and comments, it is the best way to keep it relevant and support me. **
--------------------------------------------------------------------------------------------------------

S&P500 Is there one last ATH left before a dotcom type crash??I won't use too many words here as the charts is pretty much self explanatory.
This is the S&P500 index today (on the left from 2018 to 2022) and the build up to the dotcom crash (1996 - 2000). I approach this symmetrically with 1997 and 2018 being the start of a highly volatile period where the RSI on the 1W time-frame started trading under Lower Highs i.e. showing a bearish divergence against the Higher Highs of the price's uptrend.
That period of volatility eventually came to an end and gave way to a massive rally led by euphoria, which gave the first sign of worries on a Head and Shoulders (H&S) pattern in 1999. It appears that this is where we are at now. In 1999, the H&S, despite breaking below the 1W MA50 (blue trend-line), didn't form a market top but eventually made one last fake rally to an All Time High (ATH) in March 2000. That was the market peak and as we all know the crash of the dotcom bubble took place and the index entered a Bear Market.
Does this mean S&P500 has one last ATH to give before a new dotcom like crash or this H&S already represents the market top for you? Or neither of the two and the stock market will continue upwards without such a crash? Let's make a heated discussion and let me know in the comments section below.
--------------------------------------------------------------------------------------------------------
** Please support this idea with your likes and comments, it is the best way to keep it relevant and support me. **
--------------------------------------------------------------------------------------------------------

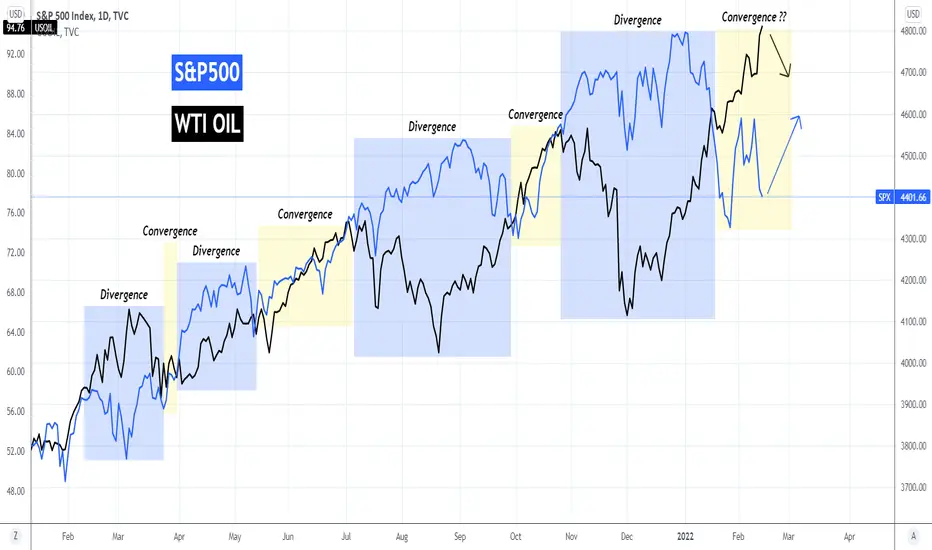
S&P500 and WTI OIL remarkable divergence and convergence patternEver since the COVID recovery started, both the S&P500 index and the WTI Oil, have followed similar courses, especially since the start of 2021. There is a very interesting pattern of divergence and convergence, which the two follow on a consistent basis.
As this chart on the 1D time-frame shows, when S&P500 (blue trend-line) diverges from the shared upward path with WTI (black trend-line), within the blue zone, they have always converged back (yellow zone). Ever since mid January 2022, it is WTI that diverged from the S&P500 as the index dropped violently while WTI continued its rapid price growth. Last time this happened was in the mid Feb 2021 - mid March 2021 Divergence, as the other two Divergence Phases, it was the S&P500 that rapidly expanded while WTI was correcting.
Naturally, if this pattern continues to play out, we should now have a new Convergence phase where the two assets cross trend-lines again and continue their course when they will eventually diverge again. This means that we should be expecting S&P to recover while WTI pulls back from its current highs.
Do you think that will be the case? Let me know in the comments section below.
--------------------------------------------------------------------------------------------------------
Please like, subscribe and share your ideas and charts with the community!
--------------------------------------------------------------------------------------------------------
S&P500 trapped within the 1D MA50 and MA200. Trade the break-outS&P500 has recovered more than 50% of January's strong correction as today the price hit again the 0.618 Fibonacci retracement level. If it doesn't break, this is on the short-term a Double Top as the same High was made there on February 02. Technically, the 1D MA50 (blue trend-line) now comes in play as it is the major Resistance of this recovery attempt while the 1D MA200 (orange trend-line) is the short-term Support, which has already held once successfully on February 04. Notice how those Resistance and Support levels almost perfectly align with the 0.618 and 0.382 Fibonacci retracement levels.
Short-term traders could trade the break-out: if it closes a 1D candle above the 1D MA50 = buy target 4900 (long-term Higher Highs trend-line), while below the 1D MA200 = sell target 4230 (just above the 4220 Support).
-------------------------------------------------------------------------------------------------------
Please like, subscribe and share your ideas and charts with the community!
--------------------------------------------------------------------------------------------------------

S&P500 Trade the Pivot ZoneS&P500 broke again above the 1D MA200 (orange trend-line) today after making a strong rebound at a level (4220) not seen since June 22 2021. This has certainly restored the bullish sentiment on the short/ medium-term but there is a key Pivot Zone to consider within 4500 - 4550 that acted as Support/ Resistance on three prior occasions.
With the 1W RSI also rebounding at the bottom of its Channel Down, there is a strongest case to restore the long-term bullish sentiment but it is best to keep your approach on the medium-term and buy above the Pivot Zone (target the Higher Highs trend-line) and sell below it (target near the 4220 Support).
--------------------------------------------------------------------------------------------------------
** Please support this idea with your likes and comments, it is the best way to keep it relevant and support me. **
--------------------------------------------------------------------------------------------------------

S&P500 ended the U.S elections rally. Years of volatility ahead?This is the S&P500 index on the 1W time-frame (on the log scale). The recent sell-off (-12% so far) is leaving many wondering what is happening and rightly so as it broke below the very strong bullish pattern (Higher Highs/ Higher Lows) since the November 2020 U.S. elections. As I looked more closely into it though by running past regression models, I found that this could in fact be a behavioral pattern linked to post election periods.
More specifically, we witnessed the same sell-off on S&P500 in January 2018 which was exactly 65 weeks (455 days) after the November 08 2016 U.S. elections! Right now we are exactly 65 weeks after the November 03 2020 elections with the index having broken below the 1W MA50 (blue trend-line). It is important to see if SPX can close the current week above the 1W MA50 as in 2018, the 1W MA50 supported the (also -12%) sell-off and gradually led to a new Higher High. However that Higher High was short-lived as in the same year (2018), the index saw an even stronger sell-off that hit the 1W MA200 (orange trend-line). Practically that Lower Low which came after the Higher High formed a multi-year Megaphone pattern. That extensive period of high-volatility started with the U.S. - China trade war and ended even more violently with the global asset melt-down of the panic over the COVID pandemic on March 2020, where the sell-off almost hit the 1M MA100 (red trend-line).
As mentioned above, S&P500 broke below its 1W MA50 yesterday but today shows signs of recovery and is already above it again. A 1W candle close above the MA50 could be the start of a new long-term Megaphone pattern with high volatility due to mostly geopolitical uncertainty. As of now, it is the tensions between the West and Russia over the Ukrainian borders that seems to be starting this geopolitical uncertainty.
Note that a similar period of geopolitical uncertainty took place from late 2014 to the start of 2016, when events such as a potential exit of Greece from the Eurozone, China's economic slowdown, VW scandal, ECB outlook and Oil sell-off rattle global markets and created a Megaphone that also tested the 1W MA50 and 1W MA200 in successive Lower Lows.
Do you think history will repeat itself and the markets will enter uncertainty following a very strong post elections rally? Feel free to share your work and let me know in the comments section!
--------------------------------------------------------------------------------------------------------
Please like, subscribe and share your ideas and charts with the community!
--------------------------------------------------------------------------------------------------------

U.S. stocks crashing? If so which currencies to trade?Last week was a very painful one for the U.S. (as well as global) stock markets, seeing the biggest sell-off since the March 2020 crash that was caused by the COVID outbreak panic. So if we are at the start or halfway of a typical correction on the stock markets, which currencies should we seek as a safe haven and which to avoid?
The current chart is on the 1W time-frame and it includes the price action of S&P500 (blue trend-line), EURUSD (green), USDCHF (red) and USDJPY (yellow) since September 2018, which was when the U.S. - China trade war reached its peak.
This analysis is simple yet it offers very useful and straightforward insight on how these markets behave when the S&P500 crashes:
* As you see during the U.S. - Chine trade war peak when the S&P started to drop significantly on the week of September 17 2018, the EURUSD started to fall as well. At the same time the USDCHF started rising aggressively while the USDJPY despite an initial fall, it recovered and stayed stable.
* During the COVID crash, when the S&P500 started to fall on the Feb 10 2020 1W candle, the EURUSD initially rose but on the final flush crash of the March 02 candle, it also crashed, even on a Lower Low. At the same time, both the USDCHF and USDJPY crashed at first but recovered aggressively on S&P's March final flush.
Based on the above, assuming that S&P500 is closer to the middle of this correction and not the start, the USDCHF and the USDJPY should offer the best shelter until this correction is over. We could see an initial rise on EURUSD but if this is indeed a stock market correction, it should later follow stocks lower.
--------------------------------------------------------------------------------------------------------
** Please support this idea with your likes and comments, it is the best way to keep it relevant and support me. **
--------------------------------------------------------------------------------------------------------
