S&P downside target 4350S&P is completing right shoulder. On neck line break, 4350 level may be reached.
Spxsignals

S&P500 Double level rebound targeting +4900.S&P500 has made a strong rebound yesterday (big wick on the 1D candle) after reaching exactly as low as both the Higher Lows trend-line (dashed line) of December 03 and the 1D MA100 (green trend-line). This is a Double Support Event. The 1D RSI at the same time made a Double Bottom similar to previous bottom formation sequences within the 2021 Channel Up and is forming Higher Lows. At this stage we expect this to be the start of a 1.5 - 2.0 month bullish wave towards the top of the Channel Up and the 2.0 Fibonacci extension, with our Target being just below it at 4960.
--------------------------------------------------------------------------------------------------------
** Please support this idea with your likes and comments, it is the best way to keep it relevant and support me. **
--------------------------------------------------------------------------------------------------------

S&P500 hit the 1D MA50. New buy opportunity.I haven't updated my SPX outlook every since predicting that perfect buy on the 1D MA100 (green trend-line) on December 20:
Right now a new (short-term this time) opportunity arises as the index hit today its 1D MA50 (blue trend-line). The chart above (1D time-frame) shows that, on this Channel Up that held for the whole 2021, after every 1D MA100 bottom, the re-test of the 1D MA50 is a short-term support towards a new Higher High at the top of the Channel Up. In fact it resembles a lot the March 25 2021 1D MA50 test.
Technically the new Higher High is made on the 2.0 Fibonacci extension. Currently you can set two medium-term targets one just below the 1.5 Fib (4850) and the other just below the 2.0 Fib (4960).
--------------------------------------------------------------------------------------------------------
** Please support this idea with your likes and comments, it is the best way to keep it relevant and support me. **
--------------------------------------------------------------------------------------------------------

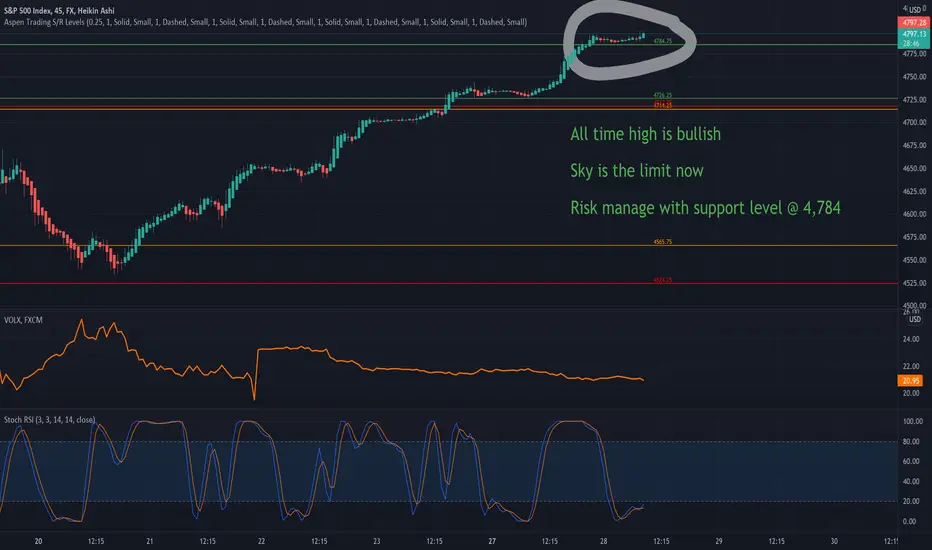
SPX sky is the limit now SPX is trading at all time highs now. We remain bullish but will keep a support level at 4784 to manage our risk.
We use Aspen Trading Support & Resistance Levels to risk manage our positions. These levels are invite only and can be accessed through url in my profile information.
Disclaimer: This analysis is for information purpose only and does not constitute any investment advice.
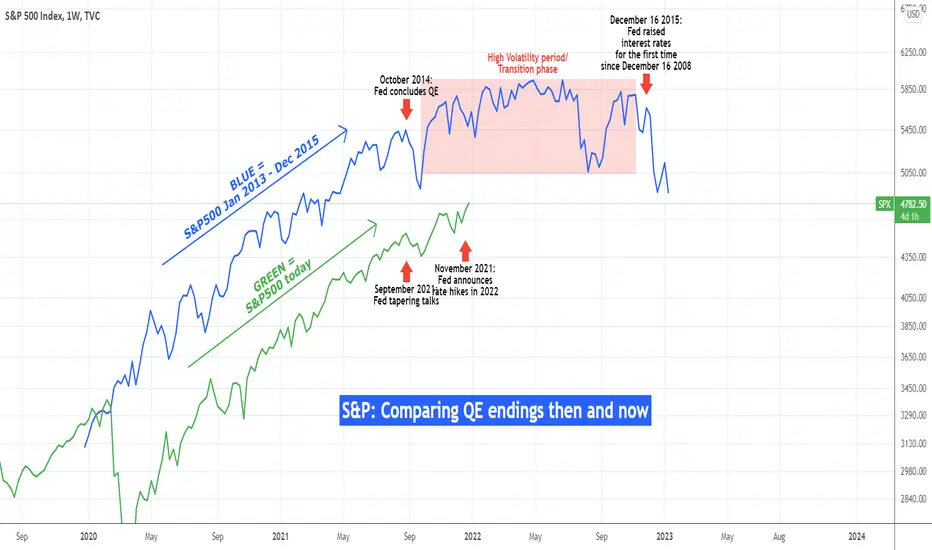
S&P500 Will it share the same fate as the QE ending of 2015?On this analysis I compare the S&P500 index' price action from the post March 2020 crash against the period of January 2013 - December 2015. The reason is the one thing those two have in common: the end of Quantitative Easing (QE) eras.
As the chart shows, the two sequences has been fairly similar as they started by posting strong growth on the basis of aggressive QE (in the past to recover from the subprime crisis and in 2020 to recover from the COVID pandemic). Recently SPX has started to become more volatile and the reason is the Fed starting the taper program and announcing multiple rate hikes in 2022.
We saw the same market reaction from October 2014 onwards after the Fed concluded its QE at the time and until the first interest rate hike (since 2008) in December 2015, the market entered a transition phase of very high volatility. Do you think history will repeat itself and we'll see or have already entered a new long-term volatile phase?
--------------------------------------------------------------------------------------------------------
** Please support this idea with your likes and comments, it is the best way to keep it relevant and support me. **
--------------------------------------------------------------------------------------------------------
S&P500 Solid long-term buy opportunityMy most recent S&P500 idea was a short-term one on the 4H time-frame, where I called for a pull-back and then rebound to 4740:
The target has been hit but the latest pandemic news were used as the catalyst for a new, deeper pull-back. I am switching back to the 1D time-frame where the index has just hit the 1D MA100 (green trend-line) again, for the first time since the December 03 low. As shown on the chart, this sequence has been spotted another 2 times before within this 12-month Channel Up:
a) Double Top on the Resistance, b) Pull-back, c) RSI Double Bottom and d) Rebound to the 2.0 Fibonacci Extension level
In our firm's perspective, once this formation is completed again, we expect another rebound. Our new long-term target is 4850.
--------------------------------------------------------------------------------------------------------
** Please support this idea with your likes and comments, it is the best way to keep it relevant and support me. **
--------------------------------------------------------------------------------------------------------

SPX500USDHello. Due to the negative divergence and the formation of a lower floor, I predict that the 4500 will decrease again

S&P500 Be ready to buy the pull-back if needed.This is a short-term update on the 4H time-frame which I rarely use for S&P500 on my November 30 idea:
As you see on that recent post, the 1D MA50 worked well once more in catching the correction within the multi-month Channel Up and the index has been rebounding strongly this week. This long-term Channel has worked very well at identifying tops as well:
Anyway back to the current situation/ chart and the 4H time-frame. The index has entered the High Volatility Cluster of November, which was basically a prolonged Resistance Zone. As long as the 4745 Resistance doesn't breaks, there are high probabilities for a pull-back towards the 4H MA50 (blue trend-line), which as this long-term uptrend unfolds should form a Golden Cross over the 4H MA200 (orange trend-line). Notice also the MACD which is closer to a Bearish Cross after this very strong rally. If you missed the bottom buy around the 1D MA50, this might be the opportunity you're looking for a new entry.
--------------------------------------------------------------------------------------------------------
** Please support this idea with your likes and comments, it is the best way to keep it relevant and support me. **
--------------------------------------------------------------------------------------------------------

S&P500 is approaching its medium-term buy levelIt is time to update our perspective on the S&P500, which we last analyzed a week ago when we called the exact market top on November 22:
As you see the index got rejected that day and corrected instantly, which based on our analysis is a much needed technical correction in accordance with the long-term pattern of the 2021 Channel Up on the 1D time-frame.
The price is now very close to the 1D MA50 (blue pattern) and as per the May fractal, which has been accurately following, a contact there is a highly possible bottom. Thus, a slightly further dip within 4540 - 4520 would be ideal for a new medium-term buy towards the 4740 Resistance.
--------------------------------------------------------------------------------------------------------
** Please support this idea with your likes and comments, it is the best way to keep it relevant and support me. **
--------------------------------------------------------------------------------------------------------

S&P500 Technical short-term correction imminentThis is a quick update to the S&P500 analysis posted 10 days ago:
As the plan suggested, the index continued to slowly rise just below the Higher Highs (top) trend-line of the 2021 Channel Up, following the late April/ early May fractal.
Right now this is about to get completed, meaning that S&P may be ahead of a short-term technical correction towards the 1D MA50 (blue trend-line). The RSI (on the 1D time-frame) is also printing an identical sequence. Naturally that should be the final pull-back before the seasonal end-of-the-year rally. However, even the slightest break above the Channel's Higher Highs, could lead to a buying frenzy towards the 1.5 Fibonacci extension trend-line.
--------------------------------------------------------------------------------------------------------
** Please support this idea with your likes and comments, it is the best way to keep it relevant and support me. **
--------------------------------------------------------------------------------------------------------

Nasdaq/S&P500 ratio. Final stage of the BUBBLE?This is a simple yet very interesting chart illustrating the Nasdaq-to-S&P500 ratio since the 1980s.
As you see after a price stabilization in the 1980s, the ratio started to rise but steadily within a Channel Up since 1998. That was when the tech index (Nasdaq) took off fueled by the dot.com mania on a 2 year rally that eventually led to the dot.com crash of 2000.
The ratio has been trading within a similar Channel Up since the 2008/09 subprime mortgage crisis. Currently the 1W MA50 (blue trend-line) and the 1W MA100 (green trend-line) are converging in a squeeze evetn that was seen in the 1990s Channel Up at the end of it, when NDX's parabolic rally started.
Does that mean that we are about to enter the final 2 year stage of the Bubble? Share your thoughts in the comments section.
--------------------------------------------------------------------------------------------------------
** Please support this idea with your likes and comments, it is the best way to keep it relevant and support me. **
--------------------------------------------------------------------------------------------------------

S&P500 could rise a little higher before a new 1DMA50 correctionS&P500 has been trading inside a straightforward Channel Up since the start of the year. It recently (November 05) hit the top (Higher Highs trend-line) of the Channel and pulled back, however today is posting a respectable rebound.
According to a similar fractal in late April, it is possible to extend this rise just below the top of the Channel Up for some more days, before it eventually pulls back for the technical 1D MA50 (blue trend-line) correction. See how the RSI (1D time-frame) on both fractals got rejected at the exact same level. Note that any break above the top of the Channel Up, could initiate a bullish break-out towards the 1.5 Fib extension of the underlying Fibonacci Channel.
--------------------------------------------------------------------------------------------------------
Please like, subscribe and share your ideas and charts with the community!
--------------------------------------------------------------------------------------------------------

S&P500 The 1D RSI is overbought on a big red signalS&P has been trading within a Channel Up ever since the November 2020 U.S. elections. During that time, the RSI on the 1D time-frame has never gone above 76.30. Right now however, it is overbought and approaching the 80.000 Resistance where it was last seen on September 03 2020. As you see on the chart this overbought valuation couldn't do otherwise buy initiate a medium-term pull-back of -10%, which broke below the 1D MA50 (blue trend-line).
If the same pattern is followed, then a -10% correction would put the price exactly on the 1D MA200 (orange trend-line) at around 4250. Of course that depends on where the top is made but right now S&P500 is exactly at the top (Higher Highs trend-line) of the 12 month Channel Up you see on the chart. Technically if it gets rejected here, then the first buyers should appear on the 1D MA50. In any case the next target is the 2.0 Fibonacci extension at 4825.
--------------------------------------------------------------------------------------------------------
** Please support this idea with your likes and comments, it is the best way to keep it relevant and support me. **
--------------------------------------------------------------------------------------------------------

S&P500 One last 1D MA50 touch left before $4800?S&P has made new All Time Highs (ATH) since my analysis at the start of the month, where the diverging 1D RSI gave a strong buy signal at the bottom of the multi-month Channel Up:
As you see the signal worked out well and the index has now the 1.5 Fibonacci extension as its next target (followed by the 2.0 Fib ext ultimately just above 4800). As the Fed Rate Decision is approaching next week, there is a possibility that the market sells the news on the short-term, make contact with the 1D MA50 (blue trend-line) and then rally for the rest of the month.
After all from a technical perspective, the 1D MA50 has supported from March until the recent September break-out.
--------------------------------------------------------------------------------------------------------
Please like, subscribe and share your ideas and charts with the community!
--------------------------------------------------------------------------------------------------------

S&P500 Emerging Golden Cross on 4H.My most recent analysis on S&P500 was 15 days ago, when I talked about why the Bearish Ichimoku was in fact a bullish signal:
As it turned out, the signal was accurate and SPX made a bottom on the Higher Lows trend-line of the Channel Up and rebounded. In fact it even broke above the 1D MA50, the strongest short-term bearish barrier (also the 4H MA200) and is closing in on the 4480 September 27 High.
The pattern seems like a peculiar Inverse Head and Shoulders, which is a bullish formation, but perhaps even more important than that is the fact that we have a potential 4H Golden Cross (when the 4H MA50 crosses above the 4H MA200) forming. Ever since the November 2020 U.S. elections, every Golden Cross on the 4H time-frame has been heavily bullish.
I mentioned on my last update that this price action resembles the February-March fractal and currently I see no reason to change that. I expect a test of the 1.5 and 2.0 Fibonacci extensions towards the end of November for a new Higher High on this long-term Channel Up.
--------------------------------------------------------------------------------------------------------
** Please support this idea with your likes and comments, it is the best way to keep it relevant and support me. **
--------------------------------------------------------------------------------------------------------

S&P500 Ichimoku turned red but is it a bearish signal?S&P has been trading within a long-term Channel Up ever since the aggressive rebound straight after the November 2020 U.S. elections. Today the price just hit the bottom (Higher Lows trend-line) of that Channel.
There are two high probability scenarios arising after September's pull-back:
a) This pull-back is similar to late February - early March 2021 (both on -6% pull-backs that hit the bottom of the Channel Up.
b) It is similar to the October 30 2020 bottom itself (elections low) as they both broke below the Ichimoku Cloud. In fact the last two times before today that the Ichimoku indicator turned bearish was on December 02 2020 and October 29 2020.
On top of that the 1D RSI is on a bullish divergence as its been on Higher Lows since Sept 20 while the price is on Lower Lows, indicating that the selling might be getting weaker.
If SPX materializes one of those scenarios then we may expect first 4688 and then 4826 by December which is the 1.5 and 2.0 Fibonacci extensions respectively, as both of those a) b) patterns reached those extensions.
** Please support this idea with your likes and comments, it is the best way to keep it relevant and support me. **
--------------------------------------------------------------------------------------------------------
!! Donations via TradingView coins also help me a great deal at posting more free trading content and signals here !!
🎉 👍 Shout-out to TradingShot's 💰 top TradingView Coin donor 💰 this week ==> Vergnes
--------------------------------------------------------------------------------------------------------

SPX500SPX500 narrowly missed my 1.618 W3 TP by 60 base appoints or there about, then began what we are now currently in and I am calling W4 and expect another ABC correction here to lead us into W5 which can break above 5,000 EOY

S&P GOOD fundamental but huge sell offS&P had really good fundamental news today with Margins increasing by 13%. The sell off comes all the way down to seek liquidity at a Gap i had marked for some time now. This gap provided a fantastic rejection zone and im expecting a rebound. looking for a rebound to the 50% level and really hoping to get to the 4600 61% area.

S&P500 Death Cross formed on 4H. Bottom or more fall?On my most recent S&P post, I've written about the indicators that were pointing towards a correction:
The correction eventually took place as the MACD formed a clear 'peak pattern', that was present at both the May 10 and July 13 tops. However this time the price has broken considerably below the 1D MA50 (yellow trend-line) and has so far stopped on the 4350 Support (August 19 low).
What stands out this time was the formation of the Death Cross (when the MA50 (blue) crosses below the MA200 (orange)) on the 4H time-frame. Even though this is typically a bearish pattern, last time it formed (May 19) it actually had the opposite effect as it marked a bottom. The MACD is also on its first Support. Does this mean that S&P500 is at a bottom? Very likely but we also have to consider for added volatility ahead of Wednesday's Fed meeting. Every time a bottom was formed, the Previous High was reached shortly after.
** Please support this idea with your likes and comments, it is the best way to keep it relevant and support me. **
--------------------------------------------------------------------------------------------------------
!! Donations via TradingView coins also help me a great deal at posting more free trading content and signals here !!
🎉 👍 Shout-out to TradingShot's 💰 top TradingView Coin donor 💰 this week ==> Vergnes
--------------------------------------------------------------------------------------------------------

SPX500 Rangebound againS&P500 had another nice day of price action but still no direction. Tested the lows early and tested the highs late. Selling the rallies and buying the dips until a direction is revealed.

SPX Leading the wayAs SPX has been leading the way this week, today was no different. Starting off with some downward pressure seaking liquidity it found some @61.8 level and gave a really nice reaction pushing towards the previous 2 day highs but not closing above. this leads me to believe were going into a bit of a range so im looking for this rally to be short lived and possible downside Thursday. watch for a positive retail sales number as this could drive the price higher.

S&P Still showing downward pressure...S&P some beautiful price action today leading to more downside as predicted. could get a decent reaction @4430/61.8 level. im stilll very interested in the 4420 reaction but big focus on the 4400 in between the 79-88% levels.

S&P500 textbook Price action and GAP fillS&P as predicted gave some pre market push up before some strong downward force to fill the gap to perfection and giving a beautiful reaction to the 4450 zone 50% level. Im still bearish for the moment looking at the 4420 zone 70% level but main focus is on the 4400-4375 area with the 79%and88% levels where ill be looking for a structured momentum switch.
