S&P500 1D RSI hit Resistance. Pull-back imminent.S&P500 has been trading within an almost 1 year long Channel Up ever since the U.S. elections. The pattern has been quite consistent especially in "buy the dip terms" as every hit on the 1D MA50 (blue trend-line) has been an optimal buy level for so long. That has been the strongest aspect of my strategy, last time I shared it was on July 19:
Right now the index is not on the 1D MA50 but there is a pattern that has given accurate "sell the top" signals also: the RSI on the 1D time-frame. As you see on the main chart, every time the RSI hits (or marginally approaches) the 70.000 Resistance level, it marks a top and waves a sell signal.
Naturally I expect the continuation of this pattern with a pull-back to the 1D MA50, where new buys can be placed.
** Please support this idea with your likes and comments, it is the best way to keep it relevant and support me. **
--------------------------------------------------------------------------------------------------------
!! Donations via TradingView coins also help me a great deal at posting more free trading content and signals here !!
🎉 👍 Shout-out to TradingShot's 💰 top TradingView Coin donor 💰 this week ==> vychod
--------------------------------------------------------------------------------------------------------
Spxsignals

S&P500 healthy pull-back for bullish continuationPattern: Channel Up on 4H.
Signal: Buy on the next pull-back to the 4H MA50 (blue trend-line). This buy signal has been consistent since June 01, appearing 3 times.
Target: The 0.786 Fibonacci retracement level.
Most recent S&P signal:
** Please support this idea with your likes and comments, it is the best way to keep it relevant and support me. **
--------------------------------------------------------------------------------------------------------
!! Donations via TradingView coins also help me a great deal at posting more free trading content and signals here !!
🎉 👍 Shout-out to TradingShot's 💰 top TradingView Coin donor 💰 this week ==> nevada999
--------------------------------------------------------------------------------------------------------

SPX500 Entries + ExitsBack to our roots.
How To Play The Chart Entries/Exits:
Buy at green support entry, if it breaks by -35 pips (count it out) then enter a sell and ride to TP1, 2 and 3. Trail stop at each TP which means place your stop loss in profit but with enough room to be able to continue the sell if it continues. Same thing at resistance, sell but if broken by 30 pips then enter the buy and ride to TP1. Each TP is a support or resistance zone , so you could then even take a sell after TP1 for the buys have been hit and if it breaks out then just repeat.

SPX WARNING Fibonacci Circle top and Wave 5 topHi its been a while,
i've been very busy with The OWL and cryptos. I want to show you this chart cos i think we are approching a market top soon, the consequence of a hit of this 3.618 fib would end in my opinion a Supercycle.. which can bring a depression and a Deflation plase. Also this bearish divergence we created since May 1998 is no doubt.

S&P500 Buy opportunity on the 1D MA50This is a continuation idea to the most recent one:
Pattern: Channel Up on 1D.
Signal: Buy as the price hit the 1D MA50 (blue trend-line) and the RSI has entered its 1 year Buy Zone.
Target: 4450 (the 1.382 Fibonacci extension, which has been the most modest target for a Higher High within the Channel Up).
** Please support this idea with your likes and comments, it is the best way to keep it relevant and support me. **
--------------------------------------------------------------------------------------------------------
!! Donations via TradingView coins also help me a great deal at posting more free trading content and signals here !!
🎉 👍 Shout-out to TradingShot's 💰 top TradingView Coin donor 💰 this week ==> ProjectSyndicate

S&P500 Is it getting ahead of itself?The index has been trading within a Channel Up since the November 2020 elections. The barometer has always been the 1D MA50 (blue trend-line) mostly, where the majority of buy accumulation has been taking place. The Ichimoku Cloud is second. What we see now is the price trading very close to the Higher Highs trend-line and although it can break the 4,400 - 4,420 zone and trade just under the Higher Highs trend-line for a long period of time (like Nov 2020 - Jan 2021 and April 2021 - May 2021), it is best to stay focused and use the long-term perspective as a guide. The RSI offers a good viewpoint as well, especially in terms of the consolidation near the Higher Highs, but it also has a clear 1 year Buy Zone and that is within 43.000 - 35.000.
** Please support this idea with your likes and comments, it is the best way to keep it relevant and support me. **
--------------------------------------------------------------------------------------------------------
!! Donations via TradingView coins also help me a great deal at posting more free trading content and signals here !!
🎉 👍 Shout-out to TradingShot's 💰 top TradingView Coin donor 💰 this week ==> Ether2020
--------------------------------------------------------------------------------------------------------

S&P500 March/ April fractal points to above 4450This is something I've also pointed out a month ago but after last week's rebound on the 1D MA50 (blue trend-line) it got even clearer. S&P seems to be replicating the March/ April fractal where after a break-out above the Resistance Zone (on a 1D MA50 rebound), the price rallied to a level within the 2.5 - 3.0 Fibonacci extension zone. Do you agree that 4450 is a realistic target based on this?
** Please support this idea with your likes and comments, it is the best way to keep it relevant and support me. **
--------------------------------------------------------------------------------------------------------
!! Donations via TradingView coins also help me a great deal at posting more free trading content and signals here !!
🎉 👍 Shout-out to TradingShot's 💰 top TradingView Coin donor 💰 this week ==> fract
--------------------------------------------------------------------------------------------------------

S&P500 Trading plan ahead of the GDPPattern: Channel Up on 4H.
Signal: Buy on the next 1D MA50 contact as the sequence is similar to the May 13-16 fractal.
Target: 4330 (the Higher Highs trend-line and symmetrical level since late April).
** Please support this idea with your likes and comments, it is the best way to keep it relevant and support me. **
--------------------------------------------------------------------------------------------------------
!! Donations via TradingView coins also help me a great deal at posting more free trading content and signals here !!
🎉 👍 Shout-out to TradingShot's 💰 top TradingView Coin donor 💰 this week ==> StockSwinger
--------------------------------------------------------------------------------------------------------

S&P500 Buy Signal entering the 4H IchimokuPattern: Channel Up on 4H.
Signal: Buy as the price has hit the 4H Ichimoku Cloud with the 4H MA200 (orange trend-line) and the 1D MA50 (red dotted line) right below, while the RSI reached the June 03 low.
Target: 4280 (top of the Channel Up) and if the Higher Highs trend-line breaks, then extension to 4340 (2.0 Fibonacci extension).
** Please support this idea with your likes and comments, it is the best way to keep it relevant and support me. **
--------------------------------------------------------------------------------------------------------
!! Donations via TradingView coins also help me a great deal at posting more free trading content and signals here !!
🎉 👍 Shout-out to TradingShot's 💰 top TradingView Coin donor 💰 this week ==> mused_Aurorah
--------------------------------------------------------------------------------------------------------

S&P500 Triangle about to breakPattern: Triangle on 4H.
Signal: Buy as long as the Higher Lows trend-line holds.
Target: 4400 (just below the 2.0 Fibonacci extension, similar to the March 31 break-out).
** Please support this idea with your likes and comments, it is the best way to keep it relevant and support me. **
--------------------------------------------------------------------------------------------------------
!! Donations via TradingView coins also help me a great deal at posting more free trading content and signals here !!
🎉 👍 Shout-out to TradingShot's 💰 top TradingView Coin donor 💰 this week ==> CryptoSurfer007
--------------------------------------------------------------------------------------------------------

SPY (S&P 500) BULLISH until July/August ELLIOTT WAVE THEORYThe S&P500 ( SPY ) has seen lots of sideways price action and consolidation for the past few weeks or so, but I believe that we could be seeing an impulsive break-out in the near future. This would form the impulsive wave 3 of a final wave 5 push to the upside before the bear markets kick in around the summertime months (July-August).
We will need to see confirmation of a bullish break-out to know that we have entered an impulse wave to the upside. If SPY can break-out over 421-422 (heavy resistance levels), targets of 430+ are very achievable as denoted in the charts. A possible explanation for the recent lack of volume and price direction could be due to the fact that meme stocks ( AMC , GME , BB, BBBY , WKHS , etc.) have taken over the market and soaked up buying interest. Once buying power gets re-directed back into S&P500 stocks, we should see some bullish momentum that is needed to kickstart the impulse wave to the upside.

S&P500 Fractal showing $4255 as targetBoth in terms of RSI/ MACD and the way the price trades on the 4H MA50 (blue trend-line) and the 4H MA100 (green trend-line), S&P500 appears to be replicating the late April - early May fractal. After a bottom on the Support, the price rebounded just below the 1.382 Fibonacci extension. That is currently just below 4270. I believe that following tomorrow's Nonfarm Payrolls, as similar price spike will occur.
Most recent S&P500 analysis:
** Please support this idea with your likes and comments, it is the best way to keep it relevant and support me. **
--------------------------------------------------------------------------------------------------------
!! Donations via TradingView coins also help me a great deal at posting more free trading content and signals here !!
🎉 👍 Shout-out to TradingShot's 💰 top TradingView Coin donor 💰 this week ==> CryptoSurfer007
--------------------------------------------------------------------------------------------------------

S&P500 Fractal signalPattern: Channel Up on 4H.
Signal: Buy on the next 0.618 Fibonacci retracement level pull-back.
Target: 4350 short-term (the 1.5 Fibonacci extension) and 4450 long-term (the 2.0 Fibonacci extension).
Most recent S&P idea:
** Please support this idea with your likes and comments, it is the best way to keep it relevant and support me. **
--------------------------------------------------------------------------------------------------------
!! Donations via TradingView coins also help me a great deal at posting more free trading content and signals here !!
🎉 👍 Shout-out to TradingShot's 💰 top TradingView Coin donor 💰 this week ==> NMOTION29
--------------------------------------------------------------------------------------------------------

S&P500 entering the buy zone againPattern: Fibonacci Channel on 1D.
Signal: Buy as the price entered the 1D MA50 - 1D MA100 buy zone again. The 1D RSI is on the (Support) similar level that it was on the Jan 29, March 04 and May 12 bottoms.
Target: 4350 (the 1.5 Fibonacci extension).
Previous S&P500 idea:
** Please support this idea with your likes and comments, it is the best way to keep it relevant and support me. **
--------------------------------------------------------------------------------------------------------
!! Donations via TradingView coins also help me a great deal at posting more free trading content and signals here !!
🎉 👍 Shout-out to TradingShot's 💰 top TradingView Coin donor 💰 this week ==> buchi24
--------------------------------------------------------------------------------------------------------

S&P500 First Buy Signal (medium-term).Pattern: Bullish Megaphone on 4H.
Signal: Buy as the price completed a -3% pull-back. Second buy signal when it completes a -6% pull-back as since December every -3% to -6% correction was followed by a rally. Also the MACD hit its 1st Support.
Target: 4300 (slightly below the 1.5 Fibonacci extension of the Channel).
** Please support this idea with your likes and comments, it is the best way to keep it relevant and support me. **
--------------------------------------------------------------------------------------------------------
!! Donations via TradingView coins also help me a great deal at posting more free trading content and signals here !!
🎉 👍 Shout-out to TradingShot's 💰 top TradingView Coin donor 💰 this week ==> xBTala
--------------------------------------------------------------------------------------------------------

BTC and S&P How accurate is "Sell in May and go away"?Tomorrow is the last day of the April. Every year at the start of May investing and trading forums are flooded with the old street saying of "Sell in May and go away", especially from sellers who are already deep into short positions. But how accurate is this saying for Bitcoin and S&P500 in particular.
A simple display of both on the monthly (1M candle) chart quickly provides the answer:
* Bitcoin has dropped either on or right after May 3 times, while it rose 7 times since May 2011.
* S&P500 has dropped either on or right after May 3 times, while it rose 9 times since May 2009.
It becomes easily obvious that the "Sell in May and go away" saying is just a "myth". Do not get stuck trading entirely based on this. Both BTC and S&P simply follow their greater cyclical trend phases even during Mays and the argument that big institutions, fund managers, and/ or investors sell everything in May and go for vacation is dangerous.
For S&P in particular there hasn't been a drop on or right after May since 2015! And the fact that since the 2008 Subprime mortgage crisis we only had 3 bearish May candles, completely smashes the argument.
** Please support this idea with your likes and comments, it is the best way to keep it relevant and support me. **
--------------------------------------------------------------------------------------------------------
!! Donations via TradingView coins also help me a great deal at posting more free trading content and signals here !!
🎉 👍 Shout-out to TradingShot's 💰 top TradingView Coin donor 💰 this week ==> Vergnes
--------------------------------------------------------------------------------------------------------

S&P500 may drop -3% to -6%.Pattern: Bullish Megaphone on 4H.
Signal: Sell as the price broke below the 4H MA50 (blue trend-line) and since December 21, 2020, every time the index broke below the 4H MA50 it dropped even lower to (or below) the 4H MA200 (orange trend-line).
Target: Anywhere within a -3% to -6% from the recent High. -3% has more chances as as 3 out of 5 MA50 breaks resulted in a -3% drop.
** Please support this idea with your likes and comments, it is the best way to keep it relevant and support me. **
--------------------------------------------------------------------------------------------------------
!! Donations via TradingView coins also help me a great deal at posting more free trading content and signals here !!
🎉 👍 Shout-out to TradingShot's 💰 top TradingView Coin donor 💰 this week ==> kylevd23
--------------------------------------------------------------------------------------------------------

S&P500 Bearish Signals forming on 4HPattern: Bullish Megaphone.
Signal: Sell as the MACD made a Bearish Cross after the (orange) uptrend Channel broke sideways, in a move similar to February 10 and March 12.
Target: 3970 (below the 4H MA100 (green trend-line) as per the previous similar fractals). If the 4H MACD breaks -15.00 then you may extend the selling as low as the MACD Support Zone or just above the 1D MA100 (yellow trend-line).
On the longer-term the trend remains bullish until the greater pattern is invalidated and as suggested by the most recent S&P500 signal shown below, it is safer to buy those Megaphone 4H MA100 pull-backs:
** Please support this idea with your likes and comments, it is the best way to keep it relevant and support me. **
--------------------------------------------------------------------------------------------------------
!! Donations via TradingView coins also help me a great deal at posting more free trading content and signals here !!
🎉 👍 Shout-out to TradingShot's 💰 top TradingView Coin donor 💰 this week ==> hujianghua
--------------------------------------------------------------------------------------------------------

S&P500 The 4H MA50 is the keyPattern: Bullish Megaphone.
Signal: (A) Buy if after the 4H MA50 break-out (blue trend-line), the level holds (as on Feb 02 - 04). If it doesn't, (B) sell towards the lower (-) Fibonacci extensions (as on March 01 - March 04).
Target: (A) The 0.5 Fib (rough estimate 4040). (B) The -1.5 Fib (rough estimate 3800).
** Please support this idea with your likes and comments, it is the best way to keep it relevant and support me. **
--------------------------------------------------------------------------------------------------------
!! Donations via TradingView coins also help me a great deal at posting more free trading content and signals here !!
🎉 👍 Shout-out to TradingShot's 💰 top TradingView Coin donor 💰 this week ==> jsunde73
--------------------------------------------------------------------------------------------------------


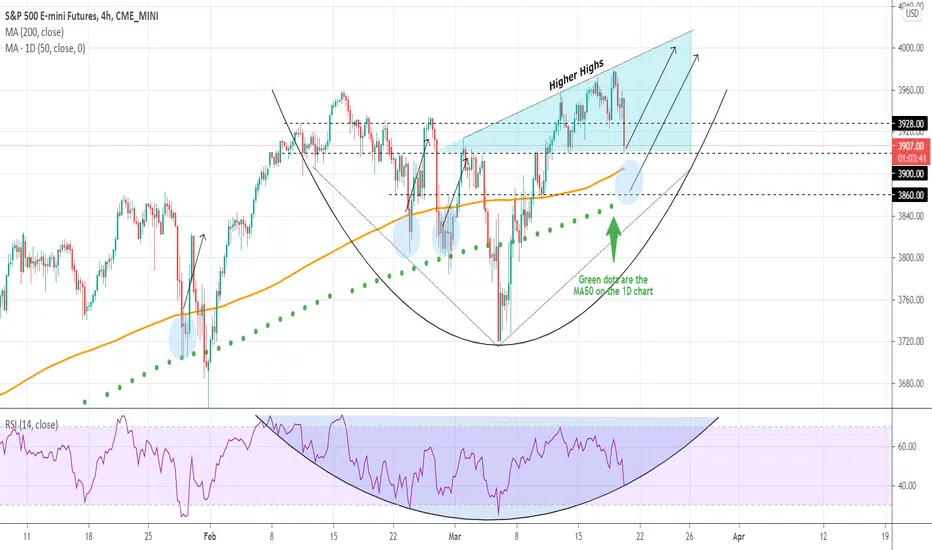
S&P500 Strong MA Support Zone belowThe 4H MA200 (orange trend-line) with the 1D MA50 (green dots) have recently provided rebounds on S&P500 more often than not, acting as a Support Zone.
As you see on the chart those happen to be also on key horizontal Support levels (3900 - 3860). With the 4H RSI making contact with its parabolic line, it is possible that the index is nearing a Support that will provide at least a short-term rebound. Use the Higher Highs line for a potential Target.
** Please support this idea with your likes and comments, it is the best way to keep it relevant and support me. **
--------------------------------------------------------------------------------------------------------
!! Donations via TradingView coins also help me a great deal at posting more free trading content and signals here !!
🎉 👍 Shout-out to TradingShot's 💰 top TradingView Coin donor 💰 this week ==> xBTala
--------------------------------------------------------------------------------------------------------
S&P a scary fractalThe current Channel on S&P500 has reached the Top (1.0) of the Pitchfan on the 1D time-frame while the RSI is on a Bearish Divergence. As you see on the chart, every time a similar pattern has occurred, the hard Pitchfan trend-line (1.0 or the median) rejected the price and SPX broke even way below the 1D MA200 (orange trend-line).
Is this "fractal of doom" something to consider?
** Please support this idea with your likes and comments, it is the best way to keep it relevant and support me. **
--------------------------------------------------------------------------------------------------------
!! Donations via TradingView coins also help me a great deal at posting more free trading content and signals here !!
🎉 👍 Shout-out to TradingShot's 💰 top TradingView Coin donor 💰 this week ==> xBTala
--------------------------------------------------------------------------------------------------------

S&P500 Bullish Break-outPattern: Bullish Megaphone on 4H.
Signal: Buy as the price broke above the inner Lower Highs trend-line and is turning the 4H MA50 (blue trend-line) into Support. The RSI is on a Bullish Divergence.
Target: 4,040 long-term (the 1.382 Fibonacci extension ).
Previous S&P signal:
** Please support this idea with your likes and comments, it is the best way to keep it relevant and support me. **
--------------------------------------------------------------------------------------------------------
!! Donations via TradingView coins also help me a great deal at posting more free trading content and signals here !!
🎉 👍 Shout-out to TradingShot's 💰 top TradingView Coin donor 💰 this week ==> xBTala
--------------------------------------------------------------------------------------------------------
