RSI bullish divergencePattern: Fibonacci Channel on 4H.
Signal: Buy as the price made a bottoming Lower Lows sequence similar to that of January 29.
Target: 4020 - 4050 (the zone around the 1.382 Fibonacci extension).
** Please support this idea with your likes and comments, it is the best way to keep it relevant and support me. **
--------------------------------------------------------------------------------------------------------
!! Donations via TradingView coins also help me a great deal at posting more free trading content and signals here !!
🎉 👍 Shout-out to TradingShot's 💰 top TradingView Coin donor 💰 this week ==> alanmasters
--------------------------------------------------------------------------------------------------------
Spxsignals

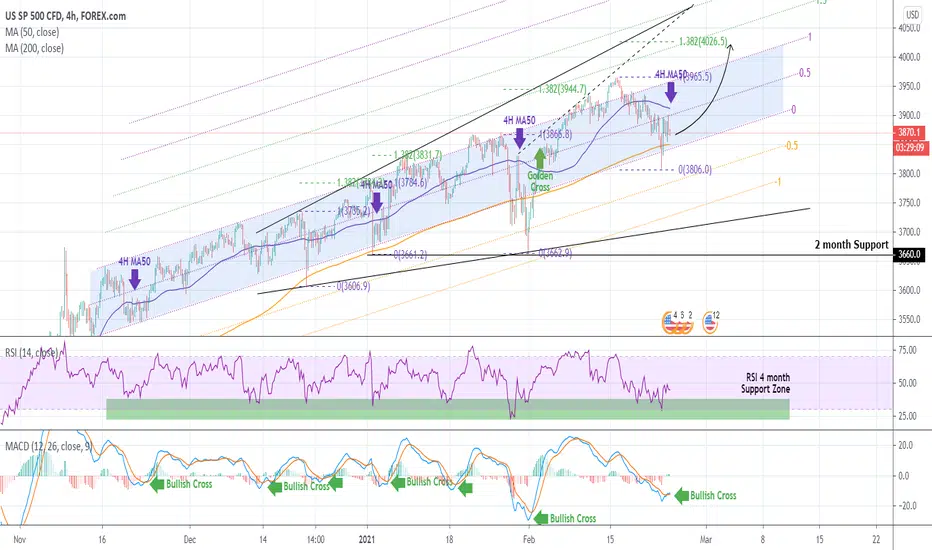
S&P500 A buy Signal from the RSI and MACDPattern: Fibonacci Channel on 4H.
Signal: Buy as every time the MACD made a Bullish Cross, while the RSI had already hit its 4 month Support Zone, the index rose and made a new High. Last confirmation will be to close one session above the 4H MA50, which has previously been a mid-term Resistance within that Channel prior to a new High.
Target: 4000 (just below the 1.382 Fibonacci extension which has been an accurate metric of the next Higher High since December).
Most recent S&P500 signal:
Please like, subscribe and share your ideas and charts with the community!
--------------------------------------------------------------------------------------------------------
!! Donations via TradingView coins also help me a great deal at posting more free trading content and signals here !!
🎉 👍 Shout-out to TradingShot's 💰 top TradingView Coin donor 💰 this week ==> SocialCryptopreneur
--------------------------------------------------------------------------------------------------------
PULLBACKS AND CORRECTIONS 2009 TO DATESWell, the chart speaks for it self. i Might have missed one or two :-).

S&P500 has the potential to reach 4250 inside FebruaryPattern: Channel Up on 1D.
Signal: Buy as the MACD has formed a Bullish Cross last Thursday.
Target: 4000 (short-term) and 4250 (medium-term).
Most recent S&P500 idea:
** Please support this idea with your likes and comments, it is the best way to keep it relevant and support me. **
--------------------------------------------------------------------------------------------------------
!! Donations via TradingView coins also help me a great deal at posting more free trading content and signals here !!
🎉 👍 Shout-out to TradingShot's 💰 top TradingView Coin donor 💰 this week ==> ProjectSyndicate
--------------------------------------------------------------------------------------------------------

S&P500 Buy conditionsPattern: Channel Up into a Bullish Megaphone.
Signal: Buy either after a pull-back within the 0.382-0.618 Fibonacci is completed (because the 4H MACD is close to forming a Bearish Cross) or if the 3870 Resistance breaks first.
Target: 3940 (top of the pattern).
** Please support this idea with your likes and comments, it is the best way to keep it relevant and support me. **
--------------------------------------------------------------------------------------------------------
!! Donations via TradingView coins also help me a great deal at posting more free trading content and signals here !!
🎉 👍 Shout-out to TradingShot's 💰 top TradingView Coin donor 💰 this week ==> TradingView
--------------------------------------------------------------------------------------------------------

Gold-Copper Ratio, (very) LONG; This WAS the top of equities ...... most likely.
Let's reason for a second. (Despite all the noise out there.)
The title chart is the Monthly Gold/Copper Ratio, e.g. is very powerful. (It does not tend to turn on a dime!)
This has just completed the month of Jan. 2021.
1) It has finished the month by completing a Bullish Hammer, bouncing off of the (very) round number / level of 500;
2) It did so exactly at the 78% retracement of the March 2020 highs - i.e. Pandemic equity lows;
Then, instead of continuing down (equities continuing to rally) it did turn "on a dime" and finished in a Bullish Hammer - raring to go higher, i.e. equities lower.
3) As of this moment, the above picture, provides one with two distinct possibilities.
a) That massive (Monthly!!) Bearish Deep Crab is going to bear down it's target at the - very - round 1000, e.g. sending the SP500, Dow and Nasdaq to a better than >65% Decline; (Most likely!)
b) This ratio is going to trace back, close to the March, 2020 highs - Pandemic Equity lows - where it's going to reverse and rise, once again. I.e. The test of the March, 2020 equity lows are going to hold.
Either way, the significant take away here is this;
Unless these most recent Equity Index highs are taken out very soon - e.g. with this next month - Equities are headed strait to test the March, 2020 lows, where the obvious question remains: Will those hold?
Have a nice day and stay short equities!
Here is the Weekly chart;

S&P500 Buy SignalPattern: Channel Up on 4H.
Signal: Buy as the price broke again below the 4H MA50, which has been a buy signal since November 19. Also the RSI is near its 3 month Support Zone. Potential bottom on the 4H MA200, so use two buy positions.
Target: 3910 (the 1.618 Fibonacci extension assuming 3795 was the bottom. If the bottom is closer to the 4H MA200, the Fib extension will be around 3935).
** Please support this idea with your likes and comments, it is the best way to keep it relevant and support me. **
--------------------------------------------------------------------------------------------------------
!! Donations via TradingView coins also help me a great deal at posting more free trading content and signals here !!
🎉 👍 Shout-out to TradingShot's 💰 top TradingView Coin donor 💰 this week ==> michaelzerna
--------------------------------------------------------------------------------------------------------

S&P aiming for 4070 - 4200 by MarchPurely RSI and Fibonacci extension based analysis. As you see since the March bottom every Higher High is on a higher Fib extension (0.382, 0.618). Similarly, the Higher Lows have so far followed a 0.382, 0.5, 0.618 Fibonacci retracement sequence.
The RSI is currently trading sideways since mid November. In the previous two Fib cycles, this RSI consolidation came before the new Higher High. Assuming this sequence is extended, then S&P should soon make its new Higher High within the -0.786 - 1.000 Fibonacci zone, which is within 4070 - 4200.
Most recent S&P signal:
Please like, subscribe and share your ideas and charts with the community!
--------------------------------------------------------------------------------------------------------
!! Donations via TradingView coins also help me a great deal at posting more free trading content and signals here !!
🎉 👍 Shout-out to TradingShot's 💰 top TradingView Coin donor 💰 this week ==> ProjectSyndicate
--------------------------------------------------------------------------------------------------------

US Market Technicals Ahead (11 Jan – 15 Jan 2021)Market will likely be focusing on the prospects for a bigger stimulus package after Friday’s employment report showed the U.S. economy shed jobs for the first time in eight months in December amid a resurgence of Covid-19 infections. A further snapshot of how the economy is performing will be presented with upcoming Friday’s release of data on inflation and retail sales.
Additionally, earnings season will get underway with major US banks set to release fourth quarter earnings results on Friday.
Here’s what you need to know to start your week.
S&P500 (US Market)
The benchmark index ($SPX) continued with a 3rd consecutive week of rally, closing with a modest gain of +1.83% (68.6 points) for the opening week of 2021. This rally have continued to establish a new all time high level at 3,826 points, also breaking out of a 9 weeks trend channel congestion that was highlighted over the weeks.
With plenty of eutrophic moves in highly speculative themes over the past weeks (i.e. Electric Vehicles, Bitcoin, Alternative Energy and Biotechnology), there were observation that some of the previously market-leading mega cap companies are not in participation of the week’s rally. Several of the higher profile companies, particularly the FAANG, remain either in a consolidated triangle chart pattern, or a box ranged rectangular chart pattern. Additionally, $SPX traded lower on the first two days of the year, with the month long highest sessional volume observed on Tuesday alone.
At the current junction, the 20DMA have been nicely supporting $SPX in rally since 4th November 2020. The significance of 20DMA towards $SPX daily current price action is also observed in the various rebound highlighted in the chart (arrow), particularly thrice in December 2020 and once in January 2021. There is also a significant pick up in trading volume since the start of 2021, and it is imminent for market volatility to further uptick towards a 50 points ATR14 range within the next two weeks.
The immediate support to watch for any potential weaknesses is at 3,780 level, a confirmation retracement for Friday’s Bearish Hanging Man candlestick pattern.
Top 3 things to watch this week:
1. Stimulus hopes
Stocks closed at record highs on Friday, despite data showing the U.S. economy suffered its first net loss of jobs in eight months in December, after Biden said his economic relief package will be in the trillions of dollars.
Biden said his administration’s economic package will also include unemployment insurance and rent forbearance. The package is due to be unveiled on Thursday.
2. Economic data, Fed speakers
The U.S. is due to release data on consumer price inflation on Wednesday, while retail sales figures for December are due out on Friday. Inflation is expected to tick slightly higher, but remain subdued, while retail sales are expected to have been dampened by the surging virus.
Fed Chair Jerome Powell is to speak on Thursday. The U.S. central bank has indicated that interest rates will remain on hold near zero through at least 2023 and said the path of the economy will depend significantly on the course of the virus.
3. Banks kick off earnings
Big banks will kick off the U.S. corporate earnings season in earnest with JPMorgan (NYSE: $JPM), Citigroup (NYSE :$C) and Wells Fargo (NYSE: $WFC) posting fourth-quarter results on Friday – the first S&P 500 companies to report for the last quarter of coronavirus-stricken 2020.
Some investors expect company earnings and economic data to play a greater role in moving stock prices this year.


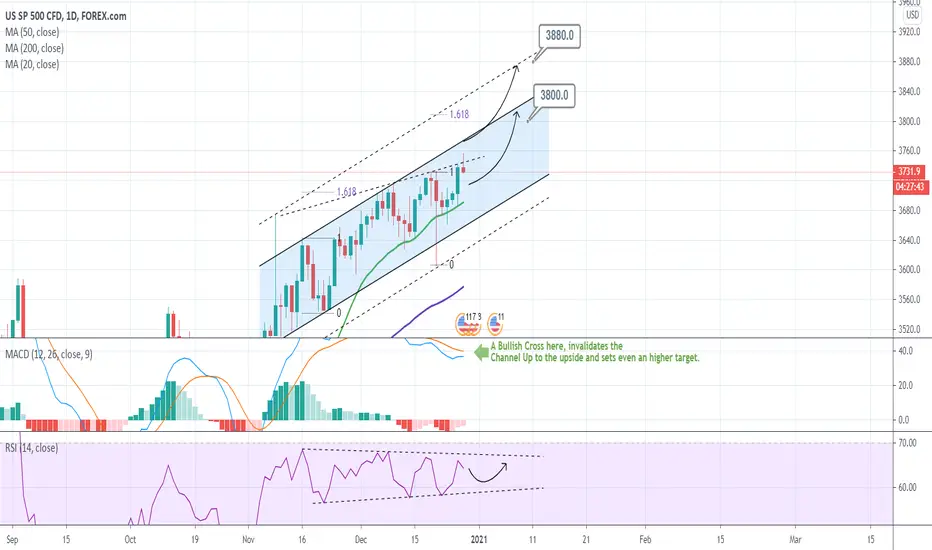
S&P500 aims at 3800Pattern: Channel Up on 1D.
Signal: Buy (a) if the MACD makes a Bullish Cross (every prior 1D Bullish Cross has delivered an extreme rise), or (b) if the RSI approaches its Higher Lows trend-line.
Target: (a) 3880, (b) 3800
** Please support this idea with your likes and comments, it is the best way to keep it relevant and support me. **
--------------------------------------------------------------------------------------------------------
!! Donations via TradingView coins also help me a great deal at posting more free trading content and signals here !!
🎉 👍 Shout-out to TradingShot's 💰 top TradingView Coin donor 💰 this week ==> TradingView
--------------------------------------------------------------------------------------------------------
S&P500 preparing an end of the year rally to 3780SPX continues to trade within the Channel Up that I previously spotted and right now the keys are a certain Fibonacci sequence as well as the MACD formation on the 4H time-frame.
As you see the MACD is printing a similar formation with November 23 - 26. That was when S&P500 made its aggressive Bullish Leg from 3545 to 3655. It made its top on the -0.1 Fibonacci extension then pulled back to the 0.382 Fib retracement and took some time to price a Higher High on the -0.618 Fib extension.
If the same pattern is repeated, then the price could pull back seeking support within the 4H MA50 and 0.382 Fib and then rise to the -0.618 extension which is around 3790. That would set up S&P on a nice end-of-the-year rally.
** Please support this idea with your likes and comments, it is the best way to keep it relevant and support me. **
--------------------------------------------------------------------------------------------------------
!! Donations via TradingView coins also help me a great deal at posting more free trading content and signals here !!
🎉 👍 Shout-out to TradingShot's 💰 top TradingView Coin donor 💰 this week ==> TradingView
--------------------------------------------------------------------------------------------------------

S&P500 Targeting 3720 short-termPattern: Rising Wedge within Channel Up on 4H.
Signal: Buy as the price found support on the 4H MA50, which has been holding since November 23. If the Rising Wedge breaks, buy near the Higher Low of the Channel Up.
Target: 3720 (just below the -0.382 Fibonacci extension like every previous Higher High).
** Please support this idea with your likes and comments, it is the best way to keep it relevant and support me. **
--------------------------------------------------------------------------------------------------------
!! Donations via TradingView coins also help me a great deal at posting more free trading content and signals here !!
🎉 👍 Shout-out to TradingShot's 💰 top TradingView Coin donor 💰 this week ==> TradingView
--------------------------------------------------------------------------------------------------------

S&P500 Trading PlanPattern: Channel Up on 4H.
Signal: (A) Buy either on the Channel's median or on the Higher Low trend-line or if the 3675 Resistace breaks first. (B) Sell below the 3545.
Target: (A) 3670 (just below the Resistance). If 3675 breaks target 3710 (0.5 Fibonacci extension). (B) The 4H MA200 (orange trend-line).
Previous S&P500 trade:

S&P500 Trading PlanPattern: Triangle on 4H.
Signal: (A) Buy as long as the Higher Lows trend-line holds, (B) Sell if it breaks.
Target: (A) 3595 (just below the Lower Highs), (B) 3485 (just above the 4H MA200).
** Please support this idea with your likes and comments, it is the best way to keep it relevant and support me. **
--------------------------------------------------------------------------------------------------------
!! Donations via TradingView coins also help me a great deal at posting more free trading content and signals here !!
🎉 👍 Shout-out to TradingShot's 💰 top TradingView Coin donor 💰 this week ==> johnmcal3
--------------------------------------------------------------------------------------------------------

Can the market rise more during Biden's Presidency than Trump's?This is a simple chart showing the performance of the S&P500 under each President since the Ford administration is 1974.
As you see contrary to popular belief, the stock market in modern times has done (much) better under a Democrat President. Bill Clinton has had the strongest performance with more than +200% in gains from the day he went into the office till the day he left, while George W. Bush the worst and the only negative with -34% in losses.
Also this pattern shows that after every Republican Presidency, the Democrat administration that follows performs (much) better. Carter almost tripled Ford's performance, Clinton more than tripled George H. W. Bush's score. Needless to say what Obama did to George W. Bush's disappointing Presidency.
So in my opinion Wall Street shouldn't be seeing Trump's defeat as a setback, but as the start of a Presidency of more stock market gains than Trump's. History has a tendency to repeat itself. Wouldn't you agree? Let me know in the comments section!
Please like, subscribe and share your ideas and charts with the community!
--------------------------------------------------------------------------------------------------------
!! Donations via TradingView coins also help me a great deal at posting more free trading content and signals here !!
🎉 👍 Shout-out to TradingShot's 💰 top TradingView Coin donor 💰 this week ==> seba26-77
--------------------------------------------------------------------------------------------------------

S&P500 Buy Signal / Strong supporting linePattern: Higher Lows on the 4H chart.
Signal: Buy as the index rebounded not only on the former Lower Highs trend-line (dashed line), but also on the newly formed Higher Lows trend-line.
Target: 3660 (just below the 3675 Resistance).
Recent S&P signals:
** Please support this idea with your likes and comments, it is the best way to keep it relevant and support me. **
--------------------------------------------------------------------------------------------------------
!! Donations via TradingView coins also help me a great deal at posting more free trading content and signals here !!
🎉 👍 Shout-out to TradingShot's 💰 top TradingView Coin donor 💰 this week ==> seba26-77
--------------------------------------------------------------------------------------------------------

S&P500 Time to break above the Stimulus-Elections Triangle?Since the September 03 Top (All Time High), S&P500 has entered a volatile pattern in the form of a Triangle. The major drivers of this weakness have fundamentally been the U.S. stimulus being delayed and then the elections.
Today the Lower Highs trend-line of this Triangle is being tested. If broken, I expect the 3590 Resistance to be tested, with an extension to the 1.236 Fibonacci at 3620 as it happened with the July 23 extension.
The reason I give more probabilities to an upward break-out from the Triangle is the fact that the MACD on the 1D time-frame has (just) formed a Bullish Cross much earlier than the previous time, something that may accumulate buyers. Also the RSI has broken above its Lower Highs trend-line already, something that was a bullish signal 1 year back. On top of that the MA30 just crossed above the MA50 which on a one month horizon at least, has historically been a bullish signal (we have to go years back to see immediate selling after a 1D MA30/50 Bullish Cross.
Most recent trade on S&P500:
** Please support this idea with your likes and comments, it is the best way to keep it relevant and support me. **
--------------------------------------------------------------------------------------------------------
!! Donations via TradingView coins also help me a great deal at posting more free trading content and signals here !!
🎉 👍 Shout-out to TradingShot's 💰 top TradingView Coin donor 💰 this week ==> didogetsov
--------------------------------------------------------------------------------------------------------

S&P500 The elections can kickstart a +30% yearly rally!The chart comparison doesn't need much explaining. I compare the price action on the 1W time-frame that led to the 2016 actions with today's sequence.
Both patterns are Megaphones on a descending RSI with the 1W MA50 (blue trend-line) acting as a Support on the Megaphones late stage. On the November 07 2016 1W candle, S&P rebounded, starting a non-stop rally that didn't give any important pull-back until January 2018, achieving a +36% rise!
Can S&P rebound on this week's election candle, completing the (e) leg?
Feel free to share your work and let me know in the comments section!
Please like, subscribe and share your ideas and charts with the community!
--------------------------------------------------------------------------------------------------------
!! Donations via TradingView coins also help me a great deal at posting more free trading content and signals here !!
🎉 👍 Shout-out to TradingShot's 💰 top TradingView Coin donor 💰 this week ==> didogetsov
--------------------------------------------------------------------------------------------------------

S&P500 targeting 3500Pattern: Triangle on 4H.
Signal: Buy on the next MA50 contact as the price breached the 4H MA200 as in October 01. Also the MACD made a strong Bullish Cross, similar in strength with the September 24 - 29.
Target: 3500 (potential contact on the Lower High trend-line of the pattern).
Most recent S&P signal:
** Please support this idea with your likes and comments, it is the best way to keep it relevant and support me. **
--------------------------------------------------------------------------------------------------------
!! Donations via TradingView coins also help me a great deal at posting more free trading content and signals here !!
🎉 👍 Shout-out to TradingShot's 💰 top TradingView Coin donor 💰 this week ==> didogetsov

S&P 500 Long Setup!I think we will have one more leg up at least before the election. If you find this useful please leave a like I would appreciate it :)

S&P500 got rejected on the 4H MA50! More pain ahead?The index is trading within a Channel Down on the 4H chart and it just got rejected on the most important Resistance test it had: the 4H MA50 (blue line). Even though the 4H MA100 (green line) is in its way as Support, this rejection has the potential to end lower within the Channel and close to the 4H MA200 (orange line) just below 3400.
As you see S&P though has been consolidating within the 4H MA50 and MA200 levels the whole week, and this price action is similar to when it was consolidating again within those two levels (but this time with the MA50 as Support and MA200 as Resistance) in late September/ early October. The RSI action is identical.
Technical risk-management theory indicates that we should engage only if this consolidation range breaks, i.e. either below the MA200 towards 3340 or above the MA50 towards 3550. See how the Fibonacci levels are perfectly aligned.
What do you think? Is there more pain to come?
** Please support this idea with your likes and comments, it is the best way to keep it relevant and support me. **
--------------------------------------------------------------------------------------------------------
!! Donations via TradingView coins also help me a great deal at posting more free trading content and signals here !!
🎉 👍 Shout-out to TradingShot's 💰 top TradingView Coin donor 💰 this week ==> TradingView
--------------------------------------------------------------------------------------------------------
