S&P500 Giant Cup and Handle and CORRECTION in play?The S&P500 index (SPX) almost hit the 4820 All Time High (ATH) level on the last trading session of 2023. That day completed the 9th straight green weekly (1W) candle, a feat last seen on the week of February 19 2019.
This doesn't necessarily indicate that any sort of correction is due as a bullish market can run rallies fueled on fundamental news for even longer period of times. But the fact that the ATH test completes a Cup pattern, could be alarming as, especially on overbought 1W RSI levels, Cup patterns tend to deliver one final pull-back in the form of a 'Handle' structure before making a new clear All Time High.
Technically, the 1W MA50 (blue trend-line) tends to be an intact Support during the year(s) of a Bull Market and so fart it was last hit in late October 2023. If 2024 is indeed a Bull Phase year, then the 1W MA50 should hold. If the Handle pulls back the current bullish trend, then the two could 'meet' at around 4500, which is marginally above the 0.236 Fibonacci retracement level. A stronger correction to the 0.382 level is highly unlikely unless pessimistic news (e.g. Fed, growth, inflation, unemployment) hit the market.
-------------------------------------------------------------------------------
** Please LIKE 👍, FOLLOW ✅, SHARE 🙌 and COMMENT ✍ if you enjoy this idea! Also share your ideas and charts in the comments section below! This is best way to keep it relevant, support us, keep the content here free and allow the idea to reach as many people as possible. **
-------------------------------------------------------------------------------
💸💸💸💸💸💸
👇 👇 👇 👇 👇 👇
Spxsignals

S&P500 Is 4800 the end of the road after 9 green weeks?The S&P500 index (SPX) is currently on its 9th straight green week (1W candle) following the October 23 (weekly terms) bottom. That was a Higher Low on the 15-month Channel Up and based on that pattern, the index is approaching its top (Higher Highs trend-line).
What adds more weight to the very high levels it is trading at, is that the All Time High is just above the current price at 4820. A peak on that level would represent a +17.40% increase, exactly the % rise of the first Bullish Leg of the 15-month Channel Up that peaked on the week of November 28 2022 and then corrected by -8.06%.
With the 1W RSI almost overbought (70.00) as it was on July 24, which was the peak of the previous Higher High of the Channel Up that initiated a 3-month correction of almost -11% and the 1W MACD on a post Bullish Cross level similar to the highs of August 15 2022 and November 28 2022 that kickstarted corrections, the selling pressure has now considerably stronger parameters to start.
This means that, at least from a technical perspective, this is the strongest sell opportunity since late July. A minimum correction of -8.00% would deliver a test of the 1W MA50 (blue trend-line) and as such, our target is 4450 (slightly above it).
If however the bullish trend continues for a few more weeks and pursues the maximum % rally we have seen since 2021, which has been +20.95%, then we can see an extension at around 4950, in which case we will add an additional (2nd) sell and both our bearish targets will be restructured at 4580 (-8.00%).
-------------------------------------------------------------------------------
** Please LIKE 👍, FOLLOW ✅, SHARE 🙌 and COMMENT ✍ if you enjoy this idea! Also share your ideas and charts in the comments section below! This is best way to keep it relevant, support us, keep the content here free and allow the idea to reach as many people as possible. **
-------------------------------------------------------------------------------
💸💸💸💸💸💸
👇 👇 👇 👇 👇 👇

S&P500 The rally still has one more High to give at least.The S&P500 index (SPX) pulled-back yesterday on the strongest 1D red candle since October. A natural technical reaction after weeks of rise-only price action and an overbought 1D RSI that almost hit 83.00. The long-term pattern remains a Channel Up since the October 13 2022 market bottom and as long as the 1D MA50 (blue trend-line) is supporting, it is likely to see one final upward extension towards its top (Higher Highs trend-line).
The two major Higher High sequences (bullish legs) of this Channel have been around +20.50%, extending almost as high as the 2.0 Fibonacci level. As a result we are expecting a minimum of 4930, before any larger correction takes place, unless of course the index breaks above its Channel Up, in which case we will look for a new pattern.
-------------------------------------------------------------------------------
** Please LIKE 👍, FOLLOW ✅, SHARE 🙌 and COMMENT ✍ if you enjoy this idea! Also share your ideas and charts in the comments section below! This is best way to keep it relevant, support us, keep the content here free and allow the idea to reach as many people as possible. **
-------------------------------------------------------------------------------
💸💸💸💸💸💸
👇 👇 👇 👇 👇 👇

S&P500 Bullish unless this Support level breaks.The S&P500 index (SPX) is extending the bullish leg of the 16-month Rising Wedge pattern. It doesn't have much room left before it hits the top (Higher Highs trend-line) of the pattern and as long as this stays intact, it targets 4730 as an end of year target. As you can see, throughout this pattern, its shorter Rising Wedge patterns that have driven the price upwards on the bullish legs, just like the current.
The previous broke to the upside and peaked on the 3.0 Fibonacci extension while the first one failed and when it broke the Support (last Higher Low), it declined to the 0.5 Fibonacci retracement level below the 1D MA50.
As a result, if the Support (4535) fails first, short and target 4370 (0.5 Fibonacci). The 1D MACD is about to complete a Bearish into Bullish Cross pattern, which was favors the bullish scenario.
-------------------------------------------------------------------------------
** Please LIKE 👍, FOLLOW ✅, SHARE 🙌 and COMMENT ✍ if you enjoy this idea! Also share your ideas and charts in the comments section below! This is best way to keep it relevant, support us, keep the content here free and allow the idea to reach as many people as possible. **
-------------------------------------------------------------------------------
💸💸💸💸💸💸
👇 👇 👇 👇 👇 👇

S&P500 Sell if the 4H MA50 breaks.The S&P500 index (SPX) is turning sideways following the enormous rally of November, which is close to being the best in history. That is a natural technical reaction by the market in an attempt to normalize the largely overbought 1D time-frame.
This sideways trade that indicates a potential exhaustion, is complimented by the Bearish Divergence on the 4H RSI, which would justify a technical pull-back. The very same Bearish Divergence was last seen during the late July peak formation.
The structures overall between now and July are quite similar, starting with a Cup bottom and peaking when the curve flattened. Our sell signal confirmation is a break and 4H candle closing below the 4H MA50 (blue trend-line). In that case, we will target the 0.5 Fibonacci retracement level (as on August 03) at 4465.
-------------------------------------------------------------------------------
** Please LIKE 👍, FOLLOW ✅, SHARE 🙌 and COMMENT ✍ if you enjoy this idea! Also share your ideas and charts in the comments section below! This is best way to keep it relevant, support us, keep the content here free and allow the idea to reach as many people as possible. **
-------------------------------------------------------------------------------
💸💸💸💸💸💸
👇 👇 👇 👇 👇 👇

S&P500 How high can this rally go?The S&P500 index (SPX) is on a relentless 1-month rally since since the October 27 bottom, having grown already by more than +11%. Since the August 16 2022 High, the index has entered into a long-term Channel Up sequence. The last two breaks below the 1D MA200 (orange trend-line) have been the Higher Lows and the best medium-term buy entry. The recent (October) one in particular was the first that was on a Higher Lows 1D CCI Bullish Divergence.
We can see that all rallies since August 2022 have been around the same range (+19.31% to +20.79%). As a result, we expect another minimum +19.33% (from the October bottom). Along with the (dotted) Channel Up top, which gives us a first Target at 4700, that +19.33% expectation gives a second long-term target at 4900, which would be above the 4820 (Jan 04 2022) All Time High (ATH). The latter Target will also make a perfect Higher Low at the top of the Diverging (dashed) Channel Up and hit the 1.618 Fibonacci extension (as all previous rally did), while the former (Target 1) will price a Higher High on the (dotted) Channel Up.
As a result, if the index enters a consolidation for a few days within the orange ellipse pattern (as it did during April 2023 and November 2022), it will give you another opportunity to enter in case you missed the rally from its start.
-------------------------------------------------------------------------------
** Please LIKE 👍, FOLLOW ✅, SHARE 🙌 and COMMENT ✍ if you enjoy this idea! Also share your ideas and charts in the comments section below! This is best way to keep it relevant, support us, keep the content here free and allow the idea to reach as many people as possible. **
-------------------------------------------------------------------------------
💸💸💸💸💸💸
👇 👇 👇 👇 👇 👇

S&P500 Cup and Handle paid off. Now brace for Xmas rally.The S&P500 index (SPX) fulfilled our previous Cup and Handle (C&H) pattern, as even though it had a week closing below the 1W MA50 (blue trend-line), it eventually bottomed and has since been on a 3-week rebound that broke above the Handle, turning the 1D MA50 (red trend-line) into a Support again.
Perhaps the strongest technical development of the week is the emerging formation of a Bullish Cross on the 1W MACD. Historically those are formed in the middle of strong rallies, even during a Bear Cycle correction (such as on July 18 2022). Even though a 1 week correction similar to the October 31 2022 1W candle is possible, we expect a new All Time High (ATH) at 4900 (Target 2) at least, as every rally since the October 10 2022 market bottom, has completed at least a +20.19% rise.
Even on the short-term, we expect a 'Christmas rally' to test the bottom of the ATH Zone at 4700 by the end of December, assuming the 1D MA50 of course supports.
Our longer term perspective has the psychological 5000 target in frame as it is slightly below the 1.5 Fibonacci extension from the July 24 High. This projection is made based on that July 24 High itself, which was been on the 1.5 Fib extension from the January 30 High.
Are you looking for a 1 week pull-back to buy or you are already on board for a 'Santa rally'?
-------------------------------------------------------------------------------
** Please LIKE 👍, FOLLOW ✅, SHARE 🙌 and COMMENT ✍ if you enjoy this idea! Also share your ideas and charts in the comments section below! This is best way to keep it relevant, support us, keep the content here free and allow the idea to reach as many people as possible. **
-------------------------------------------------------------------------------
💸💸💸💸💸💸
👇 👇 👇 👇 👇 👇

SPX500Pair : SPX500 Index
Description :
Exp FIAT as an Corrective Pattern in Short Time Frame and Rejection from the Lower Trend Line after it has Completed " abcde " Corrective Waves. Impulsive Wave " 1234 " Completed at Fibonacci Level - 50.00%
Entry Precaution :
Wait until it Breaks or Rejects UTL

S&P500 and VIX. A tale of two opposites.It's no secret that the stock market and in this particular example, the S&P500 (chart on the left), is negatively correlated to the Volatility Index (chart on the right). What we do want to bring to your attention however is how tightly this correlation has been in the past 12 months with VIX's Falling Wedge having the price on its middle, almost on perfect symmetry with the S&P's Bullish Megaphone.
See the recurring sequences within both patterns (tops/ red, bottoms/ greens, consolidations/ blue arcs) and how inversely correlated they are. Right now VIX is headed for its Support where it ends to rebound and consolidate for around 1 month, before sharply declining for a new Lower Low.
Similarly we expect the S&P500 to rise some more before peaking for the short-term, then pull-back to consolidate and then stage an aggressive end-of-the-year rally. Can it repeat a +20% rally as the previous 2 rally legs of the past 12 months? Doubtful, but potentially taking profits when VIX bottoms is certainly a good indicator to have in mind.
-------------------------------------------------------------------------------
** Please LIKE 👍, FOLLOW ✅, SHARE 🙌 and COMMENT ✍ if you enjoy this idea! Also share your ideas and charts in the comments section below! This is best way to keep it relevant, support us, keep the content here free and allow the idea to reach as many people as possible. **
-------------------------------------------------------------------------------
💸💸💸💸💸💸
👇 👇 👇 👇 👇 👇

S&P500 This trend-line separates bull from more pain.The S&P500 index had a green session yesterday as the price made a Lower Low at the bottom of the Channel Down and seems to be rebounding. Technically that is the bullish leg towards the new Lower High, with the previous being priced on the 1D MA50 (blue trend-line).
This Channel Down however, on a 1D RSI basis as well, resembles the August - October 2022 pattern. Both corrections have almost 1 year between them. If the long-term structure that connects them is a Channel Up, then there is more selling ahead, with the potential Support/ long-term Accumulation level being on the 1W MA200 (red trend-line). In October 2022, that level was continuously tested for 2 weeks in a row and held.
The bottom of that Channel Down was confirmed after the 4H MA150 (green trend-line) broke to the upside. As a result, a fair guess would be to buy if a break-out above the 4H MA150 (now at 4275) takes place again. If it does, we will buy again and target the standard +20% medium-term rise within this 12 month span (happened 3 times) aiming at 4930 (would make a new All Time High). If the index stays below the 4H MA150, we will wait until the price bounces off the 1W MA200 and buy with 4740 as the target.
-------------------------------------------------------------------------------
** Please LIKE 👍, FOLLOW ✅, SHARE 🙌 and COMMENT ✍ if you enjoy this idea! Also share your ideas and charts in the comments section below! This is best way to keep it relevant, support us, keep the content here free and allow the idea to reach as many people as possible. **
-------------------------------------------------------------------------------
💸💸💸💸💸💸
👇 👇 👇 👇 👇 👇

Macro Monday 18~Durable Goods SignalsMacro Monday 18
Using New Orders for Durable Goods to Anticipate Market Direction
This week we are using the Manufacturers New Orders for Durable Goods Survey data (“Durable Goods”) to help anticipate price movements on the S&P500. The 30 month moving average for Durable Goods can act as a threshold level for buy and sell signals for the S&P500 whilst also providing advance warnings of recession and/or capitulation events. This has been clearly illustrated in the chart.
Durable Goods Explained
Durable goods orders is a broad-based monthly survey conducted by the U.S. Census Bureau that measures current industrial activity which proves to be is useful as an economic indicator for investors. Durable goods orders reflect new orders placed with domestic manufacturers for delivery of long-lasting manufactured goods (durable goods) in the near term or future.
A high durable goods number indicates an economy on the upswing while a low number indicates a downward trajectory.
Durable goods orders tell investors what to expect from the manufacturing sector, a major component of the economy, and provide more insight into the supply chain than most indicators. This can be especially useful in helping investors understand the earnings in industries such as machinery, technology manufacturing, and transportation.
What’s Included in Durable Goods?
Durable goods are expensive items that last three years or more. As a result, companies purchase them infrequently. Examples include machinery and equipment, such as computer equipment, industrial machinery, and raw steel, as well as more expensive items, such as steam shovels, tanks, and airplanes—commercial planes make up a significant component of durable goods for the U.S. economy. Many analysts will look at durable goods orders, excluding the defense and transportation sectors as large once off orders can often skew the figures.
Durable goods orders data can often be volatile and revisions are not uncommon, so investors and analysts typically use several months of averages instead of relying too heavily on the data of a single month. In our chart we have found the 30 month moving average to be particularly apt as a threshold level
The Chart
In the chart we have the Durable Orders metric in blue and the S&P500 in baby blue. The 30 month moving average on Durable Goods (Dark Brown Line) is used as a threshold level for buy and sell signals.
When the blue line for new orders of Durable Goods definitively passes the 30 month moving average (Dark Brown Line) this provides the buy or sell signal based on whether it moves above or below the average.
Main Findings
1. When Durable Goods Orders(blue) fall below the 30 month moving average(brown) this is sell signal
2. When Durable Goods Orders(blue) break above the 30 month moving average(brown) this is a buy signal
3. Declining durable goods and/or a fall below the 30 month moving average has offered advanced warning of recession and/or capitulation.
Sell Signal Record
(Blue line crossing below Dark Brown Line)
▫️ In Oct 2000 five months before the Dot.Com Crash which commenced in Mar 2001, the Durable Goods Moving Average provided a sell signal offering an five month advanced warning of recession.
▫️ In Dec 2007 the Great Financial Crisis (“GFC”) commenced and whilst New Orders for Durable Goods had not passed below the moving average before the recession it did pass the moving average mid recession signalling an advance warning of the major capitulation event of the GFC crash. Once again Durable Goods was of great utility in avoiding unnecessary losses.
▫️ A sell signal triggered in Oct 2014 and whilst there was no crash, the S&P500 price oscillated sideways for >24 months post signal and only increased in value by 9%. During this 24 month period capital would have been better allocated somewhere offering a better than 9% return.
▫️ In Feb 2019 one year before the COVID-19 Crash the Durable Goods Moving Average provided an advanced sell/recession signal, and whilst the S&P500 did rally c.13.5% after the signal over the subsequent 12 months, the S&P500 ultimately fell 23% thereafter in a matter of months taking back all those gains and more.
Buy Signal Record
(Blue line crossing above Dark Brown Line)
▫️ As you can see from the chart the buy signals provide a great confirmation of trend, that price on the S&P500 will likely continue in an upwards trajectory.
▫️ For the four buy signals confirmed we had 50 months of upwards price pressure on the S&P500 on the first two occasions and on the latter two 18 months and 15 months of upwards price action.
▫️ Taking the four aforementioned buy signals, an the average return was 60.5% f(max return possible from a buy signal the market high).
▫️ The performance from a buy signal to sell signal was an average of 43% across the four instances.
The chart demonstrates that using the 30 month moving average for Durable Goods New Orders can very useful in determining market trend.
At present we are well above the 30 month moving average and appear to be trending upwards. We can continue to monitor this chart and watch for a cross of the 30 month moving average as an additional confirmation of a change to a bearish trend for the S&P500 when it happens. For now this is just another chart to help us identify bearish/bullish trend changes by using the economic data from Manufacturers New Orders for Durable Goods.
As always folks, stay nimble
PUKA

S&P500 That's the longest correction since 2011.More pain ahead?S&P500 (SPX) has been on a correction mode since the week of July 24, completing 13 straight weeks (91 days) of pulling-back without a 50% retracement. As you can see on the charts above, which are on the 1W time-frame, this is the strongest such correction since October 03 2011, which stretched for 21 weeks.
Even the recent Inflation Bear Cycle of 2022 had three separate correction phases of no more than 11 weeks. In total since 2011 there have been 12 such corrections (including the current), so we can realize just how long this one has gone without at least a 50% Fib retracement. This may indicate that potentially we are at or near the bottom. On the downside, it did break and close this week below the 1W MA50 (blue trend-line) and the next Support in line is the 1W MA200 orange trend-line) at 3940.
Do you think it's time to rebound to the 0.5 Fib or the index 'needs' to technically reach the 1W MA200 first?
-------------------------------------------------------------------------------
** Please LIKE 👍, FOLLOW ✅, SHARE 🙌 and COMMENT ✍ if you enjoy this idea! Also share your ideas and charts in the comments section below! This is best way to keep it relevant, support us, keep the content here free and allow the idea to reach as many people as possible. **
-------------------------------------------------------------------------------
💸💸💸💸💸💸
👇 👇 👇 👇 👇 👇

S&P500 - Long; For now ...This naturally rimes with the Nasdaq signals and with the overall global equities outlook.
Here, two opposing forces are the most significant factor;
1) The unfolding (and enduring!) USD strength - Downward pressure ;
2) The massive, continuously inbound (to US) capital flows , primarily from Europe - Upward pressure .
Driven by the rapidly unraveling globalization (driven by a Europe which the US decided to turn into a bonfire that is now clearly visible from Alpha-Centauri, and a China which is dying of old age as the demographic apocalypse is hitting hard this year - 2023), these fundamental forces will likely make this year one for the records - especially when it comes index (equities) trading.
Many, many trading opportunities to be expected, throughout this year, probably far more than in other periods.
Laissez le bon temp roule!! ...

S&P500 The most important test for a long-term uptrend is now.The S&P500 had a strong rejection on the 1D MA50 (blue trend-line) and made a 3 day bearish streak that brought it today on the verge of testing the 1D MA200 (orange trend-line) yet again. The last time it made a triple test between 4 days October 03 - 06) and managed to close all candles above it. As a result, if the S&P500 is to recover, it is critical to hold candle closings above or at least near the 1D MA200.
To get a better perspective of the important of the 1D MA200 during uptrends, it is useful to look at previous such corrections that didn't end up in deeper corrections (Bear phases) but instead extended the bullish trend with rebounds on the 1D MA200.
Such recent examples (besides the COVID recovery in 2020) are 2019 and 2018. In 2019 after two 1D candle closings under it (May 31, June 03 2019), the 1D MA200 held multiple times in July and September. Similarly in 2018, only two days (March 23 and April 02 2018) closed marginally below the 1D MA200 in multiple tests.
Bottom-line: the index MUST hold the 1D MA200 in order to overcome the 3 month correction since July and resume the long-term bullish trend it has since the start of the year.
-------------------------------------------------------------------------------
** Please LIKE 👍, FOLLOW ✅, SHARE 🙌 and COMMENT ✍ if you enjoy this idea! Also share your ideas and charts in the comments section below! This is best way to keep it relevant, support us, keep the content here free and allow the idea to reach as many people as possible. **
-------------------------------------------------------------------------------
💸💸💸💸💸💸
👇 👇 👇 👇 👇 👇

SPX500 19/10 MovePair : SPX500 Index
Description :
Bearish Channel Pattern as an Correction in Long Time Frame and Rejection from Lower Trend Line and Rising Wedge as an Corrective Pattern in Short Time Frame with the Breakout of the Lower Trend Line. Completed " ABC " Correction.
Entry Precautions :
Wait until it Complete its Retest and Rejects

S&P500 Giant Cup and Handle completed? 5000 realistic now?The S&P500 index (SPX) has been trading within a Channel Down since the mid-July High. Last week though made a strong reversal on the 1W MA100 (green trend-line) and the 1D MA200, closed the candle in green and is about to do so again for the 2nd straight week today. Ahead of a 1W MA50/100 Bullish Cross (the first in 7 years), this Channel Down can be interpreted as nothing more than the Handle of a Giant Cup and Handle pattern. We can argue that the whole Inflation Crisis of 2022 has been a Cup and Handle with the subsequent market recovery.
The breaking of the 1W RSI Higher Lows trend-line indicates on the macro level a shift to a new, less aggressive trend, as the 2023 rally isn't easily sustainable without more fundamental catalysts. As a result, as long as the MA Support Cluster holds, we resume being bullish long-term. Target 1 is 4700 (bottom of the All Time High Resistance Zone) and by Q2 2024 Target 2 at 5000.
-------------------------------------------------------------------------------
** Please LIKE 👍, FOLLOW ✅, SHARE 🙌 and COMMENT ✍ if you enjoy this idea! Also share your ideas and charts in the comments section below! This is best way to keep it relevant, support us, keep the content here free and allow the idea to reach as many people as possible. **
-------------------------------------------------------------------------------
💸💸💸💸💸💸
👇 👇 👇 👇 👇 👇

S&P500 Potentially made the biggest rebound of the next 12monthsWe have shown numerous times that the S&P500 (SPX) was in a 2.5 month Channel Down/ corrective move but all within the larger Channel Up pattern, which keeps the long-term trend bullish ever since the bottom recovery last October (2022). Much like that bottom which was formed by the rebound on the 1W MA200 (orange trend-line), 12 months after (October 2023), the index may have just made the most important rebound for another 12-month period.
What was the 1W MA200 then, is the 1W MA100 (green trend-line) and 1W MA50 (blue trend-line), which are about to form a Bullish Cross, the first since September 2016. In fact last week's candle hit the 1W MA100 and rebounded immediately, almost closing the body candle flat, leaving a large wick underneath it, an even stronger reversal than even the October 10 2022 1W candle.
If that wasn't enough, the index hit (and as mentioned rebounded) the Former Resistance Zone of May 2022 through May 2023. In times of such transitions from a Bear to a Bull Cycle, we see the market technically testing former Resistances to make Demand Zones and turn them into Support levels.
On top of that, this week the index just entered into green Ichimoku Cloud territory for the first time since September 05 2022. All this while the 1W RSI bounced off a 18 month Higher Lows trend-line.
It is obvious that if this 5-level Support Zone holds, it can extend the 12-month Channel Up pattern to its next Higher High. Assuming a similar to the previous two bullish legs, +20% rise leg will take place, we expect the S&P500 to target 5000.
-------------------------------------------------------------------------------
** Please LIKE 👍, FOLLOW ✅, SHARE 🙌 and COMMENT ✍ if you enjoy this idea! Also share your ideas and charts in the comments section below! This is best way to keep it relevant, support us, keep the content here free and allow the idea to reach as many people as possible. **
-------------------------------------------------------------------------------
💸💸💸💸💸💸
👇 👇 👇 👇 👇 👇

$SPX: The S&P 500's Key Yellow Resistance TargetIn my previous update I discussed that SP:SPX has lost a key support level in the orange support zone. SP:SPX was sitting under resistance as investors waited for Friday jobs data. The strong jobs data led to a spike back up and SP:SPX has successfully regained support at this orange zone again. My current price target for SP:SPX is the yellow resistance trend line.

S&P 500 Analysis. Day trade Signal!!!Hello Everyone. I want share my idea about S&P 500 which will be signal for next week.
After Some pretty bearish momentum we got rejection from daily support. i think S&P will continue fall and i will try to catch that moment, for that i identify liquidity swings which gave me perfect entry area after used my Fibonacci levels, Fibonacci 78.60LVL and daily resistance is same place, trend what i see is still bearish, for that i decide to short it from That zone.
Here is my setup for my trading signal.
Open Short Position - 4332.1
Stop loss - 4358.00
Take Profit - First target at 4238.3 if it will reach then i will trail my stop loss at the Level.
Always Manage your own risk and make your own research!!!

S&P500 It is very important that this Support Cluster holds.The S&P500 (SPX) is testing the bottom (Higher Lows trend-line) of the 12-month Channel Up pattern. It is vital for the uptrend that the following Support Cluster holds, as if broken, the next Demand/ Support Zone is seen considerably lower, in the low 3800s.
Back to the Support Zone. Besides the bottom of the Channel Up, we have the 1D MA200 (orange trend-line) moving parallel to that and has been unbroken since March 24. More importantly, the 1W MA100 (yellow trend-line) a former Resistance turned into Support after May's break-out, is marginally below the 1D MA200 and on a former Resistance Zone, which in the past 18 months, only broken twice.
As long as the price closes 1D candles above this critical Support cluster, we expect a short-term (at least) rise to test the top of the Channel Down and the 1D MA50 (blue trend-line) at 4430. If the Support fails, expect a greater and perhaps quicker/ more aggressive decline towards 3830 and the former Support Zone.
Notice how the 1D RSI pattern resembles the August - September 2022 correction.
-------------------------------------------------------------------------------
** Please LIKE 👍, FOLLOW ✅, SHARE 🙌 and COMMENT ✍ if you enjoy this idea! Also share your ideas and charts in the comments section below! **
-------------------------------------------------------------------------------
💸💸💸💸💸💸
👇 👇 👇 👇 👇 👇

VIX and S&P500 This is why stocks may rise now.Following yesterday's green stock market reaction, we compare on today's analysis VIX (Volatility Index) to the S&P500 (SPX) price action on the 1D time-frame. Our goal is to find clues to how the Volatility Index can affect the stocks.
As you can see, VIX is trading within an Ascending Triangle which 2 days ago got rejected on its top (Higher Highs) trend-line. All this while its Lower Highs trend-line since September 2022 (1 year back) sits right above it. At the same time the S&P500 index found the bottom (Lower Lows trend-line) of its Channel Down (while the Higher Lows trend-line since the October 2022 market bottom sits right below) and on first impression appears to be rebounding. Being negatively correlated, the more VIX drops, i.e. market volatility calms/ decreases, the more likely it is for the stock market to rise, at least for the short-term towards the Channel Down top (similarly VIX to the Triangle's Support).
In order to see it resume the long-term bullish trend, VIX most likely needs to break its Support. It is not unlikely as the market may respect the long-term Lower Highs (similarly Higher Lows for SPX) and hold it as new rejection point, but for the time being we have to keep our perspective on the short-term patterns (Ascending Triangle and Channel Down respectively) until shown otherwise.
-------------------------------------------------------------------------------
** Please LIKE 👍, FOLLOW ✅, SHARE 🙌 and COMMENT ✍ if you enjoy this idea! Also share your ideas and charts in the comments section below! **
-------------------------------------------------------------------------------
💸💸💸💸💸💸
👇 👇 👇 👇 👇 👇

S&P500 Entered the 2 year High Supply/Demand Zone. Will it hold?Time to leave the short-term charts for S&P500 (SPX) aside and look again at the long-term ones as the price failed last week to recover the 1D MA50 (blue trend-line) and is extending this week the decline towards the 1D MA200 (orange trend-line).
** Higher Lows and 2-year Supply/ Demand Zone **
It hasn't yet hit the Higher Lows trend-line that started on the October 13 2022 market bottom but has entered a 2 year High Supply/ Demand Zone, which has acted as the strongest Pivot Belt since October 2021, with 4 registered holds (green arrows) and 4 rejections (red arrows). It is clear that the market considered it a key during the previous Bear Cycle as well as the Bull Cycle.
** Inflation Crisis vs Subprime mortgage Crisis **
As you can see on the chart, we compare this Inflation Crisis price action with the bottom and subsequent recovery of the Subprime mortgage crisis in 2009 - 2010. The curved bottom on the 1D RSI suggests that we are so far aligned to a certain extent with the first susbtantial correction of the recovery which on May 06 2010 hit (and breached) the 1D MA200. The bottom was priced 2 months later on the 0.382 Fibonacci retracement level.
** So what now? **
The 0.382 Fibonacci on today's sequence is on 4185, marginally above the bottom of the Pivot Zone and almost where the 1D MA200 is currently. This presents us with the probability that if the Higher Lows fails and the 1D MA200 breaks, the market has high chances to consider the bottom of the 2-year Pivot Zone as a High Demand level again. If that happens, we will be buyers for as long as 1D candles close above the bottom of the Zone. Based on the 2009 - 2010 price action, it can rise towards the -0.236 Fib ext and reach the 4820 All Time High (ATH) by Q2 2024.
-------------------------------------------------------------------------------
** Please LIKE 👍, FOLLOW ✅, SHARE 🙌 and COMMENT ✍ if you enjoy this idea! Also share your ideas and charts in the comments section below! **
-------------------------------------------------------------------------------
💸💸💸💸💸💸
👇 👇 👇 👇 👇 👇

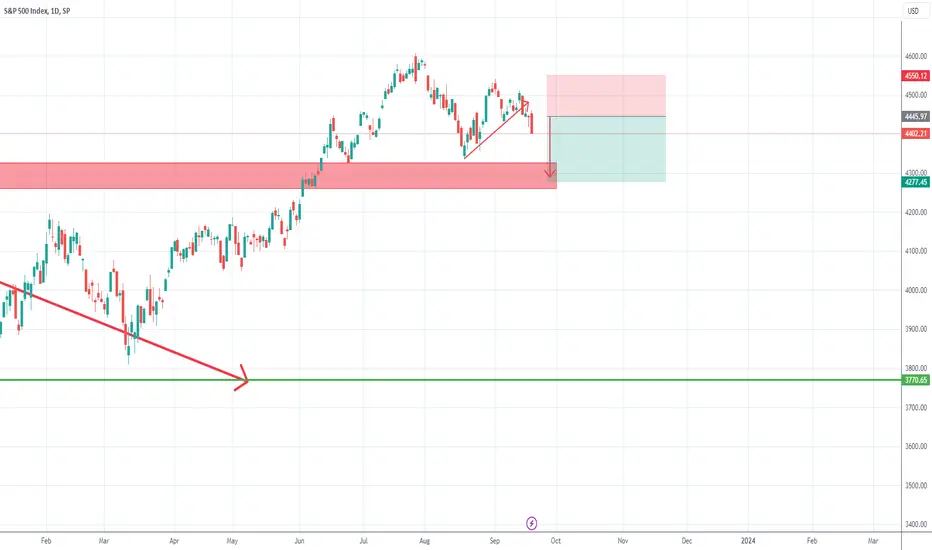
SPX to continue down?As I explained last week, there is a high chance for SP500 to drop to important 4250-4275 zone support.
On Friday the index dropped under the short-term trend line and, after consolidation on Monday and Tuesday, yesterday we had a strong drop.
The overall picture is pretty bearish at this point and another 150 points drop becomes very probable.
In conclusion, as long as the index stays under 4500, traders could look to sell rallies in search of a good risk: reward.