S&P500 Ascending Triangle giving a bottom buy signal.The S&P500 index (SPX) gave us last week an accurate quick buy signal (see chart below) but then got sold-off to a new 3-week Low:
The price hit yesterday during that sell-off the bottom (Higher Lows trend-line) of the Ascending Triangle pattern that is in place since the August 04 High (which created its 4540 top/ Resistance). This is a short-term buy signal and will be confirmed if the 4H MACD completes the emerging Bullish Cross.
The immediate Resistance is the 4H MA50 (blue trend-line) - 4H MA200 (orange trend-line) Zone and the short-term is the Lower Highs trend-line since the September 01 High. That will be our target, aiming at a +1.77% rise (proportionally less than the previous) at 4490.
-------------------------------------------------------------------------------
** Please LIKE 👍, FOLLOW ✅, SHARE 🙌 and COMMENT ✍ if you enjoy this idea! Also share your ideas and charts in the comments section below! **
-------------------------------------------------------------------------------
💸💸💸💸💸💸
👇 👇 👇 👇 👇 👇
Spxsignals

S&P500 Buy signal within the Bullish Megaphone.The S&P500 index (SPX) is attempting to stage a rise after hitting the bottom of the Bullish Megaphone. This is after the formation of the Golden Cross on the 4H time-frame, the first such pattern since March 31. In addition, the 4H MACD just formed a Bullish Cross below the 0.0 level. This is a strong combination of bullish signals for the medium-term.
As long as the Higher Lows (bottom) of the Megaphone hold, we are bullish, targeting 4640 (Resistance 2). If it closes a 4H candle below the Higher Lows, we will close the buy and open a sell instead targeting the 1D MA100 (yellow trend-line) at 4375. If after an initial rebound, it gets rejected on either the 4H MA200 (orange trend-line) or 4H MA50 (blue trend-line), we will re-sell and target the 1D MA200 (red trend-line) at 4220.
-------------------------------------------------------------------------------
** Please LIKE 👍, FOLLOW ✅, SHARE 🙌 and COMMENT ✍ if you enjoy this idea! Also share your ideas and charts in the comments section below! **
-------------------------------------------------------------------------------
💸💸💸💸💸💸
👇 👇 👇 👇 👇 👇

S&P500 Huge buy signal confirmedFollowing last week's buy signal (chart below) on the S&P500 index (SPX), we shift our attention on the 1W time-frame where the new long-term buy signal has just been confirmed:
As you see, the price closed above the 1D MA50 (red trend-line) yesterday, invalidating any bias for further decline and confirming the resuming of the long-term bullish trend within the Channel Up pattern since the October 2022 bottom.
The 1W RSI rebounded exactly on its Higher Lows trend-line, giving a strong bottom signal where previous rebounds have been completed at least a +9.85% rise. As a result, we update our long-term target to 4750.
-------------------------------------------------------------------------------
** Please LIKE 👍, FOLLOW ✅, SHARE 🙌 and COMMENT ✍ if you enjoy this idea! Also share your ideas and charts in the comments section below! **
-------------------------------------------------------------------------------
💸💸💸💸💸💸
👇 👇 👇 👇 👇 👇

S&P500 Target achieved. Now looking for a rebound.The S&P500 index (SPX) hit our 4350 Sell Target that we set on last week's idea (see chart below) and immediately started a two day rebound:
This rebound is taking place just above the 1D MA100 (green trend-line), with the 1D MA50 (blue trend-line) as the Resistance. We've mentioned countless times that the long-term pattern is a Channel Up since the October 13 2022 market bottom and this rebound is taking place after the 1D RSI hit the 33.30, which was the level where the March 13 bottom was priced.
As a result, the current level is a strong candidate for a new long-term buy, targeting 4640 (March 29 2022 High), despite the fact that the previous two correctional waves to a Lower Low declined at least by -9.00%. The bullish confirmation will come when the 1D MACD makes a Bullish Cross. It just touched the top of its 9 month Support Zone.
If however the price closes a 1D candle below the 1D MA100, we will add a sell for short-term profit, targeting the 1D MA200 (orange trend-line) at the bottom of the Channel Up at 4220 (just above a projected -9.00% decline) and then add a second (and final) buy that will naturally target 4640 as well.
-------------------------------------------------------------------------------
** Please LIKE 👍, FOLLOW ✅, SHARE 🙌 and COMMENT ✍ if you enjoy this idea! Also share your ideas and charts in the comments section below! **
-------------------------------------------------------------------------------
💸💸💸💸💸💸
👇 👇 👇 👇 👇 👇

S&P500 On the 1D MA50 after 3 months. Will it hold?Last week we gave a sell continuation signal on the S&P500 index (SPX) after the price failed to break above the short-term Resistance of 4H MA50 (see chart below):
As the price hit the 1D MA50 (blue trend-line) last Thursday for the first time in 3 months, the index found its first long-term Support level. Along with being near the bottom (Higher Lows trend-line) of Channel Up 2 (dotted pattern within the multi-month Channel Up 1), we can attempt the first buy position again and target 4640 (March 29 2022 High). This is a similar situation as May 24 and May 04 (blue circles).
If a 1D candle closes below it though, we will be quick to take the loss and sell the break-out towards the 1D MA100 (green trend-line) at 4350. That is the second long-term Support level, which if broken opens the way for the final one, the 1D MA200 (orange trend-line). The most optimal long-term buy entry will be if the 1D MACD makes a Bullish Cross within the 2023 Support Zone. Potentially that could be near the 1D MA200 and the bottom (Higher Lows trend-line) of Channel Up 1.
-------------------------------------------------------------------------------
** Please LIKE 👍, FOLLOW ✅, SHARE 🙌 and COMMENT ✍ if you enjoy this idea! Also share your ideas and charts in the comments section below! **
-------------------------------------------------------------------------------
💸💸💸💸💸💸
👇 👇 👇 👇 👇 👇

S&P500 Still bearish unless the 4H MA50 breaks.The S&P500 index (SPX) is within a corrective wave in the form of a Channel Down, which may have found a Support on the 4H MA200 (orange trend-line) but as long as it trades below the 4H MA50 (blue trend-line), it remains bearish. As a result our target is 4430 on a potential contact with the 1D MA50 (red trend-line).
If however it closes a 4H candle above the 4H MA50, we will buy instead and target 4600 (just below Resistance 1). The 4H RSI Higher Lows (which is a bullish divergence in contrast to the Lower Lows of the Channel Down), favor this scenario.
-------------------------------------------------------------------------------
** Please LIKE 👍, FOLLOW ✅, SHARE 🙌 and COMMENT ✍ if you enjoy this idea! Also share your ideas and charts in the comments section below! **
-------------------------------------------------------------------------------
💸💸💸💸💸💸
👇 👇 👇 👇 👇 👇

SPX500 Next MovePair : SPX500 Index
Description :
Bullish Channel in STF and LTF as an Corrective Pattern
EXP FIAT
Daily Resistance Level
Divergence
Break of Structure
Completed "12345 " Impulsive Wave

S&P500 This new Channel Up can lead it to the All Time High.The S&P500 (SPX) index has been rising non-stop and appears not to be influenced by yesterday's Fed Rate Decision. The price reached however the top of Channel Up 1, the pattern that has been driving the price action since the October 13 2022 Bear Cycle bottom. This calls for a technical pull-back similar to the December 01 2022 and February 02 2023 Higher Highs, however that can only be confirmed after the 1D RSI breaks below its Higher Lows trend-line, which is exactly what happened on those fractals.
Until then, and as long as the 1D MA50 (blue trend-line) is supporting (has been unbroken since March 29), the more recent Channel Up 2, can lead the price to the 4820 All Time High (ATH) of January 04 2022. Of course before that Resistance 1 (March 29 2022 High) is present at 4640, so since Channel Up 2 is also on its top (Higher Highs trend-line), we can consider a Megaphone (sideways) consolidation, similar to what took place in April. As long as its hits the 1D MA50 and rebounds, we will be bullish, targeting 4820 on the new bullish leg (green arc).
On the other hand if the index does close a 1D candle below the 1D MA50 and the 1D RSI breaks below its Higher Lows trend-line, we will sell and target the 1D MA200 (orange trend-line) at 4250.
-------------------------------------------------------------------------------
** Please LIKE 👍, FOLLOW ✅, SHARE 🙌 and COMMENT ✍ if you enjoy this idea! Also share your ideas and charts in the comments section below! **
-------------------------------------------------------------------------------
💸💸💸💸💸💸
👇 👇 👇 👇 👇 👇

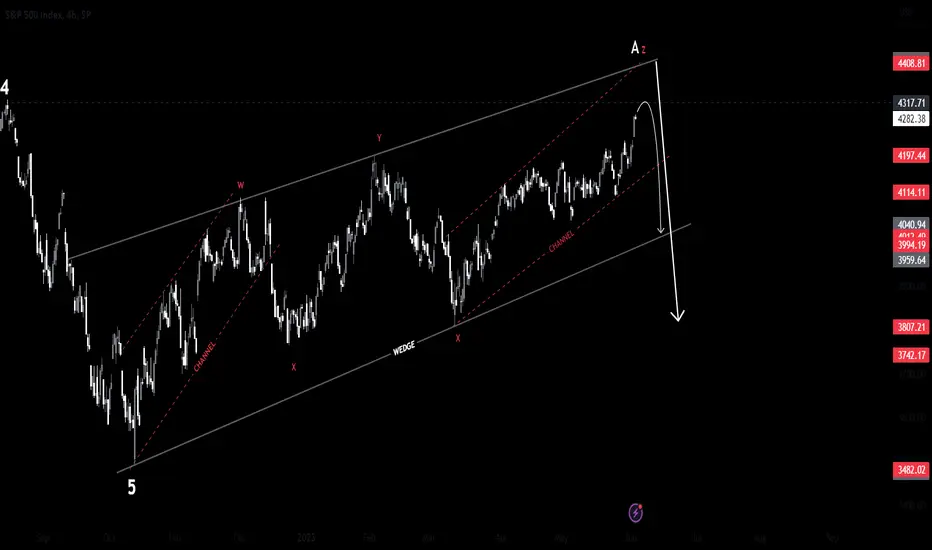
Bing Short on SPX in progressIn my previous post on SPX ( link attached below the description ), I explained how we are going to see a rejection on this uptrend soon and we beginning to see that now.
In this post I will explain how I am playing this short setup.
In the previous post I had a pitchfork. I simplified it with three parallel channels, one larger and two inside it in its upper and lower half so we now have four rising trendlines which will be our point of interest when Price Gets there.
In the image below I have highlighted the properties of these trend lines based on past price action within the channel, which you can observe yourself.
I have indicated three take profit levels on the main chart. I don't think TP1 would be necessary as I don't expect the trendline to hold based on its past behavior.
TP2 and TP3 are my main targets, which is where I will look for signs of a nice bounce back up.
If you observe the channel, we have never really resumed a trend back up without creating a double bottom on the one of the lower two trendline in the chart as highlighted in the image below, if that happens, we resume the uptrend to new highs. That's when you take a swing long position on SPX.
On the other side if TP3 doesn't hold we are looking at a potential change of trend a macro scale, but I won't give up on the upside just after the break as we could possibly see deviation and bounce back in the channel after testing the support area as highlighted in the main chart.
What happens if we lose 4300 level, we go way down, I will leave that detailed analysis for another post.

Buy STOCKS heavily and dump GOLD according to this ratio.It is not the first time we use the SPX/GOLD ratio (S&P500 to XAUUSD) for a macro analysis and certainly each time it manages to offer us different and very helpful insights. This time on the 1W time-frame, the ratio is consolidating these past 2 weeks but after having broken in late May - early June above the 2022 Lower Highs trend-line.
That alone is a strong bullish signal and a look in the past 10 years shows that this is a cyclical pattern that has already been formed twice. The SPX/GOLD ratio following its market peak, enters a Descending Triangle (which is during a time of risk crisis in the markets) where Gold starts to outperform the S&P500 (stocks), a natural move as the yellow metal is a safe haven.
Then as the Triangle's Support holds, the price breaks above the Lower Highs and starts the new Bull Phase. Exception is of course the March 2020 COVID crash, which is a Black Swan event and doesn't count as technical. If it wasn't for that, the price would continue breaking above the Lower Highs as the rest of the fractals. In addition, the 1D RSI breaking above its own Lower Highs trend-line, is a similar buy signal.
Currently, since the ratio is significantly above not just the Lower Highs trend-line (RSI as well) but also the 1W MA50 (blue trend-line), we can expect it to reach the 2.68 Resistance within 6 months.
Naturally, as the title says, this means for investors to buy stocks at the expense of holding Gold. This is translated that we are in a Bullish Phase (risk-on) where buying assets like stocks offer more return than Gold, which should be converted to riskier assets.
-------------------------------------------------------------------------------
** Please LIKE 👍, FOLLOW ✅, SHARE 🙌 and COMMENT ✍ if you enjoy this idea! Also share your ideas and charts in the comments section below! **
-------------------------------------------------------------------------------
💸💸💸💸💸💸
👇 👇 👇 👇 👇 👇

S&P500 Short and medium term sell potentialS&P500 (SPX) made a yearly High last week and a Higher High on the Channel Up pattern that started on the October 13 2022 market bottom and guided the market out of the 2022 Bear Cycle. This Higher High opens up two sell possibilities one on the short and one on the medium term.
The short term indicates that a Megaphone pattern similar to April 04 - May 04 is emerging that targets the 1D MA50 (blue trend-line) as part of its Lower Low. That would also test the Internal Higher Lows trend-line, so it makes sense to short and target 4320. This is where we will attempt a medium-term buy targeting 4640 (March 29 2022 High) but will only hold it as long as candles keep closing above the 1D MA50.
If even one 1D candle closes below, it will activate the medium-term sell possibility and we will sell targeting the 0.5 Fibonacci retracement level towards the 1D MA200 (orange trend-line) as well at 4150, similar to December 22 2022.
-------------------------------------------------------------------------------
** Please LIKE 👍, FOLLOW ✅, SHARE 🙌 and COMMENT ✍ if you enjoy this idea! Also share your ideas and charts in the comments section below! **
-------------------------------------------------------------------------------
💸💸💸💸💸💸
👇 👇 👇 👇 👇 👇

SPX medium term pathwayThis update will be quick, Im very lazy this weekend.
ES short term was already posted earlier today.
There are 2 pathways Im following:
1 - H&S pattern, visible on the chart. That pattern if triggered will make full 5 down into early next year low to finish the whole move down from Jan high.
(Fits perfectly with VIX sky rocket from its below 20 level)
2 - Finishing the C wave up with A being over and B about to start.
Im still looking for 3750 level being hit to close the gap and one more rally over 4200 from there.
This scenario should play out quick or I will take it off the list if B is not reached by mid Dec.
Then a good rally into Jan high above 4200, check the number of the C ending on the chart.
Fibs align perfectly with this pathway!
We have a full Moon on Dec 8th, usually markets tend to make a high or a low at or around the full Moon.
It seems we are going to get one here early next week.
My best pathway is down to 4k tomorrow and rally from there into Tuesday high. There is a huge SPY put wall at 400 for tomorrow, Im sure it will hold on any test tomorrow, so if tested it will be a perfect long entry with a 15-20 points stop.
Or if 4k is broken then we should see 3940-50SPX zone tested which is the strongest support for the whole bull move here, should hold on at least 2 tests imo.
Also VP (volume Profile) line is around 3960SPX level, a perfect magnet.
So my next week game plan is - buy tomorrow low, sell Tuesday high (might stretch to Wed am high), then down we go into a rabbit hole with ideal target at 3745-50SPX.
Main bear bull support line is at 3940-50SPX level for the next week! Below it and this move up is over and the price will retrace back to 3750.
Have a very profitable week!

SPX Must hold 3970 tomorrow am or its goneAs you can see there is a lot of confluence at 3970 level (This chart become quite busy with the trendlines)
If we do gap down tomorrow below 3970, I will be looking to buy 3928-39SPX level for a broken trendline test, if not more.
This chart is similar to the ES, but has a higher level of support, so they have a bit different short term look one from another to my eyes, but the main picture is the same.
I really dont have much of a support if 3890-3910.50 is gone till 3744SPX!
So it better hold that level and ideally the 3928-39SPX support box.
Same as the ES, SPX has its trading cycles bearish now, expect short the rips all the way till the 19th of Dec!
Have a good night

Is the lagging S&P500 a better buy option than Nasdaq?Nasdaq's (NDX) incredible run (left chart) since the start of the year (+37%) has seen the index break above the Last Lower High of the Bear Cycle (13730) while at the same time avoiding a Death Cross on the 1W time-frame in epic fashion. It even broke above the RSI Resistance of the price's ATH (when the index was on its All Time High).
At the same time, the S&P500 (SPX) is obviously lagging behind (right chart) as not only the RSI is below its ATH Resistance but the index itself is only now approaching the Last Lower High of the Bear Cycle.
The question is, can the S&P500 be a better buy opportunity than Nasdaq since it is underperforming. Well being overperforming doesn't necessarily mean that Nasdaq is overvalued. Investors clearly thought at the start of the year that the technology sector would fuel the economy out of the 2022 inflationary Bear Cycle. However, it is also clear that the S&P has three target ahead of it (Last Lower High, First Lower High of Bear Cycle and the ATH), while Nasdaq two. In % terms, a ATH hit for the S&P500 from the current level would be a +12% rise, while for Nasdaq a 14.50% rise. Not that big of a difference on long-term terms and that has a lot to do with the fact that Nasdaq declined more that -37% during the 2022 Bear Cycle, while the S&P500 -27%. As a result, any buy between the two would be justified, even though a good pull-back on NDX would be more appealing to buy and couldn't be overlooked.
-------------------------------------------------------------------------------
** Please LIKE 👍, FOLLOW ✅, SHARE 🙌 and COMMENT ✍ if you enjoy this idea! Also share your ideas and charts in the comments section below! **
-------------------------------------------------------------------------------
💸💸💸💸💸💸
👇 👇 👇 👇 👇 👇

This signal on VIX can sustain the S&P500 rally.We don't often look at VIX but the times we do, it never fails to offer valuable insight regarding the long-term factors on stock indices trends. Since March, may have left wondered why the S&P500 (blue trend-line) has took off so considerably without any meaningful pull-back. Well despite the prevailing fundamentals surrounding the market overall, VIX (candles) has considerably calmed down, meaning that the market volatility has decreased, something that accelerated in early April when it broke below a Higher Lows trend-line that was holding for 5 years (since the November 2017 bottom).
This is a strong reason that keep adding fuel to this S&P500 rally and can continue to sustain it for as long as VIX declines. In fact the last time we saw VIX breaking below such a strong long-term Higher Lows trend-line was in July 2009, four months after the bottom of the 2008 Housing Crisis. The index has started its long-term recovery into a historically long and strong Bull Cycle and every spike on VIX was a medium-term pull-back on the S&P500 and a buy opportunity.
This fractal similarities is additional proof that the index is decisively past its 2022 Bear Cycle and is most likely starting a new multi-year Bull Cycle. If you are a long-term investor, pay attention to VIX's spikes in order to take advantage of medium-term buy opportunities.
-------------------------------------------------------------------------------
** Please LIKE 👍, FOLLOW ✅, SHARE 🙌 and COMMENT ✍ if you enjoy this idea! Also share your ideas and charts in the comments section below! **
-------------------------------------------------------------------------------
💸💸💸💸💸💸
👇 👇 👇 👇 👇 👇

S&P500 could start a 1 month correction.The S&P500 hit both targets we set two weeks ago as it reached the top of the 7 month Channel Up pattern:
This is the first major sell signal that we get on the 1D time-frame since the previous Higher High on February 02 2023. Unless the price closes a 1D candle above the August 16 2022 High (4327), we expect a short-term pull-back towards the 1D MA50 (blue trend-line) and Inner Higher Lows 1. Our Target is 4200. This sell signal will be invalidated if we close above 4327.
If we close a 1D candle below the Inner Higher Lows 2, we will re-sell and target the 1D MA200 (orange trend-line) and bottom of the Channel Up at 4000.
-------------------------------------------------------------------------------
** Please LIKE 👍, FOLLOW ✅, SHARE 🙌 and COMMENT ✍ if you enjoy this idea! Also share your ideas and charts in the comments section below! **
-------------------------------------------------------------------------------
💸💸💸💸💸💸
👇 👇 👇 👇 👇 👇

SPX500 New Week Possible MovePair : SPX500 Index
Description :
Bullish Channel in Short Time Frame and Long Time Frame as an Corrective Pattern
Break of Structure
RSI - Divergence
SMC - CHOCH
Completed " 12345 " Impulsive Waves
Fibonacci Level - 38.20%
S&P500 Closed above the 1W MA100 after almost 300 days.Major bullish signal for the S&P500 (SPX) as it closed a 1W (weekly) candle above the 1W MA100 (green trend-line) for the first time since the week of August 15 2022. That was the weekly candle that formed the next Resistance 1 in line, the 4330 level (Aug 16 High).
The 1W RSI has already broken above its Rising Wedge since two weeks ago and the 4330 Resistance 1 test seems inevitable. That will be the final barrier before testing the 4640 level of Resistance 2 (March 28 2022 High).
Needless to say, the index is long past the Bear Cycle, having broken above the Lower Highs trend-line, with the 1W MA50 (blue trend-line) in Support. The target of the Inverse Head and Shoulders pattern (Fibonacci 2.0) is marginally above Resistance 2.
-------------------------------------------------------------------------------
** Please LIKE 👍, FOLLOW ✅, SHARE 🙌 and COMMENT ✍ if you enjoy this idea! Also share your ideas and charts in the comments section below! **
-------------------------------------------------------------------------------
💸💸💸💸💸💸
👇 👇 👇 👇 👇 👇

💥SPX 4H-TIMEFRAME ANALYSIS💥 S&P 500 INDEX SPX 4H-TIMEFRAME ANALYSIS
💗Hello ladies and gentlemen
This is my new idea for 💥S&P 500 INDEX
I hope my idea is clear
Support me by like and share thank you
Stay Safe💯💲💲💲
Good luck💰😍

S&P500 Rising Wedge's short-term pull-back to the 1D MA50The S&P500 index (SPX) gave us the expected pull-back and buy entry within the Rising Wedge as per our last week analysis (chart below):
The long-term structure is a Channel Up, so plan your trades in case of a Rising Wedge break-out. On the short-term, we expect the price to pull-back to the 1D MA50 (blue trend-line) and the bottom of the Rising Wedge at 4140. As long as the pattern holds, buy and target the top at 4250. If the top of the Wedge breaks, target 4295m just shy off the long-term Resistance of 4327 (August 15 2022 High).
We will sell on the medium-term only if the price breaks below Support Zone 1 and target the 1D MA200 (orange trend-line), above Support Zone 2 and at the bottom of the long-term Channel Up. The 1D RSI Triangle pattern can give an early signal with regards to the direction in case of a break-out.
-------------------------------------------------------------------------------
** Please LIKE 👍, FOLLOW ✅, SHARE 🙌 and COMMENT ✍ if you enjoy this idea! Also share your ideas and charts in the comments section below! **
-------------------------------------------------------------------------------
💸💸💸💸💸💸
👇 👇 👇 👇 👇 👇

S&P500 New Bullish Cross can take it higher.The S&P500 index (SPX) hit last week our long awaited 4190 target, a level we set 2 months ago (see idea below):
That trade was taken right before the 1D MACD formed a Bullish Cross, the 2nd within the long-term Channel Up pattern. Last Thursday, the index completed the 3rd Bullish Cross of the Channel Up and continues to rise within a shorter term Rising Wedge.
With the 1D MA50 (blue trend-line) intact as a Support since March 29, and the price breaking above the (former) 4195 Resistance, we remain bullish and will buy again: a) if the price pulls back near the bottom of the Rising Wedge and target 4250 or b) if it closes a 1D candle above the Rising Wedge and target 4280 (top of Channel Up).
Similarly, we will sell the break-out if it closes below the 1D MA50 and target the bottom of Support Zone 2 and the Channel Up (Higher Lows trend-line) at 3950.
-------------------------------------------------------------------------------
** Please LIKE 👍, FOLLOW ✅, SHARE 🙌 and COMMENT ✍ if you enjoy this idea! Also share your ideas and charts in the comments section below! **
-------------------------------------------------------------------------------
💸💸💸💸💸💸
👇 👇 👇 👇 👇 👇

S&P500 The Cup pattern that nobody notices!We have been so focused on the short-term Channel Up on the S&P500 (SPX) since March (see idea below) that we didn't publish any analysis on the longer term dynamics:
This analysis offers critical insight on where we are with regards to the long-term/ Cyclical trend. One parameter that stands out is that the S&P500 index has failed on two occasions to break the 1W MA50 (red trend-line) since August 26 2022. It just so happens now that the 1W MA100 is exactly on Resistance 1 (February 02 High). A break above it is a buy break-out signal targeting Resistance 2 (4330).
However, it is equally probable to see a medium-term pull-back since, as you see on the chart, the curved Support Zone (dotted) that is connecting all the Lower Lows since December 2021 and provided all counter-trend rallies so far goes through th 1D MA200 (orange trend-line). A bounce there (could be within 3980 - 4000), confirms the pattern and would make the Channel's new Higher Low. If it breaks though, expect the 3810 Support 1 to be tested.
Notice also that the RSI on the 1W time-frame is approaching its own Higher Lows Zone, which has been a Buy Zone for exactly 1 year!
-------------------------------------------------------------------------------
** Please LIKE 👍, FOLLOW ✅, SHARE 🙌 and COMMENT ✍ if you enjoy this idea! Also share your ideas and charts in the comments section below! **
-------------------------------------------------------------------------------
💸💸💸💸💸💸
👇 👇 👇 👇 👇 👇

S&P500 The weekly chart puts everything into perspectiveAlmost 2 months ago and the S&P500 (SPX) hasn't diverged from our original idea, after buying the bottom of the 6-month Channel Up:
We believe that looking into the 1W (weekly) time-frame again will help at giving a fresh outlook and technically the best illustration of the current situation. First we narrowed the Channel Up to the candle bodies and treat the wicks as pressure points only.
As you see, the 1W MA100 (green trend-line) is the key element here as it has been the Resistance since the 1W candle of August 22 2022. The price came very close to breaking it on three 1W candles: September 12 2022, January 30 2023 and last week (May 01 2023).
Our trading plan is simple. If SPX closes a candle above the 1W MA100, we will buy the break-out and target the 4327 Resistance (August 16 High). Until then, we will wait for 4020 and buy at the bottom of the 1 month Megaphone pattern, approximately near the 1D MA200. In that case the bullish target will be the 4195 Resistance.
-------------------------------------------------------------------------------
** Please LIKE 👍, FOLLOW ✅, SHARE 🙌 and COMMENT ✍ if you enjoy this idea! Also share your ideas and charts in the comments section below! **
-------------------------------------------------------------------------------
💸💸💸💸💸💸
👇 👇 👇 👇 👇 👇
