SPX6900 Bulls Eyeing 33% Surge Toward Explosive $2.60 TargetHello✌
Let’s analyze SPX6900’s upcoming price potential 📈.
MEXC:SPXUSDT has maintained strong bullish momentum in recent weeks, supported by a stream of positive fundamentals 📈. The price is currently holding within an ascending channel and resting near daily support. If this level holds, a 33% upside toward the $2.60 target could follow 🚀
✨We put love into every post!
Your support inspires us 💛 Drop a comment we’d love to hear from you! Thanks , Mad Whale
SPXUSD

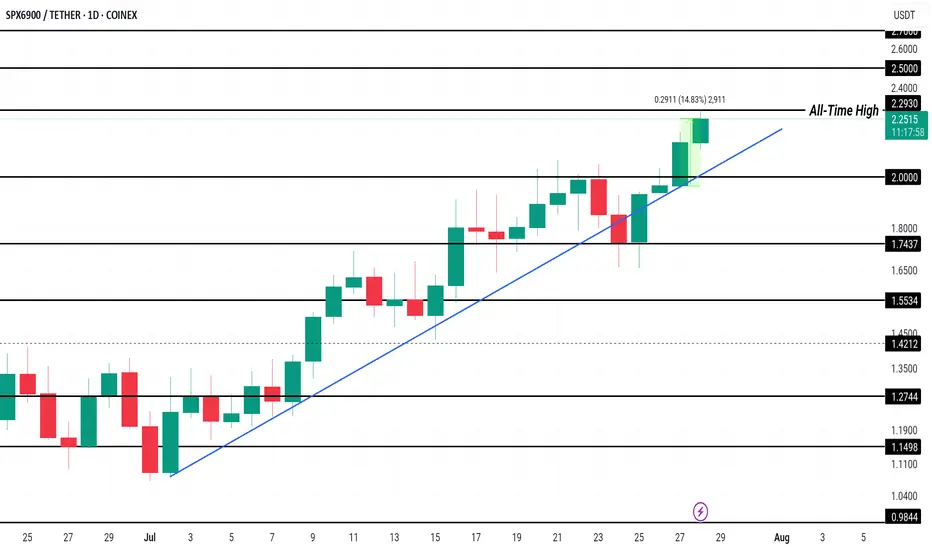
SPX Price Hits New All-Time High, $2.50 Up NextCOINEX:SPXUSDT has been experiencing a consistent uptrend since the beginning of the month, leading to the formation of multiple all-time highs, including one today at $2.27 . This price action reflects strong investor interest, pushing the altcoin to new levels and generating a positive market sentiment.
Currently trading at $2.23, COINEX:SPXUSDT has gained 14% in the past 24 hours . The Ichimoku Cloud, acting as support, signals bullish momentum. This suggests that SPX could rise further, with the potential to reach $2.50 or higher if market conditions remain favorable and investor confidence persists.
However, if selling pressure intensifies, COINEX:SPXUSDT could experience a reversal . A dip below the $2.00 support could push the altcoin toward $1.74 or lower, invalidating the bullish outlook.
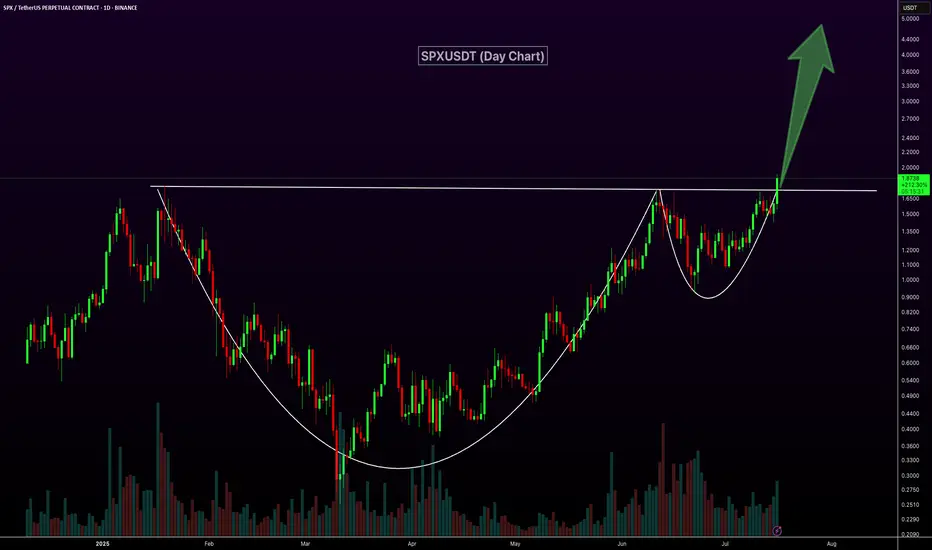
SPXUSDT Forms Classic Cup and HandleSPXUSDT daily chart is showcasing a strong Cup and Handle breakout with high volume, a classic bullish continuation pattern. After a well-formed, rounded base, price has cleanly broken above the neckline resistance around the $1.80 level, supported by strong momentum and a sharp bullish candle. This breakout signals the potential for a significant upside move, with the next leg likely to push toward much higher price levels.
SP:SPX MEXC:SPXUSDT
SPXUSDT Approaching Breakout Zone – 20% Potential Move?SPXUSDT is gearing up for a potential breakout after consolidating in an ascending triangle. Price is once again testing the key horizontal resistance at $1.38, which has held for several days.
Structure:
Ascending triangle on the 4H timeframe – typically bullish
Multiple rejections at the $1.38 level indicate a strong breakout if flipped
RSI is around 63, signaling growing momentum
Trade Setup (If Breakout Confirms):
Entry: Candle closes above $1.38 resistance
Stop Loss: Below $1.3422 support zone
Targets:
$1.4753
$1.5679
$1.7019
Potential upside of ~20% if momentum holds.
Support & Resistance:
Immediate Support: $1.3422 & $1.2962
Major Resistance: $1.38 → $1.4753 → $1.5679 → $1.7019
A breakout from this structure can trigger a strong bullish move. Watch for confirmation and volume.
DYOR. Not financial advice.

SHORT ON SPY (SPX/USD)SPY has a double top and is currently pulling back to a supply zone.
I expect spy to drop to the next demand level or FVG to the downside.
This is a sell limit order. Waiting for price to reach the supply area before taking the sell.

SHORT ON SPY (SPX/USD)SPY has failed to create higher highs and given us a head and shoulders pattern.
I will be selling spy to the next level of demand looking to catch 50-60 points.

SHORT ON SPY (SPX/USD)Spy has given us bearish divergence at a major supply zone.
I will be selling spy to the next support level.
Today is FOMC and I expecting it to influence spy move to the downside.

SHORT ON SPYNice Double Top at a Major supply zone on spy.
I will be selling spy to the next demand zone for almost 900 points. (INSANE)

spx500 bearish movewith the push to the upside in the 1hr crossing a previous resistance. using fib retracement getting in on this analysis

SPXUSDT is perhaps one of the best short term crypto investmentsSPXUSDT is having an enormous day so far that is about to test its All Time High.
The rebound is taking place after the 1day MA50 was tested and held, right at the bottom of the Channel Up.
Ahead of a 1day MACD Bullish Cross, this is a strong technical buy entry for the short term.
You can target the top of the Channel Up at 9.000, which would be a +9.38% rise, symmetrical with the coin's first.
Follow us, like the idea and leave a comment below!!

SPX Sell/Short Setup (2H)Hi, dear traders. how are you ? Today we have a viewpoint to Sell/Short the SPX symbol.
Considering the bearish mCH on the chart and the formation of an order block, we can look for sell/short positions within the red zone.
For risk management, please don't forget stop loss and capital management
When we reach the first target, save some profit and then change the stop to entry
Comment if you have any questions
Thank You

S&P 500: Long Trade Targets AheadS&P 500 Trade Details:
The S&P 500 (SPX) on the 15-minute timeframe confirms a bullish breakout according to the Risological trading indicator . Target 1 (TP1) has been successfully hit, with higher targets in sight, as the bullish momentum sustains.
S&P 500 Key Levels:
Entry: 5889.16
Stop Loss (SL): 5872.22
S&P 500 Take Profit Targets:
TP1: 5910.09 ✅
TP2: 5943.96
TP3: 5977.82
TP4: 5998.75
Analysis:
The price action indicates strong upward momentum with consecutive bullish candles. The moving averages align to support the trend. Short-term resistance at higher targets may see consolidation before further upward movement.
Outlook:
With TP1 hit, the trade looks promising to reach TP2 and beyond. Keep monitoring momentum strength and secure profits as each level is achieved. Stay cautious of reversals near key resistance zones.

Gigachad is about to giga sendMurads top 2 picks, SPX6900 and Giga have been shitting the bed the past 2 weeks while BTC, Raydium, SUI and the entire solana ecosystem rip.
Got a feeling.. GIGA and SPX6900 are about to melt faces.. Murad isn't wrong.
He's having his Michael Burry moment..
All of a sudden Alex Becker has shifted from shilling 40m mcap game coins to posting Giga Chad memes..
There is a flood coming.. position accordingly.

SPX500 Breakout ?Pair : SPX500 Index
Description :
Rising Wedge as an Corrective Pattern in Short Time Frame with the Breakout of Lower Trend Line. Break of Structure and Retracement. According to Elliot Waves it has completed " 12345 " Impulsive Waves. Rejecting from Strong Resistance Level

S&P500Analysis of the S&P 500
Weekly and daily time frame
The S&P 500 index is near the daily and weekly supply area, and long positions have higher risk.

ICT unicorn sell model at SPXas it is clear we see a FVG and a lower low after reaching to a new high last week.
so I suggest to have a sell model to 5164

SPX500Pair : SPX500 Index
Description :
Completed " 1234 " Impulsive Waves
Break of Structure
RSI - Divergence
Falling Wedge as an Corrective Pattern in Short Time Frame

#SPX/USDT#SPX
The price has been moving in a descending triangle since July 2023
We are now on the verge of breaking the downtrend
The moving average 100 was broken to the upside
Current price 0.3852
First target: 0.4300
Second target 0.5075
Third goal 0.5979

#SPX/USDT#SPX
The price is moving in a downward channel, and we are about to break it higher.
On the 4-hour frame, we saw clear upward momentum after some correction occurred.
Current price is 0.3715
The first target is 0.3930
The second goal is 0.4100
The third goal is 0.4290

5050 - Objective achievedConsidering the projection outlined for the future SPX in a previous analysis, I realize that the target pointed out by SETUP on the long-term chart has been reached.
Therefore, I think we have nowhere else to go up without at least having a small correction towards the 4685 region if I only consider the graphical analysis. See the image below.
Despite "reaching" the target, SETUP still shows that the index has a small strength to surpass this mark and reach the 5058 region, which can be seen as a buying trap for the most unsuspecting trader.
Coming to the short-term chart, the SETUP used indicates that we are in an extremely overbought region, therefore, it shows that the index is losing strength and that it really needs to make a correction. See below.
Do your analysis and it's good business.
Be aware, if you buy, use stop loss!
See other graphical analyzes below.

SPX Swing ShortChart is self-explanatory:
Confluences:
Deep Crab PRX
Top of the Parallel Channel
1.618 of the move from 4612 to 4100
Bear Div on RSI if We get a move down in coming weeks

#SPX SPX Jan 24th after the close updateSPX will be the first update from TheTradersRoom.
SPX has hit its desired target we have called yesterday - 4904.50-4909.50
So I call it a perfect hit. Today's reversal came on a heavy selling, also got a black reversal daily closing SPX candle, which if not broken 1c above should mark at least a temporary top.
If the price did find its top, then tomorrow's open should be a gap down below 4864 and my min target will be 4840-4835 SPX
We have a Panic cycle day on the 26th and Im looking for a first important low on Feb 1st
Happy to be back!

SPX, Bullish Megaphone pattern still not completed and in playHi guys, I want to share with you this bullish megaphone pattern. I had made several post on this pattern we still look to be following it. I am still bullish on the stock market in general even though things look bad right now. I have compared this on a monthly chart but the weekly looks very identical to the image I attached.
Please like if you find it useful.
Note: This is not a financial advice.
