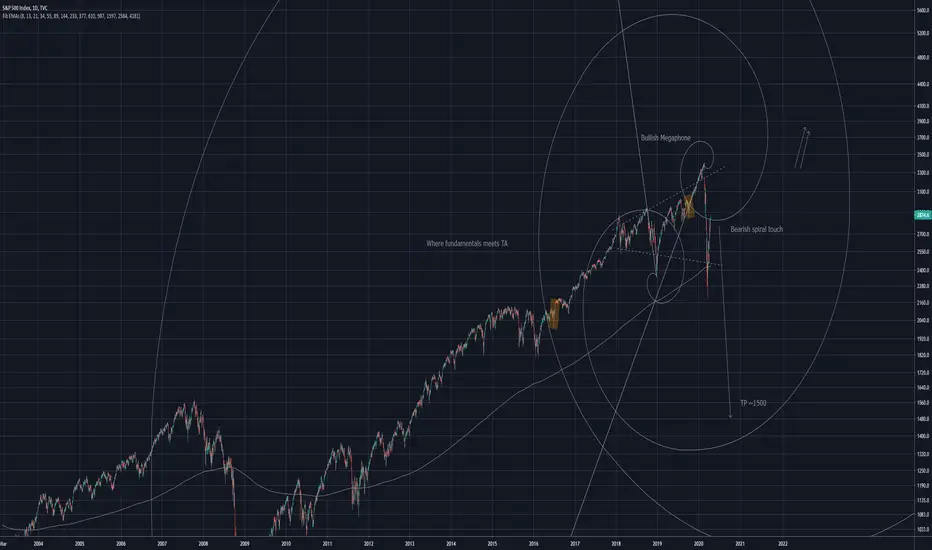
SPX Too good to be trueIt seems too good to be true! a bullish megaphone has emerged amidst all this chaos. This is where TA and fundamentals clash. Or do they?
As you can see the Fibonacci spiral provides sufficient resistance for a large drop. With the price gapping over the spiral!
I believe this to be one of the biggest bull traps i've seen.
I highly DOUBT we will see a follow through of this bullphone and a collapse is next.
SPXUSD


S&P 500 could reach 2900-3000 to complete correction The wave C could hit between 2900 and 3000 and there is a 61.8% Fibonacci retracement level.
Its C=A or C=1.272 x A.

SPXUSD/SP 500 sell at strong key areaSP 500/SPXUSD SELL SCALP
start: 2813.5
sto ploss: 2826.4
take profit: 2742.6

SPXUSD, Where to Sell?..The price can bounce off the Mirror Level 2854.0.
If you think about Buy position it will be better to wait for breaking the level.
This is a short term trade.
Push like if you think this is a useful idea!
Before to trade my ideas make your own analysis.
Thanks for your support!


SPXUSD LONGLook for opportunity to go long if the virus did not continue to spread at the rate is doing now

US Stocks to Finally Rise!!The final 5th wave is finally upon us! EW rules say that price should not break the red line on this chart. I am using a Downward Diagonal since this is the fifth wave which is only allowed during this wave according to Ralph nelson Elliott. I am excited to see the result of this move!


Nothing Weird is Happening with the Corona Virus in US StocksThe market is behaving exactly as it should. There is no special wave counts needed for the entirety of the recent downtrend thus far. I was able to quite easily decipher the Super Cycle wave all the way through the Minor wave for the current downtrend. That being said, due to the extreme volatility I am not trying to get exact dates and times for the waves but I am confident about the rough distances to the next waves and their degrees. I will keep updating my analysis as time progresses.
I would love and am encouraging constructive criticism or feedback if you have a different count than this one.
See my last post for the longer historical term EW count.

SP500 UpdateFollowing the previous study
The recent movement to anticipate is this. I will keep an open mind, as the structure is at peak. Could a retracement happen anytime soon? If yes, where will we wait?

S&P 500 eyes 3260 to complete correctionThe wave X could be over then we could expect the wave Y to unfold to reach 3260.
Or we will see the wave X extended then the wave Y will emerge later but the target would remain the same.

S&P500 LONG SET UP (CORONA VIRUS ANALYSIS)S&P500 BUY LIMIT
ENTRY 1 2938
ENTRY 2 2868
SL 2800
TP.1 3068
TP.2 3138
TP.3 3268
TP.4 3338

S&P500, next 3 possible scenarios after 1st SELL TP🔄 Update: Exactly as forecasted, the sell hit its target (390 pips) 😁👍
The second sell also as forecasted before is in the order, (in a lower time frame 1H I can see a small flag forming) but it still doesn't fulfill my requirements to take the sell.
So I have 3 ideas at this moment which depicted on the chart, based on likeliness.
1. A continuation of the sharp down move : To the 61.8% retracement which is happened to be 61.8% expansion area of the current bear move (check the first image below 👇)
2. A longer-term consolidation in the current range
3. A sharp impulse up
💬 Please let me know your perspective on this
Happy Trading & stay green! ✌️
➖➖➖➖➖➖➖➖➖➖➖➖➖
🔗 Check out the "Related ideas..." in the links below too
➖➖➖➖➖➖➖➖➖➖➖➖➖
📌 Kindly note that Forexian is not a signal provider. The published idea is ONLY our views and analysis of the market!
Forexian does not take any responsibility for your decisions and/or trades.

US indexes potential buys as NFP and technical analysis lines upAt a glance, the US indexes are looking nice for buys. I'm not too sure how to trade them other than speculation or just some technical analysis but I do know how to trade the news with them. We'll wait for BUY indications tomorrow New york session to check it out and potentially get into a BUY trade.

S&P500 SPX LONG SET UP AFTER CORONAVIRUS HIT MARKETBUY LIMIT S&P500
ENTRY 1 3014
ENTRY 2 3006
SL 2980
TP.1 3054 & TP.2 3106
Tp.3 3154 & TP.4 3206
TP.5 3254 & TP.6 3306
Stock market’s 6-day drop flirts with fastest slide into correction territory since 2008
Another sharp fall for U.S. stocks on Thursday pushed major indexes into correction territory, marking a drop of more than 10% from all-time highs. Here’s where major indexes would need to close to formally mark a correction.
MarketWatch · 9 minutes ago

SPX - Eyeing the 200 MA - Market UpdateThe SPX appears to be heading for the 200 daily moving average, this comes after the index fell below the 89 ema and subsequently failed to regain the level after last night's close.
I am expecting to see a near-term relief rally at some point as markets don't like to move straight down or straight up for too long, that being said the technical picture looks rather bleak for the SP-500.
This latest selloff is reminiscent of the Q4 drop in 2018, both in terms of speed and magnitude of the drop, using this as a rough guide (the macro outlook for the two scenarios are very different mind you), this would suggest that a trip to the 200 daily moving average is very much on the cards.
I would most likely expect the bounce to occur at the 200 MA, if it is to occur, but the daily RSI is signalling an oversold condition for the SP-500 so a bounce could materialize at any point.
I have already covered the Macro picture for the SP-500 previously (initial claims, PMI, Yield curve etc.) and the outlook signals a global slowdown, no two ways about it, the Covid19 outbreak could certainly be the catalyst for a prolonged selloff and worst case, the global slowdown.
Will the Fed step in to alleviate the markets?
Most likely yes, but the question is when, the current futures for the March 18th FOMC meeting are pricing in a 36% chance of a rate cut, up from 6.6% just one week ago.
So stimulus is coming, but the question is whether or not more monetary stimulus can offset the global supply chain issues that Covid19 are having on the economy.
www.cmegroup.com <----- FOMC Futures

Can S&P500 run through the tunnel?Falling wedge on SPX. We would not guarantee the wedge when there is a war in the middle east. Lets just all hope it doesnt get influenced which is not likely. Please share your ideas. Thanks


