$SPY $SPX Pullback to Gap Fill? I've been waiting for a rocket to AMEX:SPY $630 but my monthly tells me that February wants to close red. Here is my daily with a fib that we cant seem to hold above although today we did close above once I have been waiting patiently in this box unlike others, I have constantly reiterated, don't try to be a hero inside of the box. Now that the Box seems to be pushing towards the upside, I can't help but notice we continue printing bearish candles regardless of direction. Today we closed with a Hangman, which begs the question, could we perhaps lean bearish for two of the most bearish weeks of the year in comparison? I'd like to think I'm not wrong here and we will get a spill before anyone gets an expected blow off top. Be careful out there, volatility remains present and the VIX was above the 50DMA last time I checked. If we can get this gap fill and start moving back up, I will be confident in the gap fill being bottom. Seeing as $593 AMEX:SPY alert for bottom never filled, I will have to assume it's still a possibility. Taz out.
Spy!

$PLTR 4h RSI, Vol. Bearish Divergence4H chart showing divergence and may not necessarily be a top but could be pulling back for a test of support. Watch 10DMA for potential support.

$META CRASH in PROGRESS !! $600 incomingWowzers... I'm not sure what to say but ... good money is going to be made here for sure... would love to see this play out to the Tee... Take care yall ... DAILY BAR PATTERN from the Box of June 24' - Aug 24' .... I must say... let's make it happen..

Combined US Indexes - Incoming Break or Bounce ?From the previously marked timeline on 18 Feb 2025, just days later, you see the combined US Indexes plummet to cut through the middle decision box (purple), and extrude out below. This formed the double top second peak in essence, and the days following just closed at a two month low.
While this might appear Bearish, it is worth noting the lower tails in previous candles which are followed by rallies to the upper resistance. Would this happen the third time?
I would beg to differ...
In fact, marked out is a critical support point which should be tested in early March. At that point (yellow ellipse), there is a confluence of a previous trend change support, the current TDST and just below that the larger consolidation range support.
While the RoVD is slightly bullish, the MACD is dipping with MACD in bearish lower half, and the signal line tapering down towards the boundary into bear territory.
In summary, it looks slightly bearish to the critical support point. From there, it would be good to see if it bounces or it breaks down.

S&P500 How Expensive Is It?The Average Wage Earner Needs To Work166.5 Hours To Buy One Share Of The S&P500
If this chart does not drive the point home. Nothing will.
Sometimes simple common sense is more powerful than all the fancy analysis one can buy or think of to create.
Price is what you pay, and value is what you get! Remember that my friends.
DANGER IS SCREAMING AT YOU!

$TSLA testing new lows, Downside not complet yetAfter hitting an ATH NASDAQ:TSLA has lost the momentum. In this blog space we already propagated the idea that there is some more downside until the reaches the 200 Day SMA. We see that NASDAQ:TSLA stock has lost the 20 Day, 50 Day and 100 Day SMA and the next stops are the 200-Day @ 276 $.
But if we look at the Fib Retracement then the levels @ 0.618 with price 273 $ and the Fib level @ 0.786 with a price 215 $ are the key support level. If it reverts back to the 0.786 Fib level then it will loose all its election related gains.
But in contrast S&P 500 and NASADAQ100 are consolidating and not breaking down as $TSLY. So, we might see NASDAQ:TSLA underperforming the NASDAQ:QQQ over the next few weeks.
Long AMEX:TSLY between 250 $ and 200 $.

UP UP N AWAY TODAY LOW is 5 waves down for C or 1The chart is the spy The wave structure is a very clear 5 waves down to end wave 1 of the BULLISH Count wave C for WAVE B Low BOTH are Bullish Understand NOW . Best of trades WAVETIMER I am 70% long from 5969 and down at 5945 and added at 5908 enjoy the LONGS IF NOT Miss out

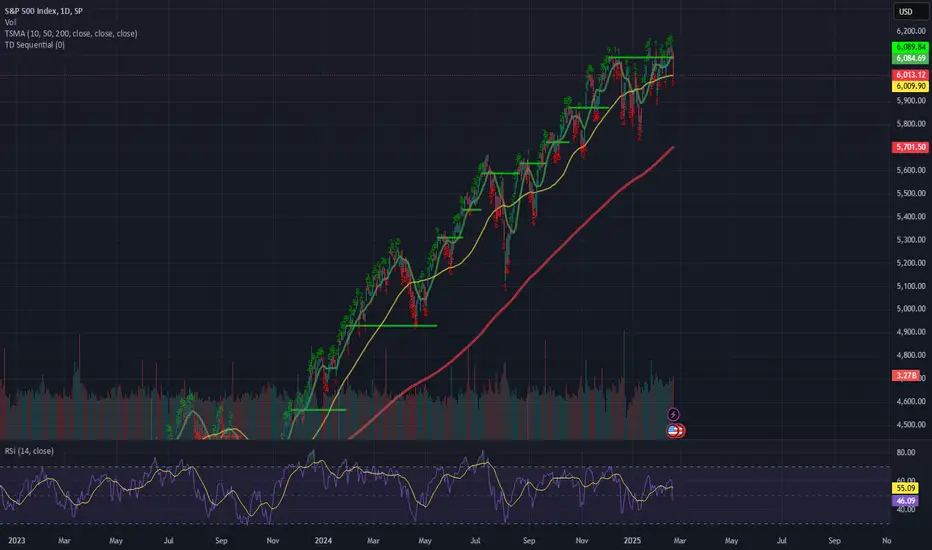
SPY Weekly Chart! I think downtrend has startedFrom a weekly chart perspective, I think we are going to start bear market pretty soon. Volume has been the lowest and I also see TTM squeeze in the weekly which was last seen in the pandemic era. I really think that investors should sell or cover their open positions.

SPY Weekly Chart! I think downtrend has startedFrom a weekly chart perspective, I think we are going to start bear market pretty soon. Volume has been the lowest and I also see TTM squeeze in the weekly which was last seen in the pandemic era. I really think that investors should sell or cover their open positions.
VIX daily - opex weekend at 28th FebWe are heading into an OPEX this 28th of Feb.
Volatility is running and seems like fear is all over.
Crypto is crashing and people are talking about fear and losing everything....
Well, the big whales are buying the dip and Eric Trump just tweeted about buying the dips.
For having a bottom process, it is essential to see the TVC:VIX hit that 23-25 area while its #RSI should be around 70 on the Daily chart.
In that way, we are more likely to have the bottom area and see the market turn and hard.
The US10Y is now at 4.3% which is going down and pushes the NASDAQ:TLT to higher prices.
I lean to the local bottom around 580-585 in the AMEX:SPY with a nice capitulation move that seems to be coming exactly with the OPEX and with liquidity issues in the entire market and in crypto.
I am looking to buy the dip and keep adding to my long positions in crypto.
CRYPTOCAP:AVAX CRYPTOCAP:ETH CRYPTOCAP:BTC $PAAL $DSYNC $AINTI AMEX:NHC LSE:ALU MYX:ASTRA $XBG and much more.

SPY support & resistant areas for today Feb 25, 2025AMEX:SPY So these are the support and resistant points for TSLA. Bounce off on these areas can initiate long or short positions.
If yall want me to post this every morning 9.30am please boost and follow me, so i know it is valuable for yall. Thank you

SPY/QQQ Plan Your Trade For 2-25-25: Rally PatternToday's Rally pattern will likely prompt a fairly strong recovery (upward) price move in the SPY before the markets turn/rollover and head lower again after reaching a top.
I see this move paired with the Metals cycle patterns, which suggest metals will move downward. I believe this will be the result of stronger USD price levels, which will translate into an initial SPY rally phase (driving the price higher) and then rolling over into more selling.
Ultimately, I believe the lows on Wednesday or Thursday will be the immediate base/bottom for this breakdown phase (near 587-593).
I'm not getting overly aggressive related to today's RALLY pattern.
I don't believe the markets have the momentum to rally very hard today and I believe we'll see a ROLLOVER type of move today - resulting in more downward selling.
BTCUSD is usually tied to the QQQ/NQ related to price action and the breakdown of BTCUSD may put additional pressure on the QQQ/NQ today.
So, get ready for a pretty volatile day. My estimate is price will ROLL DOWNWARD after a moderately strong open. Then, get ready for some volatility.
Get some.
#trading #research #investing #tradingalgos #tradingsignals #cycles #fibonacci #elliotwave #modelingsystems #stocks #bitcoin #btcusd #cryptos #spy #es #nq #gold

Nightly $SPY / $SPX Scenarios for 2.25.2025🔮 Nightly AMEX:SPY / SP:SPX Scenarios for 2.25.2025 🔮
🌍 Market-Moving News 🌍:
🇺🇸📈 U.S. Tariffs on Canada and Mexico 📈: President Donald Trump has confirmed that tariffs on imports from Canada and Mexico will proceed on March 4, 2025. This decision may impact trade relations and market dynamics.
🇰🇷💰 Bank of Korea Rate Cut 💰: The Bank of Korea is expected to reduce its key interest rate by 25 basis points to 2.75% on February 25, aiming to support economic growth amid recent slowdowns.
📊 Key Data Releases 📊:
📅 Tuesday, Feb 25:
🏠 S&P CoreLogic Case-Shiller National Home Price Index (9:00 AM ET) 🏠: Provides data on home prices across 20 major U.S. cities, offering insights into the housing market trends.
📈 Consumer Confidence Index (10:00 AM ET) 📈: Measures consumer sentiment regarding economic conditions. Analysts forecast a slight dip in February to 102.1 from January's 104.1, indicating potential shifts in consumer behavior.
📌 #trading #stockmarket #economy #news #trendtao #charting #technicalanalysis

$SPY Bull & Bear Options to End FebruaryThe AMEX:SPY is at a crossroads as we close out February. We’ve had hotter-than expected inflation, talks of tariffs, promises of deregulation, China’s stimulus rollout, and Wall Street’s continuing “soft landing” narrative. This is a time to be cautious. Friday’s PCE inflation data could sway the Fed’s March rate decision. Midterm elections and tax cut debates are heating up. Regardless of the noise, the levels show us the way.
We are trading in the range of $591 to $600. For this week, we will be using support over $597 as the entry for calls and a rejection under $600 for puts.
Here are this week’s AMEX:SPY options:
(15-30 minute candles for confirmation and stop-loss)
📜 $595 PUT 3/10 or $591 3/11 (Cheaper, but higher risk)
Entry: Retest & rejection under $600
Target 🎯 : $595, $591.50, (Continuation: $587, $585)
📜 $603 CALL 3/11
Entry: Breakout & retest over $597.70
Target 🎯: $601, $603, $603.44, (Continuation: $606, $608)

HIGH TIMEFRAME FVG STRIKES AGAINThey say look to the left right? Here we can clearly see the benefits of plotting previous level FVG's on higher timeframes, as well as basic daily liquidity. When plotting like this, it helps in contract selection. As options traders we're looking to make the most out of the market right? Whats sexier than a contract going from like .10 to $200!? By plotting liquidity and FVG's, we are aided in contract selection and it takes a lot of the hoping and wishing out of the trade. Are we sweeping liquidity or not? Are we on track to reach a higher timeframe FVG or not? Make sure you have your contract levels planned prior to market open so you can take advantage of these life changing moves!
My ideal entries. This doesn't always happen but its nice when it does!
- Break of 30m PMKT ORB (initial entry)
- Break of 15m ORB (add)
- Break of 30M ORB (add)
- Break of FVG (SELL!!!)
Just look to the left! Draw the lines, draw the boxes. and don't panic, you got this!
The blue shaded box at the bottom is a previous FVG plotted from the 6HR timeframe

S&P500 Index Goes 'Floundering', ahead of Bearish HarvestWhile the S&P 500 is generally expected to perform well in 2025, with forecasts suggesting gains ranging from 9% to 14.7% depending on the source, there are several factors that could lead to a less favorable performance or even a decline:
High Valuations: The S&P 500 is currently trading at high valuations, with a P/E multiple of 22 times projected earnings, which is above historical averages. This elevated valuation increases the risk of market downturns if there are negative economic shocks.
Economic Uncertainties: The economic landscape is filled with uncertainties, including potential inflation increases and geopolitical tensions. These factors can impact investor confidence and lead to market volatility.
Interest Rates and Bond Yields: Higher bond yields can reduce the attractiveness of stocks compared to bonds, potentially leading to a decline in stock prices.
Earnings Growth Expectations: While earnings are expected to grow, there is a risk that actual growth may not meet these expectations, which could negatively impact the market.
Policy Risks: Changes in trade policies, such as tariffs, and shifts in fiscal policy could also affect the market's performance.
Historical Patterns: Achieving three consecutive years of high returns (above 20%) is rare for the S&P 500, suggesting that 2025 might not see such strong gains.
Overall, while there are positive forecasts for the S&P 500 in 2025, these potential risks could lead to a less robust performance or even a decline if they materialize.
// While salmon make up the bulk of their diet, Coastal Brown Bears also enjoy a fresh flounder now, and again.
Best wishes,
PandorraResearch Team 😎

SPY WEEKLY 24 FEB 2025Welcome to SPY Weekly. I have clearly explained the price action & momentum in this analysis.
If you have any doubts feel free to ask.
NOTE:DO NOT BLINDLY FOLLOW ANYONE

US $ YEN BOTTOMING NOW SHARP RALLY BULLISH FOR SPY QQQThe chart is my work in the US/YEN I have NOT ALTER the Wave structure . We will now see a BOTTOM on the short term here or a minor new low .From here we should see a rather nice RALLY up in an ABC to .382 /.50% of this decline .This is friendly for the SPY and QQQ . BEST OF TRADES WAVETIMER

SPY/QQQ Plan Your Trade For 2-24-25 : Breakaway PatternToday's pattern suggests the markets will attempt to make a Breakaway move.
I believe this breakaway will be to the downside after watching the rejection near the 609 level on the SPY play out and the breakdown of the Excess Phase Peak pattern over the past 2+ days.
However, if the breakdown I suggested (above) does not happen, I suggest the markets continue to FLAG SIDEWAYS into a FLAG APEX near the end of this week.
The SPY's trend is such that I see it either breaking down hard over the next 2-3 days (confirming the Excess Phase Peak breakdown) or stalling back into the FLAG formation and reaching the Apex near the end of this week.
That means traders need to prepare for one of two major price events: a continued major breakdown or a consolidation/reversion back to the 605-608 level within a sideways FLAG.
What I expect is a breakdown in price. That seems the most logical. But, after watching the markets continue to flag sideways over the past few weeks, I know the markets can stay illogical for longer than I can try to short this top. lol
Gold and Silver look ready to rally. This could be a huge upward move and very powerful for skilled traders.
BTCUSD looks ready to break downward. And I think a breakdown in Bitcoin would be timed with a breakdown in the SPY/QQQ as well.
This is going to be an interesting week. Start off by letting the markets try to settle today (for the first 10 to 30 minutes). You can't kick the markets to do what you want.
After watching this moderate pullback in pre-market trading, we need to see how the price will attempt to trend.
Get Some.
#trading #research #investing #tradingalgos #tradingsignals #cycles #fibonacci #elliotwave #modelingsystems #stocks #bitcoin #btcusd #cryptos #spy #es #nq #gold

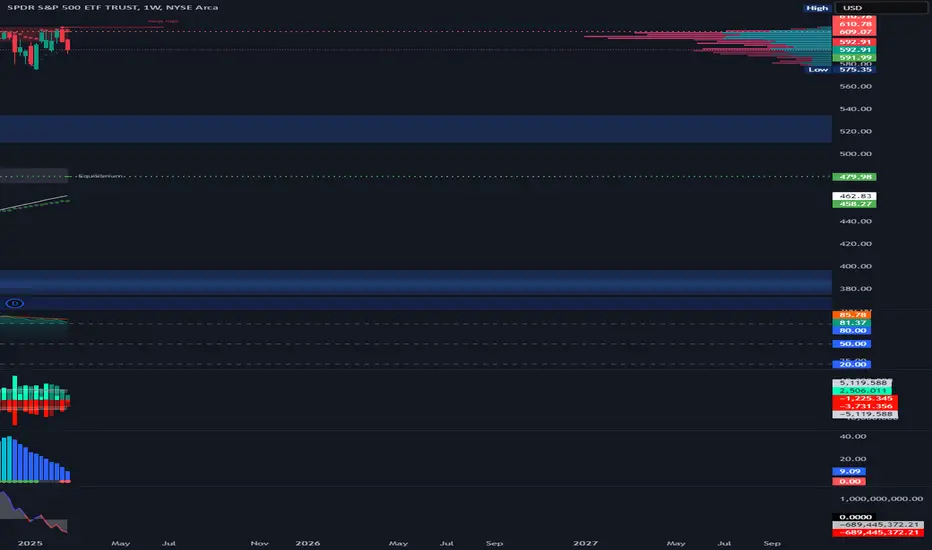
10D Chart shows Falling 3 , Pullback to 3/18!! $SPYAMEX:SPY shows 10D trend very clear. It is my hidden gem. We, by my charting, Should pullback until 3/18 ... not sure how far but I have plenty of targets on the way down to my ultimate target at 5200... I think we could flush to $560.. Good Luck yall. Gems I tell ya... sorry I'm so bad at explaining things..

$SPY $SPX OLD CHART BAR PATTERN COVID CRASH NOW!!!!Holy crap.... I just came across an old chart and literally in the nick of timeI tell you. All I'm going to say is... I'm a pattern chart trader and this is the COVID bar pattern attached to our daily from like a year ago almost and I loaded up an old layout to do work and boom... here we are... Good LUCK ... Not sure what the trigger will be but we are here.

$SPY $SPX OLD CHART BAR PATTERN COVID CRASH NOW!!!!Holy crap.... I just came across an old chart and literally in the nick of timeI tell you. All I'm going to say is... I'm a pattern chart trader and this is the COVID bar pattern attached to our daily from like a year ago almost and I loaded up an old layout to do work and boom... here we are... Good LUCK ... Not sure what the trigger will be but we are here.
$SPY short term top downside from $521 to $481AMEX:SPY is looking like it put in a short term top here. I originally only thought that we had the potential to fall to $545 or so, but now looking at the chart, I think we have the possibility of falling farther.
The two targets that I'm looking for on the downside are $524.35 and 481.18.
Let's see if they get hit over the coming weeks.
If they hit, it'll be the ultimate buying opp as I think from there, we're likely to see SPY over $700 in the coming year or two.
