2024-10-14 - priceactiontds - daily update - sp500Good Evening and I hope you are well.
tl;dr
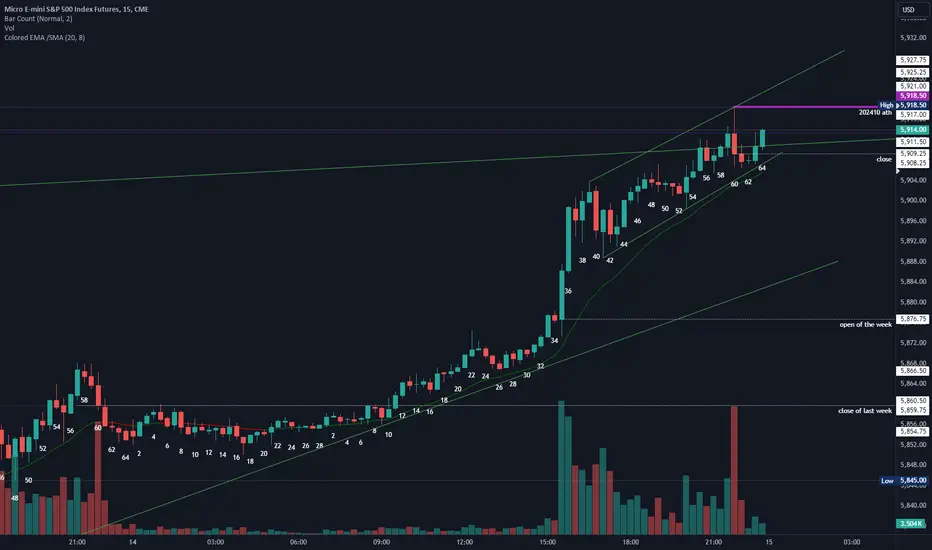
Indexes - In my weekly post yesterday I wrote “max bullish” a couple of times and I hope you did not short this today. Bulls are in absolute control and they have no reason to stop buying every small dip. You can not be a bear on the hope that this madness will stop eventually. It can go much further than you can imagine. Strong day, strong close, can only expect higher prices until bears print consecutive big bear bars on higher time frames. My best guess is still a blow-off top this week, which can mark the top before we see a bigger correction. Today felt like we are already in it.
sp500 e-mini futures
comment: Break above both bull wedges. Could this be a bull trap? I highly doubt that. 6000 will very likely be hit this year.
current market cycle: max bullish
key levels: 5860 - 6000
bull case: Bulls are in full control and we can only expect higher prices, given the strength of this follow through buying. We have a small channel which will likely break overnight and the next bull trend line is around 5890 already and aligns nicely with the 1h 20ema. Next obvious target is 6000.
Invalidation is below 5880.
bear case: Nothing really. Can they prevent 6000? Doubt it. Can they get a deeper pullback before we get there? Also doubt that. Anything below 5880 would surprise me. If they get it, 5850 is their next target and bigger support.
Invalidation is above 6050.
short term: Bullish af. Don’t look for shorts. Buy on pullbacks when bulls come around again.
medium-long term - Update from 2024-10-13 : Very rough guess for the remaining trading weeks in 2024. Spike up, decent correction (~10%), nasty (blow off top) year end rally if earnings hold in Q4. Don’t trade based on that guess.
current swing trade : None
trade of the day: Globex oscillated around last week’s close and after bar 10 it could not even touch the 15m 20ema again. Could have bought anywhere and made money except 15m before US close.
Spy!
SPY/QQQ Plan Your Trade 10-14 EOD Update - Rally Rally RallyWhat a great day for my followers! I created my Roadmap for all of you, and the markets have started this week doing exactly what I expected regarding the SPY/QQQ and Gold/Silver.
Next, we should see the rally continue in the SPY/QQQ, and Gold/Silver are moving into an Apex Breakaway setup, which could be very explosive to the upside.
Remember, what I do behind the scenes to prepare and understand market conditions is much deeper than what you see in these videos. Every weekend (and most days), I spend quite a bit of time trying to understand what is really taking place beneath the price charts.
That is where I gain a deeper understanding of what to expect and how prices will react to changing market dynamics.
So, if you like what you see in my Plan Your Trade videos - remember there is much more to do this efficiently than what I'm showing you in these Videos.
Also, remember, a Win is a Win. Book it and call it good.
Get some.
#trading #research #investing #tradingalgos #tradingsignals #cycles #fibonacci #elliotwave #modelingsystems #stocks #bitcoin #btcusd #cryptos #spy #es #nq #gold

SPY/QQQ Plan Your Trade For 10-14 : GapUp-Lower In Counter TrendGood morning,
This video highlights what I expect to happen in the SPY/QQQ, Gold/Silver, and Bitcoin over the next 5 to 7+ days.
Remember, I'm using my proprietary modeling systems, SPY/Gold Cycle Patterns, and other research to share a roadmap of expected price action 5- 7+ days into the future.
I don't know anyone else who can do this research accurately and provide such clear trade/entry/exit signals.
This week should be exciting as we'll see multiple opportunities in the SPY/QQQ and Gold/Silver.
Bitcoin is nearing a Phase #4 (consolidation) trigger near recent highs. At this point, traders need to wait for a breakout of the recent range before getting more aggressive with BTCUSD.
Let's get some this week.
#trading #research #investing #tradingalgos #tradingsignals #cycles #fibonacci #elliotwave #modelingsystems #stocks #bitcoin #btcusd #cryptos #spy #es #nq #gold

#202441 - priceactiontds - weekly update - sp500 e-mini futuresGood Evening and I hope you are well.
tl;dr
sp500: Also max bullish. Bulls closed 8 points below the ath. Strong buy signal going into next week but the issue (again) is that you are buying above the bigger bull wedge and at the very high of a nested one. Waiting for a pullback to go long is the much more reasonable trade instead of buying near 5860. The wedge has room to 5900, so 6000 is a valid year end target. Bear case begins below 5750. 5800-5850 is neutral.
Quote from last week:
comment: Much bigger range than the previous week with wild moves the whole week. Bears sold it with spikes, followed by bulls who bought every dip. End result was 5800 again and now what? We are near the ath and can easily make a new one. The high was also high enough to count as a decent lower high and we sell off from here. Given the strong bull bar on Friday, we have to give the higher odds to the bulls to get follow through above and we will probably make a new ath.
comment: Two decent days were enough for the bulls to make new ath. Again a bad place to trade, 8 points below the new ath. We have nested bull wedges and market broke above the bigger one. Odds favor some pullback but I would rather wait and be flat than to short this.
current market cycle: nested bull wedges
key levels: 5750 - 5900
bull case: Bulls want 5900 and have all the arguments on their side. That still does not make buying 5859 a good buy. It’s possible that bulls break above both wedges and continue for 5900 and much higher, is it likely though? I doubt it.
What, no more text? We have two perfectly fitting patterns and are trading at the very highs. I have given precise invalidation prices. Don’t think more words will make this better. Just as more trades probably won’t make you more money. Quality over quantity.
Invalidation is below 5750.
bear case: Bears have nothing until they close below 5750. We are at the highs but so what? 5 Consecutive weekly bull bars say it all. Don’t look for shorts when bears do not make money other than scalping on time frames below 15m. When these two wedges break below, we will see a decent correction again and it’s possible over the next weeks but as of right now, bears are in pain and nothing else.
Invalidation is above 5910.
outlook last week:
short term: Neutral 5750 - 5850, big range but we are in the middle of that given range and both sides have reasonable arguments. If bulls get follow through above 5800, long scalps are a decent trade for 5830 or a bit higher. Right now I would not trade it.
→ Last Sunday we traded 5800 and now we are at 5859. Neutral range but I wrote above 5800 a long is good for 30 points or more. Good outlook.
short term : Neutral since we are exactly at the top of two big patterns and 8 points below the ath. Sitting on hands is best here.
medium-long term - Update from 2024-10-13: Very rough guess for the remaining trading weeks in 2024. Spike up, decent correction (~10%), nasty (blow off top) year end rally if earnings hold in Q4. Don’t trade based on that guess.
current swing trade: None
chart update : None

AAPLTrigger for Calls is over 230.
Levels above are 233, 237.
Trade Idea: 232.5C Oct 25
**Earnings are on Thursday Oct 31.

SPY: Bearish Continuation is Highly Probable! Here is Why:
Remember that we can not, and should not impose our will on the market but rather listen to its whims and make profit by following it. And thus shall be done today on the SPY pair which is likely to be pushed down by the bears so we will sell!
❤️ Please, support our work with like & comment! ❤️

SPY BEARISH BIAS RIGHT NOW| SHORT
Hello, Friends!
We are going short on the SPY with the target of 545.10 level, because the pair is overbought and will soon hit the resistance line above. We deduced the overbought condition from the price being near to the upper BB band. However, we should use low risk here because the 1W TF is green and gives us a counter-signal.
✅LIKE AND COMMENT MY IDEAS✅

QQQ Weekly Outlook (SPY) for OCT 14, 2024A week ago, I provided a weekly long-term view of QQQ (link below):
I annotated that by looking at the weekly time frame, we can note that QQQ has been bouncing off the weekly trendline (TL) that started back in JAN 2023.
It has touched and bounced off that trendline 3x so far:
-MARCH 2023
-OCTOBER 2023
-AUGUST 2024
We started OCT 7th week around 487 and closed end of week at 493.36
Based on technical analysis, QQQ is in a triangle pattern with the top trendline starting on JULY 17th and then hitting it again several other times:
-SEPT 26
-OCT 9
-OCT 10
-OCT 11
The bottom trendline starts on AUG 5th and touches again on:
-SEPT 6
-SEPT 9
-SEPT 10
-SEPT 11
Another TL was drawn on SEPT 11 up which price has been respecting:
-OCT 2
-OCT 3
-OCT 4
-OCT 7
-OCT 8
-OCT 11
This has cause price to get tighter and tighter against JULY 17th TOP TL.
In addition, price has been making Higher Lows (HL) and Higher Highs (HH) starting from AUG 5th until current date. The following are the HH/HL:
HL: AUG 5/ SEPT 6 - 11 / OCT 1 - 3
HH: AUG 22 / SEPT 26 / OCT 11
The GAP that was created between JULY 16 - 17 was filled on SEPT 26 causing the market to GAP REJECT and push price down.
Price has once again come back to that gap and closed above it.
GAPS can be used in several ways. One being the initial rejection. As price is back above it again, what was once resistance / supply can now be potentially turned into support / demand. The second method can be the INVERSION of a GAP.
Utilizing my longer thesis from last week along with the new / current data, a bullish sentiment is formed going into this week for the following reason:
-Two bottom TLs have been respected and acted as support
-Higher Lows/Higher Highs are being made
-Price closed above the GAP that that acted initially as resistance and now turned into support (inversion)
-No economic catalyst for bearish scenario 'yet'
-Price had a strong close above the 5 and 8 EMA on the daily time frame.
Price Targets:
PT1: $498.44
PT2: $500
PT3: $501.01
PT4: $503.07
PT5: $503.52
PT6: $505
This is NOT financial advice but my opinion on the market.
NASDAQ:AAPL NASDAQ:AMZN NASDAQ:QQQ NYSE:ES SP:SPX #thestrat SEED_ALEXDRAYM_SHORTINTEREST2:NQ AMEX:SPY SEED_ALEXDRAYM_SHORTINTEREST2:NQ NASDAQ:MSFT NASDAQ:TSLA NASDAQ:NVDA NASDAQ:AMD
SaD

YEP! ALL-TIME HIGHS BABY! You're welcome! :)
Pretty simple... After identifying a candle with buying pressure, last week I announced that we would very likely be hitting new all-time highs simply by following the N# pattern that was unfolding at that very moment with precision.
VALIDATIONS ARE THE KEY TO PREDICTING A MARKET MOVE.
But what do I mean?
Here’s a recap of the moves I got in 1 week:
#1 It gave me a breakout.
#2 It gave me an exact retracement to my order block area that I was looking for.
#3 It gave me the volume I needed to see.
#4 It gave me a volume candle with buying pressure.
#5 It gave me an immediate bullish structure.
#6 The "N3" pattern is being fulfilled precisely.
How many validations do I have so far?
6 Validations!!!! Don’t you think we’re in a bullish scenario where, with all these validations being met exactly, we could see a new extreme, breaking new all-time highs?
OF COURSE WE ARE!
The more validations you have in an analysis, the more likely the scenario you’re looking for will be fulfilled correctly.
Now... Going back to SPY, all-time highs are uncharted territory! We must be very cautious, and as soon as the retracement begins, I’ll start my analysis again.
Best regards, and I hope this mini-lesson helps fine-tune your price analysis process.
Thanks for supporting my analysis.
Best regards.

Stock Market | TSLA NVDA AAPL AMZN META GOOG MSFT AnalysisQQQ Forecast
SPY forecast
TSLA NVDA AAPL AMZN META GOOG MSFT Analysis

SPY A Fall Expected! SELL!
My dear friends,
Please, find my technical outlook for SPY below:
The price is coiling around a solid key level - 579.57
Bias - Bearish
Technical Indicators: Pivot Points Low anticipates a potential price reversal.
Super trend shows a clear sell, giving a perfect indicators' convergence.
Goal - 573.88
About Used Indicators:
The pivot point itself is simply the average of the high, low and closing prices from the previous trading day.
———————————
WISH YOU ALL LUCK

10/11 Can positive earnings season secure BTC Pumpctober?Overview:
The AMEX:SPY continues its bullish streak, hitting a new all-time high and marking the fourth consecutive day of gains. But what’s fueling all this excitement? Just a few weeks ago, concerns about World War III and a looming recession were dominating the headlines. Now, it seems like the market is brushing off those fears. Pumping the AMEX:SPY means pushing up the stocks that make up the index, which suggests an improvement in their earnings, particularly net margins.
Conveniently, earnings season typically starts in mid-October and runs through late October and early November. This past week, giants like PepsiCo, Delta Air Lines, BlackRock, JPMorgan Chase, and Wells Fargo all reported earnings—and they all beat analysts' expectations. What’s notable about this group is its diversity: from consumer staples like food and beverages to airlines, signaling strong consumer purchasing power, to investment and banking companies, which are more dependent on macroeconomic factors and the Federal Reserve’s decisions. These companies, often beneficiaries of quantitative easing, could be the early indicators of a trend. With such a strong start, we might expect more companies to continue beating estimates, setting the stage for what we’re calling "Pumpctober."
In the coming week, we’ll hear from other banking giants like Bank of America, Citigroup, and Goldman Sachs. Healthcare heavyweights like Johnson & Johnson and UnitedHealth Group are also on the docket, along with Netflix. You can find the full list and earnings calendar here: www.ii.co.uk
So, let’s sum it up: the market is surging, consumer spending seems robust, and on Friday, Jerome Powell reported higher-than-expected CPI and core CPI. It feels like the economy is running hot, but that also means no immediate need for an interest rate cut. What clouds the picture slightly is a higher-than-expected number of jobless claims—258k compared to the expected 230k, and higher than the previous 225k. If unemployment continues to rise, it could impact company earnings by Q1 and Q2 of 2025. For now, though, we’re all in on Pumpctober, with a 90% chance of an interest rate cut in November, up from 82%.
ETF Flow: The big players aren’t buying BINANCE:BTCUSD or BINANCE:ETHUSDT . Retail investors are. BlackRock and Grayscale are still sitting on the sidelines.
BTC TA:
W: Bitcoin is barely holding onto the Bollinger Band MA and remains below the weekly and daily levels of $64 k. It’s also under the 2024 yearly point of control (Volume Profile indicator) level of $63.2k. However, we noticed that the current price is very close to the closing levels of the last two quarterly candles—June and September both closed at $62.6k. Until it breaks below $61.4k, we can’t call it bearish just yet.
D: Thursday’s close below the key $60.5k level appeared to signal a breakout, but BTC quickly retraced, turning that breakdown into a fake-out. If the stock market keeps rallying, some of that liquidity and optimism could spill over into crypto, completing a bullish flag pattern. Saturday is showing some bullish momentum, but we need today’s candle to close above $62.8k to confirm a higher high.
4h: On this time frame, Bitcoin is battling strong resistance at $63k. It’s unlikely we’ll see significant movement on a Saturday, as market makers tend to be less active, but if BTC fails to break out from $63k, it would confirm a bearish trend, and shorting from here could offer a good entry point.
1h: On Friday, we saw 7 consecutive hours of aggressive buying starting at 9 am NYC time, with volume doubling the average and pushing BTC from $61.1k to $63k, a 3.19% jump.
Alts Relative to BTC: What was a lower low for BTC was a higher low for ETH, SOL, NEAR, and BNB, which is a bullish sign. However, none of these alts have established a higher high, which cancels out the bullish sentiment. The best move for now is to avoid taking positions until there’s a major breakout with confirmation.
Bull Case: We could be on the verge of a trend reversal, breaking the bullish flag pattern. Both the US and Chinese economies are about to be flooded with cheaper money, which could flow into speculative assets like crypto.
Bear Case: This is an ideal moment to short BTC if it fails to reclaim resistance and turn it into support. The deadline for confirmation is Sunday evening.
Fear and Greed Index: 43, back to Neutral.
Prediction: All eyes are on Sunday, 9 pm EST and 6 pm PST, when Asian traders will return to their desks. Expect increased volatility as bulls and bears clash.
Mistakes: Both SUI and TAO have continued to pump higher despite lower volumes and volatile price swings of around 15%. If it establishes a higher high, stalls and you short - at least you can trade the range while BTC decides its direction.

Combined US Equities Breakout late OctoberVery quickly, the expected breakdown did not happen, and this week saw the an across the board bullish breakout. Noted the breakout is long in the teeth (old and late) and while bullish, it is not strong nor convincingly sustainable. Reminiscent of this expectation is the MACD and VolDiv looking lackluster.
Expected top marked, and after 21 Oct needs a review... that would be the projected resistance for a stronger pullback.
Bullish for now and the week ahead.
Enjoy, make hay while the sun shines!

SPY/QQQ Plan Your Trade For 10-11 EOD UpdateOverall, this week has been rock solid. Even though the markets moved downward after the US Treasury auction early this week, the recovery and rally on Thursday and Friday were right on schedule.
Remember, I've highlighted my SPY Cycle Patterns more than three weeks into the future before the beginning of October. Mapping Daily price action like this is impossible for almost anyone.
The idea that I can identify price patterns weeks and months in advance and attempt to identify where and when trade opportunities may exist based on these advanced patterns is of real value.
I'm not waiting for price to move in some formation or setup, I know where price will likely base/bottom, or peak/top, and I know where opportunities should exist for profitable trades days or weeks in advance.
Now, you've seen how these patterns work and how I use other advanced TA techniques to identify real opportunities.
What are you waiting for...
Get Some.
#trading #research #investing #tradingalgos #tradingsignals #cycles #fibonacci #elliotwave #modelingsystems #stocks #bitcoin #btcusd #cryptos #spy #es #nq #gold

Opening (IRA): SPY Oct 18th 515 Covered Call... for a 511.00 debit.
Comments: After taking profit, re-upping here out in October, selling the 84 call against long stock to emulate the delta metrics of a 16 delta short put, but with the built-in defense of the short call. Going lower delta here, since I've already realized gains for (basically) September.
There is a divvy to be had in Sept, with the last distribution being 1.76, so this will improve the unsexy ROC %-ages somewhat ... .
Metrics:
Buying Power Effect/Break Even: 511.00/share
Max Profit: 4.00 ($400); 5.76 ($576) with dividend, assuming a 1.76 distribution.
ROC at Max: .78% ROC at max; 1.13% ROC (with dividend)
50% Max: 2.00 ($200); 3.76 ($376) (with dividend)
ROC at 50% Max: .39% ROC. 74% ROC (with dividend)
Will generally look to take this off at >50% after the dividend drops or look to roll out in-profit short call to maintain net delta at +25 or less.

[Bearish] SPX and DJI formed rising wedgesBoth OANDA:SPX500USD and TVC:DJI have formed rising wedge pattern which is bearish in nature. If they breakdown from this structure then we should see around 10% fall from current levels. More details in the video.

SPY/QQQ Plan Your Trade For 10-11 : Inside Breakaway PatternHappy Friday.
Today's Inside Breakaway pattern for the SPY should prompt a solid rally attempt - where the SPY/QQQ should rally higher to close out the week. I'm targeting the 580+ level for the SPY over the next 5+ trading days.
Gold and Silver are moving into a Top-Resistance pattern. This suggests Gold and Silver will rally, form a peak, then roll slightly downward today. I'm still targeting the 2670-2680+ level for Gold as a peak today. Silver will lag, but will likely setup a peak near 32.00.
Bitcoin collapsed, then recovered overnight - forming a very large Deep-V base. Now, this recent recovery is setting up as a Bearish Excess Phase Peak pattern and may likely roll into the Downward Flagging phase.
Be aware, this type fo deep low was the result of a Bullish Excess Phase Peak pattern completing the full 5 phases - ultimately reaching the "ultimate low" with the Deep-V bottom.
This current setup in BTCUSD suggests price will attempt to recover as long as the Deep-V low price is not breached.
Volatility is here. Price ranges will continue to be volatile through and after the US elections.
So be aware that news, data, or other items may cause price to react very violently over the next 2+ months.
Get Some.
#trading #research #investing #tradingalgos #tradingsignals #cycles #fibonacci #elliotwave #modelingsystems #stocks #bitcoin #btcusd #cryptos #spy #es #nq #gold

75% gains BUY/HOLD IWM/RUS2K C*H trade setup🔸Hello traders, today let's review 2daily chart for IWM . Entering re-accumulation stage now, expecting range bound trading during next fer months. We've hit heavy overhead resistace / limited upside currently.
🔸The speculative chart pattern is bullish C*H in progress, expect more range locked price action for a few months as we re-accumulate and get ready to clear the ATH. Measured move price projectiong for the C*H structure is 350 USD, 75% upside from the recommended BUY ZONE.
🔸Recommended strategy bulls: wait for IWM to re-accumulate in the sliding
bull flag formation and get ready to BUY/HOLD low near 200 USD, target
based on measured move projection is 350 USD. good luck traders!
🎁Please hit the like button and
🎁Leave a comment to support our team!
RISK DISCLAIMER:
Trading Futures , Forex, CFDs and Stocks involves a risk of loss.
Please consider carefully if such trading is appropriate for you.
Past performance is not indicative of future results.
Always limit your leverage and use tight stop loss.

SPY/QQQ Plan Your Trade For 10-10 : Carryover in Carryover ModeToday's cycle pattern suggests the SPY/QQQ price action will be very similar to yesterday's price action. I believe the markets are starting to move away from the basing/bottoming phase and moving back into trending phase.
Thus, I believe the SPY & QQQ will begin a rally up to highs reached before October 20-21, then form a top, and toll downward just before the US elections.
Gold needs to find some support and move higher - away from the 2625 price level. It is critical that Gold stay above 2620 at this stage. if Gold falls below 2620 - there is a very strong chance Gold will move into deeper consolidation and fail to rally above the 2750++ level I expect.
BTCUSD has already reached my lower support zone. I do expect Bitcoin to consolidate a bit near this lower price channel, but the next move is to either revert higher, or breakdown even further. Currently, I suggest waiting 20 to 48 hours with Bitcoin to let price settle on a new trend.
Get some.
#trading #research #investing #tradingalgos #tradingsignals #cycles #fibonacci #elliotwave #modelingsystems #stocks #bitcoin #btcusd #cryptos #spy #es #nq #gold

80% gains AMD/NVDA Pairs Trade: Best Level to BUY/HOLD AMD🔸Hello traders, today let's review 4hour price chart for AMD.
Price structure is bullish inverted H*S setup with reload zone bulls
near 150 usd, currently expecting rejection near overhead resistance.
🔸AMD is trailing behind NVDA so far this year, YTD gains of 17%, NVDA
YTD gains at 167%. AMD is trailing behind NVDA massively and expecting
mean reversion / catch up trade later in 2025. AMD market cap sits
at 250 bln USD so it's an easy double from here. Fair value for AMD
is 500 bln USD, NVDA is valued at 3 T right now, which is massive.
🔸Recommended strategy bulls: Bulls wait for rejection from overhead resistance to confirm IHS setup / near 175 usd and wait for pullback/correction into mirror S/R level at 150/155 USD. BUY/HOLD setup, SL fixed at 125 USD TP1 is 250 USD TP2 is 300 USD in 2025. This is a swing trade setup with 80%+ upside potential, naturally more patience required to hit targets.
🎁Please hit the like button and
🎁Leave a comment to support our team!
RISK DISCLAIMER:
Trading Futures , Forex, CFDs and Stocks involves a risk of loss.
Please consider carefully if such trading is appropriate for you.
Past performance is not indicative of future results.
Always limit your leverage and use tight stop loss.

10/9 Good news and bad news...Overview:
Which would you prefer to hear first? Let’s start with the good news: the AMEX:SPY has updated its all-time high. If you have a 401k or any other pension fund, you’re likely seeing gains. Also, it's hard to argue that a recession is looming when the stock market is booming.
Now for the bad news: crypto is down. Normally, this wouldn’t be alarming, as all markets fluctuate. But it's concerning when we see a divergence between the stock market and crypto. Even riskier tech stocks, like those in the NASDAQ:QQQ index, climbed 0.79%. If traders are eager to buy equities, why not crypto, or at least BINANCE:BTCUSD ?
Tomorrow, all eyes will be on Jerome Powell as he delivers the CPI and Core CPI data along with initial jobless claims. Given that recent job reports nearly doubled expectations, we predict fewer jobless claims. The question is: will positive macroeconomic data help? On one hand, it means people have money to spend, which could benefit crypto. On the other hand, it could reduce the chances of aggressive rate cuts, keeping liquidity constrained, and preventing speculative assets from soaring.
BlackRock continues dollar-cost averaging into Bitcoin but hasn’t touched its ETH ETF. When did ETH become so hated?
CME fedwatch tool shows an increase in the probability of no rate cut in November, up to 17.2%, while the chances of a one-base-point cut sit at 82.2%.
BTC TA:
W: BTC needs to close above $61.4k to keep bulls in the game. Unfortunately, after today's drop, BTC fell below this crucial level, breaking the bullish structure it had been building since September 7th. Another important level is $62.7k, the point of control for the entire 2024 bull run, which was rejected yesterday. This week is shaping up to print another red candle, following the previous week.
D: While the weekly levels are invalidated, the daily levels still offer hope. BTC bounced from the $60.6k support level, and we haven’t seen four consecutive red days since August. If tomorrow's CPI data hints at a bullish sentiment, we might see a small rally back to $62.1k.
4h: Price is currently closer to the lowest Bollinger Band, indicating it needs to catch up with its moving average.
1h: BTC has reached the Bollinger Bands' moving average, but for a stronger recovery, it needs to break beyond this level on the 4h chart to confirm a bounce.
Alts Relative to BTC:
TAO, SUI, and APT have reached higher highs, but with lower volumes, suggesting that the bullish trend is losing steam. These gains were likely driven by retail investors, FOMOing into the rally. Meanwhile, FTM is showing bearish MACD divergence on the 4-hour chart and was rejected at its weekly resistance of $0.69.
Bull Case:
At $60k, BTC is relatively cheap, considering how much adoption and recognition crypto has gained in 2024. Since we didn’t experience a massive sell-off in September and have held up into October, this might be your last chance to buy BTC at a sub-$100k price. Additionally, we’re in the Fear territory on the Fear and Greed Index, which historically offers an 83% chance of profitability if bought during this phase.
Bear Case:
From a technical perspective, things look bearish. Many key support levels have been invalidated, and the likelihood of the Fed not cutting rates in November continues to rise.
Fear and Greed Index: 37 (Fear).
Prediction: BTC may rebound to $62.1k before resuming its decline. Expect TAO, SUI, and APT to follow BTC's movements, with a potential drop back to pre-BTC ETF levels, which could see declines of 55-60%.
Opportunities:
Short TAO, SUI, APT, FTM.

SPY Multi-Timeframe Analysis: S&P 500 ETF Trust (SPY)1. Weekly Chart:
Uptrend Intact: The weekly chart shows that SPY continues to trade within a broader uptrend, consistently making higher highs and higher lows. It has held above its key moving averages, particularly the 50-week moving average (blue) around $515.
MACD Momentum: The MACD histogram shows continued positive momentum. This suggests that bullish sentiment remains strong, with no significant reversal signals yet.
Key Resistance: We are testing the $577 level, which appears to be a significant resistance zone. If broken, SPY could extend toward new all-time highs.
2. Daily Chart:
Testing Resistance: The daily chart provides a clearer view of the immediate resistance at $577. We’ve seen several attempts to break through this level, but so far, the price has been contained below it.
Moving Average Support: The 50-day moving average (green) has acted as strong support, currently around $555.80. As long as SPY holds above this, the bulls remain in control.
Momentum Indicator: The MACD on the daily chart is trending positive, showing increasing bullish momentum. This signals that a breakout above $577 is likely if this momentum continues.
3. 4-Hour Chart:
Bullish Momentum Building: The 4-hour chart shows a series of higher highs and higher lows, indicating the bullish momentum is building. Price has been supported by the 50-period moving average at $564.10.
Immediate Resistance: The key level remains $577. A clear break above this resistance level on strong volume could signal further upside, potentially pushing SPY toward the $580-$585 range.
MACD Shows Caution: While the MACD remains in the green, it’s showing early signs of slowing momentum on this timeframe. This suggests that a brief consolidation or pullback might occur before a breakout.
4. 30-Minute Chart:
Tight Range Formation: On the 30-minute chart, SPY is trading within a tightening range, with support around $572.21 and resistance at $577.11.
Key Trendlines: We can observe two converging trendlines (green and red), which often precede a breakout. If SPY breaks above the red trendline (around $577), it could lead to a strong upward move. Conversely, a break below the green trendline would signal a potential retracement.
Bullish Outlook: SPY remains in a strong uptrend across multiple timeframes, with positive momentum indicators and key moving averages providing solid support. The next critical level to watch is $577. A sustained break above this could see SPY move toward the $580-$585 range, continuing the bullish trend.
Risk of Consolidation: However, there is a risk of short-term consolidation, especially on the lower timeframes, before any major breakout occurs. A drop below $564 on the 4-hour chart or $572 on the 30-minute chart could indicate a deeper pullback.

S&P 500 ETF (SPY) Rising Wedge Pattern?Could be wrong since I'm relatively new to trading. Isn't this a downtrend reversal pattern?
