SPY/QQQ Plan Your Trade For 10-9 : Breakaway In Counter TrendToday's video goes over why I believe today will be somewhat quiet in terms of trending and expectations. As I suggested in the video, today is a good day to trade with only 20-30% position sizes - or to take a day off and go golfing.
I don't expect any big moves today - even though today's pattern is a Breakaway in Counter-trend mode.
I believe the markets will pause today - seeking support/resistance and trying to establish a range for a bigger move on Thursday/Friday.
I hope you guys are learning how to use the Excess Phase Peak patterns more efficiently. They are not easy to learn - especially now that I'm showing both the Ying & Yang side of these patterns.
They happen everywhere and can be very important when making decisions.
Remember, price only does two things: Trends or Flags.
That's it. There is no other type of price action you have to prepare for.
Get Some.
#trading #research #investing #tradingalgos #tradingsignals #cycles #fibonacci #elliotwave #modelingsystems #stocks #bitcoin #btcusd #cryptos #spy #es #nq #gold
Spy!

10/8 Market Tensions as S&P500 Wobbles Ahead of CPI, BTC Holds.Overview:
The AMEX:SPY is hovering around its all-time highs, showing limited movement as investors await Thursday’s CPI report. Anticipation is building, but it seems the U.S. market may not make any significant moves until inflation data provides clearer direction.
BTC TA:
W: When examining the volume profile of this year's entire bull phase, the point of control—where the most trading volume occurred—stands at $63 K. This explains why BINANCE:BTCUSDT might consolidate at the current price range for longer than expected. Despite a second false breakout attempt, Bitcoin remains trapped between the crucial monthly support level of $61.4K and resistance at $64 K. On one hand, geopolitical tensions are escalating in the Middle East, while on the other, China's government has announced a $28 billion investment package. The SSE Composite Index surged 30%, though it recently corrected by 11% over the last two days. Notably, some of the significant green candles can be attributed to Asian market open times.
D: The daily chart paints a clear picture of the price struggling to escape bearish pressure. It’s hovering just below the Bollinger Bands’ moving average. Monday presented a bearish hammer, and Tuesday ended with an indecisive doji.
4h: No divergences are evident on the MACD or CVD. The RSI sits around 45, indicating balanced buying and selling pressure.
1h: Price is oscillating around the $62.2K point of control level without any strong signals for bullish or bearish momentum.
Alts relative to BTC: Major altcoins are moving in line with Bitcoin, with little divergence. However, SUI and TAO, after their impressive runs to all-time highs, have begun to correct.
Bull case: If Trump is re-elected, accompanied by more interest rate cuts, this could boost the bullish narrative. The bull flag on the weekly chart is becoming more apparent and, if it breaks out, could signal a further upward trend. The formation of a reverse head and shoulders at the beginning of July, August, and September also supports a bullish outlook.
Bear case: However, bears point out that we’re still in a pattern of lower highs and lower lows. The double fake bull breakouts in recent upticks further signal caution. The market lacks new narratives, and regulatory crackdowns continue. Major CEXs now require strict KYC compliance, cutting off trading access for users in China, the UK, the U.S., and other key markets. While VPNs offer a workaround, the risks of locked accounts on exchanges registered in jurisdictions like the Cayman Islands add significant risk for traders.
Fear and Greed Index: 41.71 - Neutral.

Using VIX futures to manage equity risk over the US Election One-way traders can look at expected volatility and movement in the S&P500 over the US election volatility is by looking at the premium or the differential that VIX October futures hold over VIX November futures.
Because the VIX index takes in a series of S&P500 options strikes that blend to create a 30-day implied volatility, the October VIX futures essentially looks at S&P500 volatility over the November US election.
Therefore, the higher the premium for VIX October futures over November futures, the greater demand for volatility over the election and the greater the implied movement in US equity markets.
This can be useful for traders who look at event risk and consider the propensity and extent of movement, and whether they want to hold exposures over that risk.
The code in TradingView to use is - VXV2024-CBOE:VXX2024

SPY is going to 580AMEX:SPY broke above the flag on the 4H and the next resistance is the 580 defined by the trendline.
There is also a lot of call flow for 580 expiring this October 25th so that will be a
Unless Bears can smash it below 572, the trade idea still stands
The 580 will also take it over the monthly bollinger bands and setup the market for a nice reversal

Analyzing BTCUSD Using Excess Phase Peak PatternsI've been getting lots of emails and comments about the Excess Phase Peak patterns I use on my charts.
They are really quite simple to understand once you learn their structure/process.
But, the hardest part of using them is they work as a YING/YANG type of price structure. While the bullish Excess Phase Peak patterns are operating, the other side of price action, the bearish Excess Phase Peak patterns, are also operating in price.
So, you have to be able to see what's in front of you from both sides.
In this example with BTCUSD, I try to highlight both the bullish and bearish Excess Phase Peak patterns for traders to learn to use them more efficiently.
Get some.
#trading #research #investing #tradingalgos #tradingsignals #cycles #fibonacci #elliotwave #modelingsystems #stocks #bitcoin #btcusd #cryptos #spy #es #nq #gold

Weekly $SPY Options SPY Options to Kick off October
Election is less than a month away. Investors are taking profit and repositioning defensively until after the election noise. VIX over $21. We’re still just 3% off from all-time highs. The next catalysts are rate cuts, job numbers, and earnings. We expect volatility until the election noise settles.
This week, we are leaning bearish to start the week. However, the upside trade has the most room for continuation. We are using 15-30 minute candle closes for confirmation.
Best of luck!
$569 Call 10/16
Entry: 15-30 minute confirmation OVER $568
Targets: $569, $571, $574
$565 Put 10/16
Entry: 15-30 minute confirmation UNDER $568
Target: $565
AMEX:SPY
SPY/QQQ Plan Your Trade For 10-8 : Gap Breakaway PatternToday's Gap Breakaway pattern suggests the SPY/QQQ will gap up and rally higher - moving away from yesterday's base/bottom.
Remember, we had two basing and bottoming patterns over the weekend. Although I don't really count weekend patterns as drivers of price trends, I view them as psychological patterns. In other words, they reflect expectations headed into the following week of trading.
So, the basing/bottoming patterns last weekend will likely resolve into a melt up type of trend this week and the gapping/breakaway patterns this week will, as a result, present a strong opportunity to the upside for traders.
Recently, I started drawing the "Roadmap" trade signals on the charts for traders. This is an attempt to make things easier for all of you. Allowing you to see where the opportunities are for Options or Share trades more clearly.
Ideally, if this works for all of us, then I'll be able to map out 4 to 7+ days of price rotation in clear trade triggers for all of us to use.
Now, something interesting I wanted to point out is the SPY has just moved into a #3 phase of an Excess Phase Peak pattern. It is a very small pullback off a high - but it is still a valid Excess Phase Peak pattern.
If price rallies today, as I expect, this rally will invalidate the Excess Phase Peak pattern and put us into a strong rally phase targeting $605 on the SPY.
Gold is getting ready to move into a basing/support zone over the next 18+ hours - then really start to rally higher.
BTCUSD has rolled downward - just as I expected moving into the #3 phase of it's Excess Phase Peak pattern.
Again, if you are not paying attention - I'm picking apart all of these charts very cleanly and the information I present should be helping you see and identify better trade opportunities.
Tell me how I'm doing.
Get Some.
#trading #research #investing #tradingalgos #tradingsignals #cycles #fibonacci #elliotwave #modelingsystems #stocks #bitcoin #btcusd #cryptos #spy #es #nq #gold

10/7 Can BTC hold bullish trend or was it a fake break out?Overview :
The AMEX:SPY posted a decisive red candle today, with a strong bearish body. It’s rare to see appreciating equities while global liquidity has been declining for 21 consecutive days. The index is now trading at the lower end of the range established after the rate cut. The main sectors pulling it down include big tech (with the exception of beloved NVDA, which rose 2.24%), as well as utilities, insurance, and finance. On the other hand, oil, gas, and healthcare showed gains.
Since Friday, the number of traders expecting no rate cut in November has quadrupled from 2.6% to 13.7%. This reflects market uncertainty: while no rate cut means continued tight credit conditions and less liquidity, it also signals the Fed’s confidence in a strong job market and rising salaries. The question remains, which factor will weigh heavier on speculative assets like crypto? Less liquidity suggests a bearish outlook, but a stronger job market could be bullish.
This week could be pivotal for crypto. The question is whether BINANCE:BTCUSDT will hold above the 61.5k support level or break down, ending the fifth wave of this year’s crypto bull run.
BTC TA :
Weekly : After bullish momentum yesterday and earlier today, Bitcoin has since corrected. It’s now sitting at the BB MA and has moved away from the biggest volume node, leaving the point of control (POC). The 61.3k - 62.6k range isn't seeing much volume, and BTC will either hold above this or break through, which would be critical.
Daily : Bitcoin retested the MM BA resistance after falling beneath it. Monday ended with a bearish hammer, signaling caution. No major divergences were spotted on key indicators. Last week on Friday we wrote "Daily had a nice pull back after dumping from bull trap. Given the last 16 days of trading, upper resistance is at $63.3 k. It will need a real miracle to brake that level." The promised pull back played out. Price actually rose to 64.4k. But miracle of braking it didn't happen.
4-Hour : No divergences, and the trend seems uncertain.
1-Hour : Over the weekend, Asian bulls pushed BTC upwards, triggering short liquidations that drove prices up to 63.9k. However, the upward movement was halted at the significant weekly resistance of $64 k. A pullback followed. Early Monday, U.S. bulls retested the $64 k level again, pushing prices as high as 64.4k. This retrace fell within the Fibonacci golden pocket, specifically between the 0.618 and 0.786 levels when measured from the high on September 27th.
Alts Relative to BTC: NEAR, APT, TAO, FTM, and SUI are outpacing BTC and other altcoins as Monday progressed. ETH and SOL, however, remain closely aligned with BTC’s movements.
Bull Case : Since early September, we’ve seen the beginnings of a new bull run, which could be fueled by potential rate cuts and improving macroeconomic conditions. A breakout from the bullish flag consolidation pattern forming on the weekly chart could lead to significant upside.
Bear Case: The fifth wave may already be over, and we could be headed downward, marking the end of this year’s bull run.
Fear and Greed Index : 41.49, indicating a neutral sentiment.
This week holds the key for BTC's next move. Will it hold support or break down? Stay tuned.

2024-10-07 - priceactiontds - daily update - sp500Good Evening and I hope you are well.
tl;dr
Indexes - Bears stuffed the bullish price action from Friday with a decent bear bar closing on it’s low. Markets continue in their respective trading ranges near the highs and the daily ema have held again. If bears can generate follow through selling tomorrow, the highs could be in for now and we could see a deeper pullback.
sp500 e-mini futures
comment: 5750 - 5800 is my neutral range (written in my weekly update) and bears managed to get 5734 but could not close below the daily 20ema. To take control of the market, bears need follow through tomorrow below 5720 and a close below 5700 would be good for them. If they fail, bulls will buy it and we continue inside the range.
current market cycle: nested bull wedges
key levels : 5700 - 5850
bull case: Bulls have to stay above the daily 20ema or lose control, that’s their target for tomorrow. Since market is trading below the 1h 20ema, we will probably go more sideways during Globex and EU session before we see a bigger impulse again. Bulls still have the lower wedge bull trend line around 5700 and that would be their last stand before bears can take control and push this much lower again. Odds favor the bulls to stay above 5690 until we tested the trend line more than once. They rarely break on the second/third hit.
Invalidation is below 5690.
bear case: Bears want to trade below the daily ema and test the bull trend line around 5690-5700. We have spent enough time at the highs and a new impulse is around the corner. As of now I have no opinion where we might break out to. Bears can also make the case for a head & shoulders top and a measured move down would bring us to almost exactly the 50% pullback of the recent bull trend (5638ish). Coincidences eh.
Invalidation is above 5850.
short term: Neutral at the daily 20ema. It’s more reasonable to expect more sideways instead of a breakout. When it happens, watch for follow through before you join the trend.
medium-long term - Update from 2024-09-22: Very much like my outlook in dax. Trading range on the daily chart and we are at the highs. We could make higher ones or not. Does not matter much. I expect at least 5300 to be hit again in 2024.
current swing trade: Nope
trade of the day : Globex was bearish enough and once market traded below the 1h 20ema, it could not stay above it for long. Overall I’d say it was a tricky day. Shorting inside the trading range bar 30 - 45 was not a good trade since market just went up and down inside the tight range. Bears showed some strength with bars 45 and 47. Can you then reliably short on bar 50? I doubt it. To weak of a signal and you have the bar 18 low, so you would be shorting low in a potential trading range. Bar 53 was even worse to short, since it was a perfect double bottom with bar 18. Bar 54 was the bar that surely made the market always-in-short and 55 was the give up bar but then market printed one more strong bear bar and reversed for 11 points, trapping late bears.

SPY/QQQ Plan Your Trade 10-7 Roadmap UpdateThis short video updates traders related to the SPY & GOLD Cycle Patterns and how I see price playing out over the next 48+ hours.
I also highlight the resistance level setting up in BTCUSD.
Should be interesting to see how this plays out over the next 4+ days.
Get some.
#trading #research #investing #tradingalgos #tradingsignals #cycles #fibonacci #elliotwave #modelingsystems #stocks #bitcoin #btcusd #cryptos #spy #es #nq #gold

SPY Will Collapse! SELL!
My dear subscribers,
My technical analysis for SPY is below:
The price is coiling around a solid key level - 572.97
Bias - Bearish
Technical Indicators: Pivot Points Low anticipates a potential price reversal.
Super trend shows a clear sell, giving a perfect indicators' convergence.
Goal - 570.79
About Used Indicators:
By the very nature of the supertrend indicator, it offers firm support and resistance levels for traders to enter and exit trades. Additionally, it also provides signals for setting stop losses
———————————
WISH YOU ALL LUCK

SPY/QQQ Plan Your Trade for 10-7 - SPY Cycle Patterns RoadmapThis week, I'm trying something I started over the last week or two - a "Roadmap" of what I expect to see price do going forward 7-10+ days.
Now, this is something most people won't do because it presents a "live or die" outcome. Either I'm going to be right (or somewhat right) about price action and can live with my expectations - or, I'm going to be completely wrong about all of my expectations and it will prove to be a failed exercise in the use of my SPY Cycle Patterns.
So, at this point - you know I'm hoping price does exactly what I expect it to do.
I started doing this about 2 weeks ago. I just started calling it the "Roadmap" for traders (tieing into the Plan Your Trade concept).
What I'm trying to do is to show you how I use my SPY Cycle Patterns (and other analysis techniques) to try to stay ahead of market trends. And you can learn to do this as well.
It just takes time, practice, and knowledge.
So, as we start the week out in early October - let's see how this plays out and if we get any surprises with price action.
I spend quite a bit of time going over BTCUSD today - pay attention.
Get some.
#trading #research #investing #tradingalgos #tradingsignals #cycles #fibonacci #elliotwave #modelingsystems #stocks #bitcoin #btcusd #cryptos #spy #es #nq #gold

SPX500 H4 | Falling to overlap supportSPX500 is falling towards an overlap support and could potentially bounce off this level to climb higher.
Buy entry is at 5,693.65 which is an overlap support that aligns with the 23.6% Fibonacci retracement level.
Stop loss is at 5,595.00 which is a level that lies underneath a pullback support and the 38.2% Fibonacci retracement level.
Take profit is at 5,826.06 which is a level that aligns with the 161.8% Fibonacci extension level.
High Risk Investment Warning
Trading Forex/CFDs on margin carries a high level of risk and may not be suitable for all investors. Leverage can work against you.
Stratos Markets Limited (www.fxcm.com):
CFDs are complex instruments and come with a high risk of losing money rapidly due to leverage. 62% of retail investor accounts lose money when trading CFDs with this provider. You should consider whether you understand how CFDs work and whether you can afford to take the high risk of losing your money.
Stratos Europe Ltd (www.fxcm.com):
CFDs are complex instruments and come with a high risk of losing money rapidly due to leverage. 59% of retail investor accounts lose money when trading CFDs with this provider. You should consider whether you understand how CFDs work and whether you can afford to take the high risk of losing your money.
Stratos Trading Pty. Limited (www.fxcm.com):
Trading FX/CFDs carries significant risks. FXCM AU (AFSL 309763), please read the Financial Services Guide, Product Disclosure Statement, Target Market Determination and Terms of Business at www.fxcm.com
Stratos Global LLC (www.fxcm.com):
Losses can exceed deposits.
Please be advised that the information presented on TradingView is provided to FXCM (‘Company’, ‘we’) by a third-party provider (‘TFA Global Pte Ltd’). Please be reminded that you are solely responsible for the trading decisions on your account. There is a very high degree of risk involved in trading. Any information and/or content is intended entirely for research, educational and informational purposes only and does not constitute investment or consultation advice or investment strategy. The information is not tailored to the investment needs of any specific person and therefore does not involve a consideration of any of the investment objectives, financial situation or needs of any viewer that may receive it. Kindly also note that past performance is not a reliable indicator of future results. Actual results may differ materially from those anticipated in forward-looking or past performance statements. We assume no liability as to the accuracy or completeness of any of the information and/or content provided herein and the Company cannot be held responsible for any omission, mistake nor for any loss or damage including without limitation to any loss of profit which may arise from reliance on any information supplied by TFA Global Pte Ltd.
The speaker(s) is neither an employee, agent nor representative of FXCM and is therefore acting independently. The opinions given are their own, constitute general market commentary, and do not constitute the opinion or advice of FXCM or any form of personal or investment advice. FXCM neither endorses nor guarantees offerings of third-party speakers, nor is FXCM responsible for the content, veracity or opinions of third-party speakers, presenters or participants.

US Inflation, Earnings Season Kickoff, Markets on EdgeS&P has failed to make all-time highs
Dow has failed to make all-time highs
Nasdaq has failed to make any new highs
Russell has failed to make any new highs
Oil rips on Middle East escalations
Dollar rips on technical support and bear trap play. Dollar is a big component to the stock markets edging higher for the remainder of the year (e.g. dollar strong = market weak, dollar weak = market strong)
I'm keeping it very simple and staying patient for any "dip" opportunities on indexes, stocks, and watchlist items
I still like Gold, Silver, Bitcoin long as well - again, patient on price action and entries
Major News this week
-US CPI (MoM, YoY, Core and Reg CPI)
-Earnings Season Kickoff - DPZ, DAL, WFC, JPM, BLK and others
Thanks for watching!!!

#Spx / SpySpx heading high after touching multi month resistance turn support area look clean above 200 Dma
A+ setup perfect place for risk and reward ratio trade
DYOR!!

#Uber Uber is testing previous resistance turn support and showing bullish characteristic
Above 200 daily moving perfect risk to reward ratio
Dyor!!

SPY is looking Very Sexy ! There is 1 more step to go ! N3 Confirmed!! The price is doing exactly what we had predicted (see previous analysis).
Indeed, the price bounced in the zone we had predicted last week, creating an "N3" pattern. Now, we are waiting for the final phase of the N3 pattern, which is to reach new highs or new extreme.
What do we need to see?
This phase is of great importance because, if completed, we would be at new historical highs again.
The Key is the Last Candle: If you can observe the last candle on the chart, you'll see it has a very long lower wick. I call this a buying pressure candle; however, we need confirmation with the next candle, which should have a large bullish body in order to reach the new extremes we've been seeking.
So, we can conclude that by putting all the points together when analyzing this chart, we have a bullish outlook for the rest of next week. However, it’s important to remember that we need solid confirmation with a bullish candle to confirm we will have a green week!
Best regards and success in your trades.
Thanks for supporting my analysis.

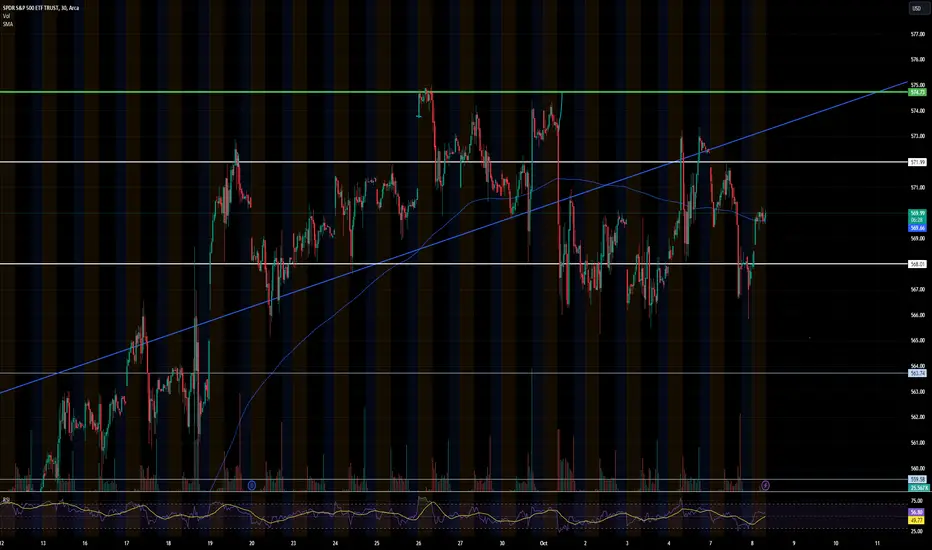
S&P to make all time high before election dipPrice stays above 571 ,we are looking at 573, 578, 580 & 581 for next 2 week.
If 571.95 is respected meaning no close = Bullish
If price breaches 571, likely go to 568.11-567.91 level.
Close below 567.91, will test 565 , 564 levels

$QQQ Longer ViewpointNASDAQ:QQQ is lagging behind AMEX:SPY and has not reclaimed ATH ' yet .'
Looking at the weekly time frame, we can note that NASDAQ:QQQ has been bouncing off the trendline that started back in JAN 2023.
It has touched and bounced off that trendline 3x so far:
-MARCH 2023
-OCTOBER 2023
-AUGUST 2024
Each time it bounced, it ran for approximately 100pts + and took roughly 124 - 140 days before consolidation and/or a correction / retracement / pullback occurred.
From a technical standpoint, NASDAQ:QQQ will attempt at All Time Highs (ATH) at $503.52 again. We have to be conscience of the divergence between AMEX:SPY and $QQQ. AMEX:SPY has already made a new ATH while NASDAQ:QQQ is lagging behind.
If ATH is broken on NASDAQ:QQQ and price move similarly to the last two weekly trendline bounce, then price could reach $528 and some change before possible consolidation and/or a correction / retracement / pullback occurred with a timeline of around mid-December.
Failure to reclaim and/or break ATH can cause NASDAQ:QQQ to return back to the trendline.
This is NOT financial advice but an opinion.

Stock Market | TSLA NVDA AAPL AMZN META GOOG MSFT AnalysisQQQ Forecast
Sp500 ETF analysis
Nvidia Stock NVDA Forecast Technical Analysis
Apple Stock AAPL Forecast Technical Analysis
Microsoft Stock MSFT Forecast Technical Analysis
Google Stock GOOGL Forecast Technical Analysis
Amazon Stock AMZN Forecast Technical Analysis
Meta Forecast Technical Analysis
Tesla Stock TSLA Forecast Technical Analysis

$SPY OVERIVEW ON THE MONTHLY TIME FRAMEAn overview of AMEX:SPY from a technical standpoint. This does not include any fundamental / economical consideration.
AMEX:SPY has been in this rising channel since 2020.
Each wave / rejection from the trendline / channel caused a 10 - 12 month directional move 100pts +.
AMEX:SPY is at the top trendline / channel again. Could see an upward continuation of price in an attempt to hit $600. Failure to break through $600 could start the retracement / correction / pullback over the next 10 - 12 months back to the bottom of the channel / trendline.
This would put AMEX:SPY at around $500, give or take 20 - 40 pts. This would be in alignment with what some of the more well-known analyst / economist has been stating about 15/20% correction.
Reason for the margin of error is the last two waves moved an avg of 140 pts. $500 is a key level psychologically and from an algorithmic point of view.
$600 is also a key psychological / algorithmic level as well. If there is a break of this level, market could see another 20 - 40 pts topside move before consolidation and then possible retracement / correction / pullback.
This is NOT financial advice but merely an opinion.

10/4 Nice rebound. Can we crash now? Overview:
The AMEX:SPY opened Friday significantly higher than Thursday’s close, forming a bullish hammer candle and edging closer to its all-time high. This week closed higher than the previous week, though the previous week did see higher prices.
The NASDAQ:QQQ mirrored the S&P’s action, showing similar price movement. BlackRock continues dollar-cost averaging into its ETH ETF, while other major players remain on the sidelines.
One critical trend to monitor: Bitcoin has historically struggled to hit new all-time highs or maintain upward momentum when the Global Liquidity Index is in decline. Unfortunately, the index has been falling for the past 19 days.
You can learn more about Global Liquidity Index and add it to your chart:
The CME Fed Watch Tool has now removed the possibility of a half-percentage point rate cut in November, replacing it with a chance of no rate cut at all. Currently, 2.6% of traders believe there will be no rate cut in November, while 97.4% expect a 1 basis point cut. Even with a rate cut, it will take time for liquidity to flow back into markets. By the time that happens, Bitcoin may hit its bottom for this cycle, signaling the start of a new bullish phase. Be sure to have cash ready for that opportunity.
BTC Technical Analysis:
W: BTC’s price is nearing the Bollinger Band Moving Average (BB MA) at $62.6k. If Sunday’s price rises by $456, it would close at or above that level, offering temporary hope to bulls. However, a more critical level to watch is the previous weekly close at $64.1k.
D : After a significant pullback from the bull trap, daily resistance is set at $63.3k. Breaking that level will require significant momentum.
4h & 1h: No clear signals on these timeframes. In a limbo.
Altcoins Relative to BTC:
APT and TAO have remained stable over the last 5 days, showing no significant declines after BTC’s bull trap. Shorting opportunities might arise soon.
Bull Case: Looking at the past 28 days, we see a clear bullish trend with higher highs and higher lows. As liquidity eventually enters the market, more capital could flow into crypto, pushing prices higher.
Bear Case: On a broader scale, since the start of the year, the market is still showing lower highs and lower lows, suggesting bearish risks are still present.
Fear and Greed Index: 40.78 – Back to neutral.

Predictive Correlation the SG10Y Bond Yields on S&P500I have posted about this correlation previously. Perhaps this time it might be clearer to see...
This uncanny correlation between the SG10Y Govt Bond Yields as a leading indicator for the S&P500 was noticed some time ago, and tested since.
As shown, the major turning points were seen in trend changes of the SG10Y GBonds first, before the S&P500 reacted. The vertical time markings show when you would short or long depending on the trend breakouts of the SG10Y GBonds (see lower panel, blue line),
Comcomitantly, comparing what happens from that point, you can see the S&P500 in the upper panel with yellow line.
The lowest panel is the MACD... and this shows the correlated pattern of a (lagging) technical indicator.
Since 2023, there are at least six instances with 100% hit rate.
Now... that brings us to TODAY.
It appears that we are given advance warning of the next couple of months.
For now, there should be a quick pop up to the very recent high followed by a failure of support in the S&P500; and then the expected trends should play out...
