YENOCALYPSE. TO BE CONTINUE...The yen has posted several outsized moves in recent days, appreciating sharply on Thursday and Friday from 38-year lows of 161.96 per dollar, sudden rallies that market participants said had the signs of currency intervention.
Bank of Japan data released on Tuesday suggested Tokyo may have spent 2.14 trillion yen ($13.5 billion) intervening on Friday. Combined with the estimated amount spent on Thursday, Japan is suspected to have bought nearly 6 trillion yen via intervention last week.
In technical terms, USDJPY Fx pair has broken its major Bullish 7-months trend.
What is next? I think retrace is possible.. But just to deliver much more to 152nd ground.
// Mega stocks are in ruins..
Spy!

SPY/QQQ Plan Your Trade For 9-6 : Blended Top/Flat-DownHappy Friday.
I believe today's pattern is a blend of yesterday's Top-Resistance and today's Flat-Down pattern.
Because of this belief, I think we will see a moderate rally in early trading leading to a peak in price, then followed by a moderate flat-down type of price trend.
This week has proven to be a bit more volatile than I expected, but it has not changed my expectations much in terms of where I believe the markets are headed over the next 90+ days.
Price is dynamic and reflects not only fundamental economic expectations but also future performance expectations.
This pullback in price is somewhat healthy (closing the gap) on the SPY chart to clear the way for further upward trending.
Let's see how things play out today.
Get some.
#trading #research #investing #tradingalgos #tradingsignals #cycles #fibonacci #elliotwave #modelingsystems #stocks #bitcoin #btcusd #cryptos #spy #es #nq #gold

S&p 5400 coming Ai bubble popping as we speak 9/5 2024 NVDA books reflect sales to companies that now are under scrutiny geopolitics hot oil choppy avgo missed earnings rate cut drama the cooks at the BLS continue to chef it up with wild swings in reports and revisions all with the last US election in the rear view mirror

SPY recent rally failed to make new highsLooking back at the last two major rallies we see that the latest one has not broken above to new highs. Raises concerns of longer term rallies less likely to happen
SPY is forming double top reversal pattern
Longer term future rallies called into question
More defensive sectors are experiencing rallies over the past year (XLU for example)
Defensive sector long term rallies shows rotational shift from risk assets (tech) to safer assets (utilities, healthcare, gold)
Seeing signs of late cycle investing
2025 could be a rough year for SPY and especially tech
Bullish purchases should be done with caution

Double-Top In PlayAs expected, SPY double-top looks to be playing out. I don't expect us to drop much lower than the pink ascending trendline. Maybe we'll touch that 200 dma before our full send. Let me remind you that the pink ascending tl is the neckline of a large cup and handle pattern on the bi-weekly, the target of which remains 650-700. This is still in play on the longer timeframe and as long as we don't break below the pink tl with confirmation on the weekly, I will start to buy back at or around the pink tl and down to the 200 dma. Batting 1000% thus far and hoping to keep it perfect.

Oops SPY Bear dance might have just begun.We are seeing some really impulsive moves coming up and at this point it really important to trade with the trend. A complete analysis coming in soon.

SPY/QQQ Plan Your Trade For 9-5 : Top-Resistance PatternToday's Top Resistance pattern should reflect a moderate price rally, leading to a peak in price, then followed by a roll-over in price before the close of trading today.
Follow my research. Remember we are using my SPY cycle patterns to help guide our future and current trades related to price action.
These patterns are not 100% accurate all the time - but I find them very helpful in understanding how to prepare/trade related to potential future price swings.
Again, outside news events, central banks/governments, wars and other massive events can disrupt these patterns for 3 to 10+ days. But, price always seems to return to the patterns over time. These disruptions are temporary.
Get ready for next week's big rally phase.
Get some.
#trading #research #investing #tradingalgos #tradingsignals #cycles #fibonacci #elliotwave #modelingsystems #stocks #bitcoin #btcusd #cryptos #spy #es #nq #gold

Combined US Indexes - Warning Trend Change to DOWNFrom the last post, there was a Gap closure and breakout... well, almost. What happened was a stall after the gap closure. This is the first indication that something is not right and a strong resistance is in the way.
After more than a week, a decisive down candle wiped out two prior days of bullish candles, and reopened the earlier gap. This by itself is very bearish... first on the candlestick pattern, and next on the reopening of the gap.
MACD have crossed under the signal line, in support of the bearish undertone.
Now, we wait for a full reopening of the gap, meaning a further breakdown of the supports.
By simple projection, the down wave from mid July to August (blue arrow) is projected from the last lower high in mid-August.
This brings the target to mid-September, at an old critical support level of 780.
Oddly enough, am expecting this to happen by the end of next week.

NQ what’s your Iq - sleep increases IQSet the alerts. Set the brackets. Set the trade. Then get to sleep. Will we wake up with a win. I’ll dream on it.
1hr strong close up.
We have a structure shift. My entry is set at the area of value where the un filled orders were left behind that originally created this push up.
2:1?
2.5:1? We’ll see. My data says 2.5


Bear Pressure Remains (Key Levels to Watch - SPX, NDX)Tuesday - Bear Candle breaking support
Wednesday - weak re-test of the support (now becoming resistance)
Bearish pressure remains firm with key levels lower on the major indexes.
Near-term bearish until price proves otherwise. Taking stops, protecting profits and managing hedges.
JPY "unwinding" is also back on the radar. I'll be watching the JPY strength and Nikkei correlation. I still hold long FXY through 2026 (call options)
Thanks for watching!!!

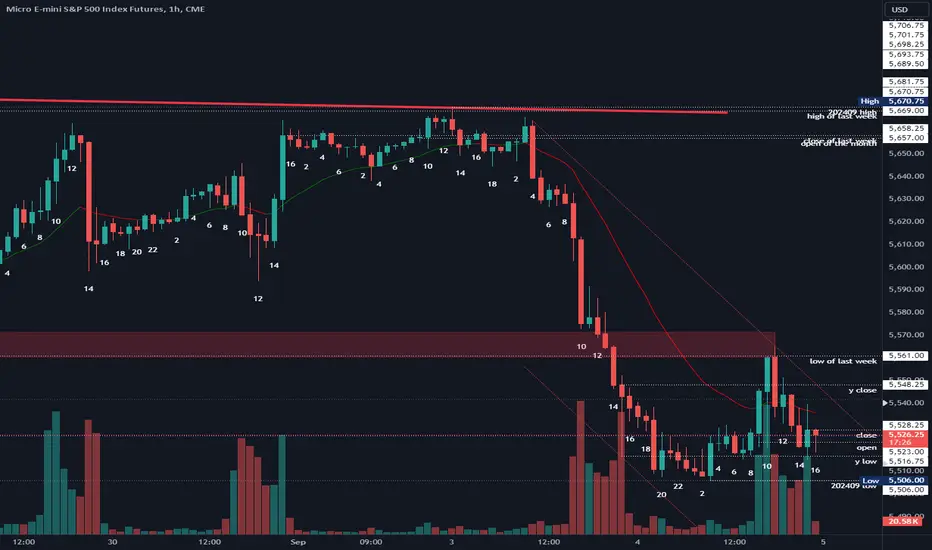
2024-09-04 - priceactiontds - short daily update - sp500Good Evening and I hope you are well.
tl;dr
Indexes - Bearish bias confirmed. Bulls getting nervous by now. More bad data releases and markets are leaving bear gaps unclosed. Today we also made lower lows and the pullbacks were shallow. All good for the bears and the odds of another strong leg down and a measured move got higher today.
sp500 e-mini futures
comment : Many of the same arguments as for dax. Very strong leg down and bears want another one. Measured move target would be 5350-5370. Market closed 5 points above the open, so a big nothingburger but both sides made money today.
current market cycle: trading range
key levels: 5500 -5670
bull case: Bulls made money today if they were quick to take profits but the problem is, that the pullback was not high enough to seriously question the bear case. Bulls need to fight for 5500 or we get the second leg down. Same easy if-this-then-that scenario for most indexes.
Invalidation is below 5490/5500.
bear case: Bears confirmed the leg down with lower lows and a shallow pullback, which they sold again. They closed below the daily ema and also left a bear gap open, though a small one. First target below 5500 is 5420 which is the 50% pullback from the bull rally.
Invalidation is above 5666.
short term: Bearish. Below 5500 I become full bear again but can also see this going a bit more sideways. I do expect this week to close deep red and below 5500.
medium-long term - Update from 2024-09-01: Very much like my outlook in dax. Trading range on the daily chart and we are at the highs. We could make higher ones or not. Does not matter much. I expect 5000 to be hit again in 2024.
current swing trade: Nope and will only do on bigger swing short it will probably be dax.
trade of the day : Very strong open and longs were good. After that it was so two sided and no obvious amazing trade. In hindsight it was an obvious short but not as it was happening imo. Market had strong two sided trading during news releases. After bar 11 close I expected market to close nearer to the open price and scalped some shorts.
SPY/QQQ Plan Your Trade For 9-4 : CRUSH Blends Into Rev-RallyYesterday's price move was clearly a CRUSH pattern I expected on Monday. Because of the holiday trading schedule this week, I believe the CRUSH pattern blended into Tuesday's trading - resulting in today's pattern being a blend of the Rev-Rally pattern on Tuesday and the Up-Down-Up pattern for Wednesday.
Overall, I believe the CRUSH pattern removed a lot of downward price pressure and set the markets up for a bigger upward move starting on September 9-11.
At this point, I believe the US markets will attempt to find a base/support and transition into the end of this week by "looking for support—then rallying away from support."
So, I expect the US markets to find a critical support level today or tomorrow, then begin to form a base and rally away from that support level.
Let's play what is in front of us on the charts and Get Some.
#trading #research #investing #tradingalgos #tradingsignals #cycles #fibonacci #elliotwave #modelingsystems #stocks #bitcoin #btcusd #cryptos #spy #es #nq #gold

Market 101:From the Drama King VIX to the Steady Eddie UtilitiesVolatility Index (VIX) - The Drama King
Let’s kick things off with the Volatility Index, aka the market’s drama king. It’s like that one friend who always makes a big deal out of nothing—spiking dramatically whenever the market so much as sneezes. Recently, it shot up faster than a caffeine-fueled trader on Monday morning, but now it’s calming down a bit, hovering around 20.73. Keep an eye on this guy—he’s always a sign of market anxiety like I said, the the fear gauge. If he starts climbing again, it might be time to batten down the hatches.
Utilities Sector (XLU) - The Steady Eddie
Moving on to the Utilities sector, which is the market’s equivalent of your reliable, always-on-time friend. XLU has been climbing steadily, but just like every other reliable person, it needs a break sometimes. It’s currently chilling around 76.20, looking like it’s taking a well-deserved breather. Nothing too exciting here, but that’s exactly what you want from Utilities—slow and steady wins the race.
ARK Innovation ETF (ARKK) - The Wild Child
Now, let’s talk about ARKK—Cathie Wood’s wild child. This chart is like a rollercoaster at an amusement park: up, down, up, down, and sometimes you’re not sure if you should scream or cheer. After some wild moves, ARKK is sitting around 42.98, but don’t be surprised if it decides to take another loop-de-loop soon. Just remember to strap in and hold on tight.
Technology Sector (XLK) - The Overachiever
Next up, the Technology sector, which has been the market’s overachiever for quite some time. XLK had been climbing like it’s trying to win the market’s gold star, but recently it’s hit a bit of a speed bump, pulling back to 210.28. No worries though—this sector is like that student who’s always doing extra credit. It’ll likely bounce back in no time, probably while giving the rest of the market a lesson in resilience.
Consumer Discretionary Sector (XLY) - The Big Spender
Finally, we’ve got the Consumer Discretionary sector, which is the market’s big spender. XLY has been on a shopping spree, but it looks like it might be hitting the credit limit soon. The chart shows some clear support around 184.61, but if it breaks below this, we might see some belt-tightening ahead. Keep an eye on it—everyone loves a spender until the bill comes due.
Summary: From the dramatic spikes of the VIX to the steady climb of Utilities, each of these charts has its own personality. Whether you’re dealing with the rollercoaster that is ARKK or the disciplined overachiever in Technology, there’s always something to learn from the market’s diverse cast of characters. Stay sharp, keep your sense of humour and energy, and remember: in the markets, as in life, it’s all about balance.

SPY indicating more selling to comeSPY Today pulled back much further than anticipated after the volume price exhaustion on Friday close. We have now broken below key support and into bearish territory
A pullback was expected today due to volume spike on friday close during a rally
Sell off proved to be more severe and broke below key support
Final trading period gave strong hammer candle with high volume
Hammer candle indicates reversal from downward trend
Due to firm break out I expect a bounce up to new resistance line followed by more selling off.
Originally thought we were experiencing pullback in time from SPY with it trading flat. It appears now that it was a longer term distribution phase before selling occurs.

2024-09-03 - priceactiontds - daily update - sp500Good Evening and I hope you are well.
tl;dr
Indexes - Huge bear surprise today. The strength of the selling was absolutely unexpected. Bulls closed August at the very high and had all the arguments to print new ath but as of now, this selling is different and new highs are now very unlikely. Most daily charts printed a huge outside down bar, closing at the lows and below the daily ema. If bears get follow through tomorrow, they have taken control of the market and we might take the elevator down again.
sp500 e-mini futures
Here is the quote from my weekly update:
bear case: Bears see it as a big trading range and we are at the highs again. They start scaling into shorts above 5600. Same observation as last week. Until bears print consecutive daily bear bars or stronger 1h bars below 5650, bulls remain in control. If bears somehow manage to print a bigger engulfing bear bar on the daily chart, especially if it closes below 5600, that would probably be enough to make many more bulls exiting their longs. Interesting week ahead of us.
comment : Market went only down today and did not touch the 15m ema, so it only makes sense to talk about the daily chart. Bears did exactly what they needed to do in order to make more bulls take profits. Now comes the most important part. If they let the bulls have a bigger pullback, this might go above 5650 again but if it stays below 5600 and we print 5490, that would certainly hit the last stops and could accelerate this down hard.
current market cycle: trading range
key levels: 5500 -5670
bull case: Bulls are running for the exits. They want to secure the profits from the insane reversal over the last weeks. I expect many more stops around 5490 and bulls need to prevent the market from getting there. Bulls have the slight hope this was an early sell climax with a bear trap below the daily ema and the expanding triangle. If they can get above 5600 again, their case is valid and we could get back above 5640 again.
Invalidation is below 5490/5500.
bear case: Bears have all arguments on their side, if they keep the pullback shallow and print below 5500 tomorrow. Seasonality is on their side this month and since the market is in a very volatile state, it’s possible to see 5000 this month. The first bigger target for the bears is obviously every round number, so 5500 but I do think 5400-5420 is the real target because that is the 50% pb from the recent bull rally. I will look to see if the 1h ema will hold tomorrow. Max bearishness would be to go sideways between 5500-5560 until bears want the bigger second leg down.
Invalidation is above 5660.
short term: Bearish but I expect a pullback before another leg down. Need to see how strong bulls are tomorrow. First bigger target for the bears is 5400.
medium-long term: Very much like my outlook in dax. Trading range on the daily chart and we are at the highs. We could make higher ones or not. Does not matter much. I expect 5000 to be hit again in 2024.
current swing trade: Nope.
trade of the day: Sell anywhere and hold. Sounds a lot easier than it is but those are the hard facts. If you struggle to do that, you need to come up with strategies to force yourself to swing part of your position and not close until a clear signal appears. Today had no signal to exit shorts.

Is this the Beginning of the Flip? Just KiddingFrom what we can see it appears that we are just at the beginning of a bear move here and that might be quite an aggressive move. pay attention to the $550 level here and if we stay at that or below it, we should a steep curve to the bears in the next few days here.

SPY 545 retestSPY 545.00 floor needs to hold if not we go below 540.00 possibly.
If it does hold I think we bounce hard and see ATH.

Members Daily Analysis Markets get bludgeoned!
Commodities under pressure / Nat gas strong
Yield curve still inverted.
Vix flying!
Long Bonds sniffing out recession

SPY 10-Minute Chart Analysis - September 3, 2024AMEX:SPY The SPY has been trading in a well-defined range over the past few sessions, bouncing between support and resistance levels like a pinball. Right now, we’re seeing a key moment where SPY is testing the lower boundary of its trading range.
Current Setup:
Resistance Zone: The upper boundary around 5,641 has consistently acted as a ceiling for SPY. Every time the price reaches this level, it gets knocked back down, indicating strong selling pressure.
Support Zone: On the other end, the support around 5,560 has held up well, with buyers stepping in to defend this level each time it’s been tested. SPY is currently hovering just above this support zone, which could be a critical area to watch.
What’s Happening Now:
SPY is testing the lower end of the range, around 5,573.91, after a sharp drop from the resistance. The price is attempting to bounce, but the question is whether this support will hold, or if we’re looking at a potential breakdown.
Key Levels to Watch:
Break Above: If SPY can gather enough momentum to push back towards the 5,641 resistance and break through it, we could see a significant move to the upside. This would signal that buyers have regained control.
Break Below: On the flip side, if SPY fails to hold above the 5,560 support, we might see a more extended decline, potentially opening the door to lower levels.
Summary: SPY is at a crucial juncture. The battle between buyers and sellers is heating up as the price hovers near the lower support of the range. Traders should keep a close eye on these levels, as a break in either direction could dictate the next significant move for SPY. Stay alert and be ready to act depending on how the market reacts in the coming sessions.

SPY/QQQ Plan Your Trade For 9-3 : Reversal Rally Today.Today's SPY Cycle Pattern is a Reversal Rally.
After yesterday's CRUSH pattern (on the Labor Day holiday), we should expect the indexes to persist in a moderate rally phase (or melt-up) today.
I believe yesterday's CRUSH pattern played out very nicely on the ES.
Today's Reversal Rally pattern should result in the ES attempt to move back to 5653-5660.
For the SPY, that will be a move back to 563.00 to 563.40.
Overall, I believe today will show a solid attempt to move higher (melting upward) as the price slides into the end of this week very sideways/flat.
Starting on Sept 9-10, we should start to move into a rally phase for the SPY/QQQ.
Sit tight until then. These intra-day swings are perfect for day trading Gunslingers.
Get some.
#trading #research #investing #tradingalgos #tradingsignals #cycles #fibonacci #elliotwave #modelingsystems #stocks #bitcoin #btcusd #cryptos #spy #es #nq #gold

September Effect - Up/Down/Sideways - How I'm Trading ItSummer trading is officially done and the market will be news sensitive leading up to the big bad FOMC Rate Decision on September 18.
August's monthly candle is a wild one with a massive wick to the south and the bulls pushed the SPY within a whisker of all-time highs, Dow to several all-time highs, Nasdaq into a nice bullish recovery posture, and Russell the same (higher lows).
6 Central Bank Rate Decisions in September
US News on Employment and Inflation all rolling out before the FOMC
I'd like to see a seasonal dip or pullback to offer more accumulation opportunities before a run higher. Let's see how it plays out.

Why ORB and VWAP Have a High Success Rate - Part 2Previously in the Opening Range Breakout (ORB) and the Volume Weighted Average Price (VWAP). In Part 1, we dove into the basics and all the important aspects of the ORB, but now let's explore why these strategies often lead to high win rates.
The Psychology Behind ORB
The ORB is powerful because it captures the market's initial reaction to overnight news and pre-market sentiment. Think of it like the opening scene of a movie: it sets the tone for what’s to come. When the market breaks above or below this range, it’s like the plot thickening—traders jump in, driving momentum in that direction. This momentum is often self-reinforcing, leading to sustained moves that traders can capitalize on.
VWAP: The Institutional Trader’s Compass
VWAP, on the other hand, is not just another line on the chart. It's the line in the sand for many institutional traders. It represents the average price weighted by volume, and it’s where big players often aim to execute their trades to ensure they’re getting a fair deal. When the price is above VWAP, it’s a sign of strength; below, it signals weakness. This makes VWAP an anchor point for many strategies, creating natural support and resistance levels.
The Power of Combining ORB and VWAP
Now, let’s bring it all together. When you combine ORB and VWAP, you’re essentially stacking two powerful tools that capture both the early market sentiment and the equilibrium price level that institutional traders care about. For instance, if the price breaks out of the opening range and stays above VWAP, it’s like a green light signalling that the bulls are in control. On the other hand, if the price breaks down and stays below VWAP, the bears likely have the upper hand.
The chart you're seeing is a perfect example of this dynamic. Notice how the price respects the VWAP and reacts strongly around the opening range levels. These reactions are not random—they’re the market’s way of telling us where the big players are positioning themselves.
To Recap All These
The high success rate of ORB and VWAP strategies isn’t just about the numbers; it’s about understanding market psychology and where the big money is flowing. By incorporating these tools into your trading, you’re aligning yourself with the natural rhythm of the market, increasing your chances of being on the winning side of the trade.
This combination gives traders a structured approach to navigate the chaos of the markets, and when used consistently, it can lead to more reliable and profitable trades.
