Happy Labor day SPY Lovers ! (4hr Chart Analysis)This is our 4-hour chart, and as you can see, I am linking it with the daily chart I published earlier.
What I want you to notice is the number of orders positioned at 544.58. We must take into account that on our daily chart, this is the second time the price has activated the institutional order block, and there was no intention of a breakout; it was simply rejected as we predicted last week.
The price on the 4-hour chart has only moved within a range and hasn't been able to surpass all-time highs yet. Looking at the chart, it gives me the impression that it might reject again.
No one knows what will happen; this is an analysis based on historical movements, price action, and smart money concepts.
Let’s see what Tuesday brings, but for now, enjoy your Labor Day!
Cheers, and thank you for supporting my analysis.
Spy!

Hey SPY LOVERS ! Happy Labor Day ! (Daily Chart Analysis) There really isn't much to see here. The entire week we were simply in a broad range. The price activated the institutional order block for the first time and made its natural rejection, as we mentioned in the previous analysis, showing liquidity for several days. However, the price regained strength to return to the institutional order block once again.
There are 2 things I can identify on this chart:
1- The price, volume, and strength to return to the order block.
2- On a 4-hour chart, the price is showing a lot of orders positioned to the downside, which makes me think that the price might not have the strength or volume it's looking for to break the institutional order block and surpass the ALL TIME HIGH.
In conclusion, we have to wait for the market to open tomorrow, as today, being "Labor Day," there was no session
I will publish my 4-hour chart and link it with this one so you can see the number of orders positioned around 544.58.
Let's see how it goes when the market opens on Tuesday.

The economy peaked in April 2023"JOBS, JOBS, JOBS!"
As Obama said during the recovery period post GFC
This chart shows the employment level --- how many people are employed in the States / divided by the unemployment level --- the number of people without a job. .
A simple Ratio
With all the official Recessions highlighted in the red box.
The dates of the recessions are from Wikipedia.
JOBS are the ECONOMY
Goods and services are still made by people. (That is obviously under attack by robotics and AI) --- but will likely lead to new economies being birthed and new jobs created.
THE #FED is late to cut
and will likely cut too slowly
guaranteeing a GDP contraction therefore further job losses.
HOLDING RISK ASSETS
IS RISKY
needless to say.

#202436 - priceactiontds - weekly update - sp500 e-miniGood Evening and I hope you are well.
tl;dr
sp500: Current bullish leg looks more like a leg in a trading range than something of a new bull trend that breaks above the previous ath. It’s 50/50 if bulls can print a new ath or this stays a lower high. It’s too high to buy for anything but intraday and too early to short unless you short small and have a stop above 5800. It’s a bullish structure but you would be buying very high in a potential trading range. Bad R:R.
Quote from last week:
comment: Not much difference to dax, just that this market was a tat stronger even. Bulls almost reversed completely but 7 consecutive bull bars is as climactic as it gets. A pullback is due but that does not mean you can short it at 5578. Could go further since the obvious pain trade is up.
comment : Are we that much smarter than last Sunday after past week’s price action? I don’t think so. Still a lower high. Bulls closed the month extremely bullish but we are at previous resistance. Can’t be anything but neutral. Clear invalidation prices though. Above 5670 it’s bullish for ath retest 5721 or higher high. Below 5550 bears can generate momentum and convince bulls this was just a climactic retest of the highs and we go down again. Bulls still do have better arguments than the bears as long as they stay above the daily ema at 5565.
current market cycle: Bull trend inside bigger trading range.
key levels: 5000-5700
bull case: Bulls need to break above 5670 if they want a new ath and it look’s very good after Friday. If they fail on Monday, I have my doubts that they can get it. Bulls are still clearly in control of the market or we would have been trading below the daily ema already. Will be interesting to see how many bears come around above 5700 and bulls taking profit, if we get there.
Invalidation is below 5550.
bear case: Bears see it as a big trading range and we are at the highs again. They start scaling into shorts above 5600. Same observation as last week. Until bears print consecutive daily bear bars or stronger 1h bars below 5650, bulls remain in control. If bears somehow manage to print a bigger engulfing bear bar on the daily chart, especially if it closes below 5600, that would probably be enough to make many more bulls exiting their longs. Interesting week ahead of us.
Invalidation is above 5670.
outlook last week:
short term: Neutral af. Want to see a pullback and also how market reacts to 5600.
→ Last Sunday we traded 5652 and now we are at 5661. 9 points off. I do think that was a perfect outlook.
short term: Neutral again. No interest in bigger buying above 5600. Will scalp long if bulls make it clear that they want a new ath but mostly looking for signs of bear strength over the next week. Bulls closed above 5660 so it’s a buy signal going into next week but my outlook has not changed. I wait for bears to come around and will only scalp longs.
medium-long term: Very much like my outlook in dax. Trading range on the daily chart and we are at the highs. We could make higher ones or not. Does not matter much. I expect 5000 to be hit again in 2024.
current swing trade: None.
chart update: Big ABC correction is pure speculation. Don’t bet on it. I do think the climactic bull rally is over and market is going sideways before the next bigger breakout. Only above 5750 can bulls dream about a breakout above the big bull wedge.

SPY: Weak Market & Bearish Forecast
It is essential that we apply multitimeframe technical analysis and there is no better example of why that is the case than the current SPY chart which, if analyzed properly, clearly points in the downward direction.
❤️ Please, support our work with like & comment! ❤️

SPY shows signs of breakthough to the upsideSPY recent day of trading gave an overall picture that this flat trading is coming to close with a potential rally coming.
Gapped up for second time in the 2 days
Sold off slowly with low volume
The rally in late day spurred by smart money with increasing volume
Stock breaks through upper resistance for first time
SPY is showing a strong bullish signal indicating a longer term rally to come

SPY The Target Is DOWN! SELL!
My dear subscribers,
My technical analysis for SPY is below:
The price is coiling around a solid key level - 563.59
Bias - Bearish
Technical Indicators: Pivot Points Low anticipates a potential price reversal.
Super trend shows a clear sell, giving a perfect indicators' convergence.
Goal - 561.46
About Used Indicators:
By the very nature of the supertrend indicator, it offers firm support and resistance levels for traders to enter and exit trades. Additionally, it also provides signals for setting stop losses
———————————
WISH YOU ALL LUCK

SPX dollar adjustedSPX is entering into a distribution phase before a leg down. Moves between a 25% range could happen in the distribution phase and could last a long time. The move down afterwards could be very high.

Journal 8.30.24 - $KO - 200% Profit & $WMT 37% Profit in One DayThis is just a quick journal entry talking about the red, green, green setup. You want the weekly to for sure be "in force" and on the day have a red (pullback candle-high < high of candle before it), green candle, then next daily candle green. This is a nice day trade combo.

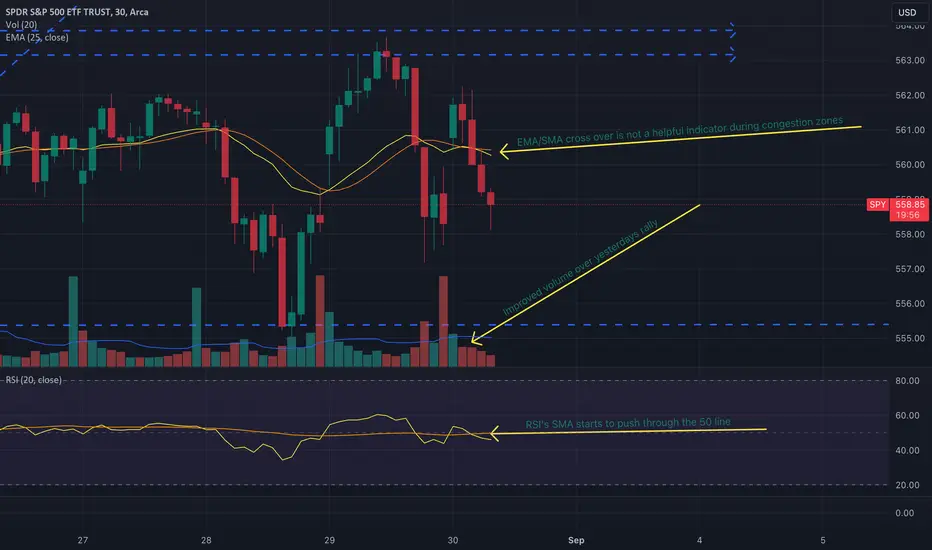
SPY shows more interest in rallying than beforeSPY is starting to show more signs that a breakout above the flat trading its in is coming
We see increased volume over peaks of previous rallies indicating agreement with pushing up prices
RSI's SMA starts to break through the 50 line
comparing to the QQQ, its experiences another false breakout above for the second day in a row. Showing the tech sector is attempting to turn around to the upside
SPY continues to still trade flat but show more confidence in its small rallies than previously
Opening (IRA): SPY August 30th 486 Covered Call... for a 481.76 debit.
Comments: Re-upping in SPY in slightly longer duration, but with the short call at about the same delta as the one I took off, resulting in a lower buying power effect and break even with the primary goal being to milk a little more out of August before moving onto Sept.
Again, un-sexy metrics as a standalone trade:
Buying Power Effect/Break Even: 481.76
Max Profit: 4.24
ROC at Max: .880%
50% Max: 2.12
ROC at 50% Max: .440%

US Markets Cleared For A 13% to 24% Rally - Get SomeThis video highlights why I believe the US markets are ready to make a big move higher over the next 12 to 24+ months.
Many people suggest the markets will crack or crash, or we will experience some black/grey swan event. I'm afraid I have to disagree with this belief.
Yes, there is always a chance we will see some market event. However, to disrupt the US/global economy, there would have to be some event that disrupts the world, not just one or two smaller countries.
I do believe the US is making a broad transition into the 21st century, and new leadership (Govt) is required to make that happen.
But I also believe the seeds have been planted for exponential growth over the next 10-20+ years - and many traders are too focused on the crash dummies to see the real potential.
Watch this video. Share your comments if you like.
I believe we will see pullbacks and rotations on the way up - but I don't think we'll see any big crash event until after 2031 (or later).
Get some. This is going to be BIG.
#trading #research #investing #tradingalgos #tradingsignals #cycles #fibonacci #elliotwave #modelingsystems #stocks #bitcoin #btcusd #cryptos #spy #es #nq #gold

Yield Curve De-Inverting: A Bearish September IndicatorFlying under the radar for much of this month is the spread between the yield on the US 2-year Treasury note and the 10-year note. The gap is now just five basis points, having traded at negative 0.5ppt as recently as June 25. As we enter September, notoriously the worst month on the calendar for the S&P 500, if we see short rates continue to fall while the 10-year holds steady, I assert that it would be a bearish indicator for the S&P 500.
Here’s how it might play out: if we see a weak payroll report on Friday, September 6, then chances are bad news will be seen as bad news, resulting in a flight to safety in the Treasury market. Of course, intermediate-term notes could see significant upside pressure, leading to a drop in the 10-year. The next key report following the August NFP update is the CPI report later in September. After today’s in-line PCE numbers, there should be a firm beat on where inflation stands.
Now that earnings season is over, the focus will turn back to the macro. Considering that the Citigroup Economic Surprise Index remains sharply in the red, we need to see better economic data to help support the growth narrative looking ahead. Sure, the Q2 second update on US real GDP growth was solid, and the Q3 tracking numbers are sanguine, but the market will be forward-looking.
So, keep your eye on the 2s10s spread—a yield curve disinversion during this spooky seasonal stretch could bring about volatility.

SPY/QQQ Plan Your Trade For 8-30 : Carryover In Counter TrendToday's SPY Cycle Pattern suggests the SPY will attempt to trend moderately strongly to the upside (if my research is correct).
The counter-trend mode of the carryover pattern suggests the price trend will be opposite of the last 2-3 bars - so a potential upward price trend today.
The carryover pattern suggests that price will behave very similarly to what we've seen over the past 2-3 days—moderately trending.
So, I expect the SPY to attempt to rally the 563-564 level and hold above recent lows.
The QQQ should be similar—attempting to break away from the downward price channel, then consolidating into early/mid-next week before attempting to move higher again.
Gold is within my breakout range (over the next 2~5 days), and I believe the 2564 level needs to be broken (upward) for the 2593 level to become the next target. We are still seeing active support near 2511.
Bitcoin should move back to the upside, trying to target the $62.8k level over the next 5+ days. The Flag formation in BTCUSD is holding up well.
Happy Friday everyone.
Let's make today a great day and prepare for next week.
Get some.
#trading #research #investing #tradingalgos #tradingsignals #cycles #fibonacci #elliotwave #modelingsystems #stocks #bitcoin #btcusd #cryptos #spy #es #nq #gold

Fed’s Preferred Inflation Indicator TomorrowTomorrow’s macroeconomic calendar is set for a major event! 📊
At 8:30 AM Eastern Time, we’ll see the release of the Fed’s preferred inflation indicator: the Personal Consumption Expenditures (PCE) price index. The implied move for PCE is +/- 35 points, with the estimated month-over-month core PCE at 0.2%. 📈
Stay tuned for market reactions and how it could impact the broader indices!
SP:SPX AMEX:SPY NASDAQ:QQQ #Finance #Investing #MarketWatch #EconomicData #Inflation #PCE #Fed #StockMarket #FinancialNews

SPY holds steady while QQQ sells offDuring the past week, SPY and QQQ have diverged in their paths
QQQ slowly and steadily sold off
SPY traded flat during that time
This indicates that the sell off in QQQ was primarily tech driven and did not spread to the rest of the industries
other industries look to be holding stable

Bulls and Bears zone for 08-29-2024S&P is trying to rally during ETH session.
Any test of yesterday's High could provide direction for the day.
Level to watch: 5626 ---5624
Reports to watch:
Pending Home Sales Index 10 AM ET
EIA Natural Gas Report 10:30 AM ET

SPY/QQQ Plan Your Trade For 8-29 - Breakaway in Carryover ModeToday's pattern should play out as a reversion to yesterday's selling pressure.
I did not expect to see the markets sell downward as hard as they did yesterday, but my systems were able to catch the downward trend well.
As a trader and a researcher, I try to base my expectations on what I believe to be the highest probable outcome. Yet, sometimes I'm wrong.
I've mentioned this before, and I'll probably say it again and again...
Traders must be capable of adapting to the charts. Play what is in front of you. My SPY Cycle Patterns offer assistance in what may happen based on Fibonacci/Gann price characteristics. Yet, news items (or positioning ahead of NVDA earnings) can drive market trends in unique directions.
We must understand that big news events/earnings/data can alter price trends away from the SPY Cycle Pattern triggers, and we have to be able to play the chart in front of us.
So we adapt to what the chart is telling us - always.
Remember, Fibonacci Price Theory was very clear yesterday after the first breakdown in price - this trend is BEARISH.
Watch this video. Gold is getting ready to make a move up to 2593+ and Silver wants to follow up to about $31. But Silver will lag Gold a bit - so position yourself correctly.
Bitcoin will stay range-bound over the next 5-7+ trading days - trying to run out time on the Flag Apex. Then, it should make a bigger move to the upside.
Get some.
#trading #research #investing #tradingalgos #tradingsignals #cycles #fibonacci #elliotwave #modelingsystems #stocks #bitcoin #btcusd #cryptos #spy #es #nq #gold

SPY 2-Hour Chart Analysis - August 28, 2024Double Trouble is the name of the game here, and it’s no joke. As you can see SPY just dipped below a critical support level, and things could get tricky if buyers don’t step in soon.
What’s Happening?
SPY has been bouncing around within a tight range for the past few days, but today’s action saw it break below the 554.93 support level (highlighted by the yellow dashed line). This level has been key in holding the price up, and now that it’s breached, we could be in for a rough ride.
Why Double Trouble?
Here I am referring to the fact that SPY is now stuck between two crucial zones: the broken support around 554.93 and the next significant support level down near 551.00. If the price falls to this lower support, we could see even more downward pressure, potentially leading to a deeper sell-off.
Key Levels to Watch:
Resistance: Look for potential resistance to form around the 554.93 level now that it’s broken. If SPY can reclaim this level, it might signal a reversal, but if not, the bears could stay in control.
Support: The next big support is down near 551.00. If SPY continues to fall, this is the level that needs to hold to prevent further losses.
What’s Next?
We’re at a pivotal point. A break back above 554.93 could give bulls a lifeline, but if SPY continues to slide, the 551.00 level will be the last line of support before more significant downside risk comes into play.
Stay cautious and keep an eye on these critical levels as we head into the next trading sessions. I am starting to believe that market is in a delicate position, and how it reacts here will set the tone for the days to come.

Yield curve Before Hyperinflation (QE US BONDS) BTC & SPY
The global bond market is what dictates the liquidity to stocks, its what dictates the world its what starts wars and its what ends wars.
Currently I see many post focused on "recession" "market crash" when the giant elephant in the room is the global bond market and the US reserve dollar that is currently in danger.
Why must we start foreign sanctions and battles with a country beginning with R? its very simple. There's a fight for the dollars survival. Covid 19 pushed the FRED past the point of no return and there is no going back to the structured system that was already falling apart.
Treasury Interest is now getting at dangerous levels of unpayable amounts, Government Debt is rising by the trillions in a parabolic move that is getting steeper by the month.
What has to happen?
The FRED will force the US power to globally cut rates in all major economies while the FRED also has to start cutting back to zero while halting the fall of the DXY
(forcing military action on other countries who do not cut rates and hinder their local currency)
The last time in history something like this has happened was during the 1927-1931 period of discount rate blunders.
US CPI is indicating we have entered a new stage of no turning back and this is the danger of printing money, QE will be forced in the nature of Yield Curve Control and the excess liquidity and currency will debase the markets violently in an upward notion, following this people will end up panicking being on the sidelines entering the market with heavy leverage and borrowed funds at lower rates.
This is a type of scenario that would collapse Rome, Would end the Soviet Union. Expect dangerous policies, socialist developments, anti ownership, sparks of new wars.
Only when you price this event in something like Bitcoin you can then re evaluate how much money will have to be printed to keep up this momentum without causing a depression with unemployment rates sky rocking and the Government defaulting on the debt.

Bitcoin entry aug 27 2024Bitcoin is now giving an entry. You can it with a proper RR & position sizing at current price. This is your long setup for bitcoin

2024-08-27 - priceactiontds - daily update - sp500Good Evening and I hope you are well.
tl;dr
Indexes - Yeah I spare you your time. Markets have no idea where to go right now but I think Nvidia earnings can move it for good. Absolutely no opinion on those earnings and how market will react. I don’t like to gamble on such things.
sp500 e-mini futures
comment: I won’t conjure much words today for a market inside a 50 point triangle. Clear support and resistance visible. Either scalp it to both sides or wait for the breakout. No opinion on which side the breakout will happen. Both sides have arguments and I won’t try to guess it.
current market cycle: trading range
key levels: 5600 - 5670
bull case: Bulls want to get above 5670 and to make the bears give up so they can print a new ath or at least 5700 again. I do think many bulls will give up below 5550 but that’s far away for now. Currently no more magic to it.
Invalidation is below 5580.
bear case: Bears coming through with selling spikes rather than consecutive bear bars or sustained selling. I think many stops will be around 5675-5680 and market would probably print 5700 fast then. If Nvidia misses and market pukes, below 5580 I will heavily favor the bears to reverse the madness.
Invalidation is above 5675.
short term: Neutral as it gets.
medium-long term: Bearish. I gave the 5000 target 3 months ago and we almost got there way earlier than expected. There is a reasonable chance we will see an event unfolding over the next days/weeks. Something breaks during these violent moves and this time will not be different.
current swing trade: Nope.
trade of the day: Buying the bear trap at the open anywhere below 5619. Second best was any long around 5628 since market is trying hard to show you this is support for now. Selling 5649 was also decent. Trading range with clear support and resistance. Buy low, sell high and scalp.

SPY/QQQ Plan Your Trade 8-27 Update : Possible Long Squeeze EODToday's SPY Cycle Pattern should reflect a decidedly bearish overtone to price action. The fact that we opened with a GAP downward and have waffled around just above yesterday's closing price does not really excite me.
I see price failing and waffling around in "no man's land".
This video covers the SPY, Bitcoin, & Gold.
Stay agile. I see the markets rolling downward into the end of the day today - but I could be wrong.
Get some.
#trading #research #investing #tradingalgos #tradingsignals #cycles #fibonacci #elliotwave #modelingsystems #stocks #bitcoin #btcusd #cryptos #spy #es #nq #gold
