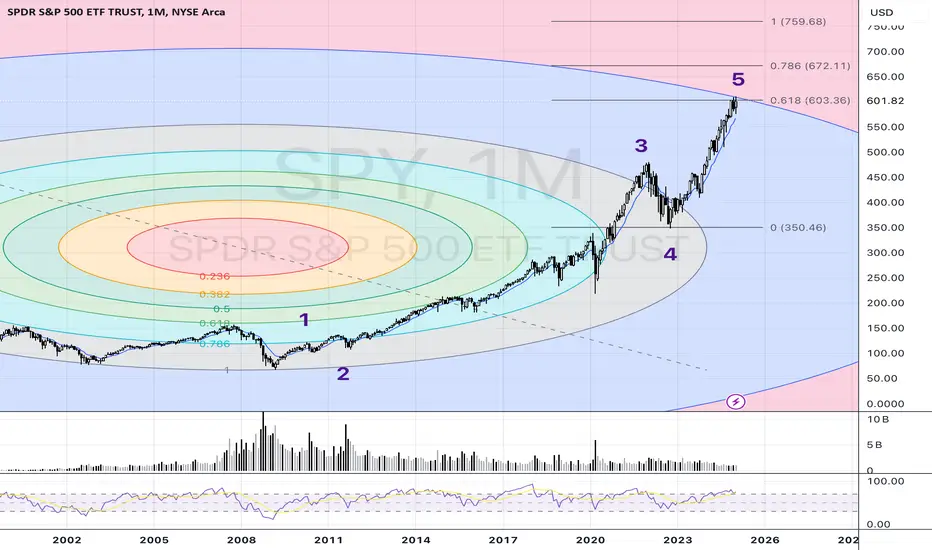
SPY | The End of a 16-Year Bull Cycle? Major Correction Ahead?🔎 Overview:
The S&P 500 ETF (SPY) has been in a massive bull run since the 2009 bottom, forming a clear 5-wave structure based on Elliott Wave Theory. Now, the market is showing multiple top signals, suggesting that a major correction may be imminent.
📉 Key Warning Signs:
1️⃣ 5-Wave Completion:
The 5th wave is approaching a key Fibonacci extension level (0.618 of Waves 1-3), a common reversal zone for extended moves.
The previous wave count has been respected perfectly, reinforcing this structure.
2️⃣ Fibonacci Circles Alignment:
Price is reaching the outermost Fibonacci arc, a historically significant zone where reversals have occurred.
The market has reacted strongly in previous arcs, indicating this could be another turning point.
3️⃣ RSI Bearish Divergence:
The Relative Strength Index (RSI) is making lower highs while price is making higher highs—a classic bearish divergence signal.
Previous similar divergences led to major corrections, including 2000, 2008, and 2021 dips.
4️⃣ Overextended Market Conditions:
Volume is declining despite new highs, signaling weak buying pressure.
Sentiment is euphoric, typically a late-stage bull market characteristic.
📊 Possible Scenarios:
🟢 Bullish Case: If SPY breaks and sustains above the 0.786 Fibonacci level (~672), we could see an extension.
🔴 Bearish Case: A break below 600 and a weekly close under 575 would confirm the start of a major correction back to the 350-400 zone (previous wave 4 region).
🚨 Final Thoughts:
The technical evidence suggests that SPY is in a late-stage bull cycle, and the risk of a major pullback is high. While timing exact tops is difficult, long-term investors should be cautious, and traders may want to start looking at hedging strategies or taking partial profits.
📢 What’s your take? Are we near a major top, or is there more upside left? Drop your thoughts in the comments! 👇
#SPY #SP500 #StockMarket #ElliottWave #Fibonacci #RSI #BearishDivergence #Trading #Investing 🚀📉
Spy!
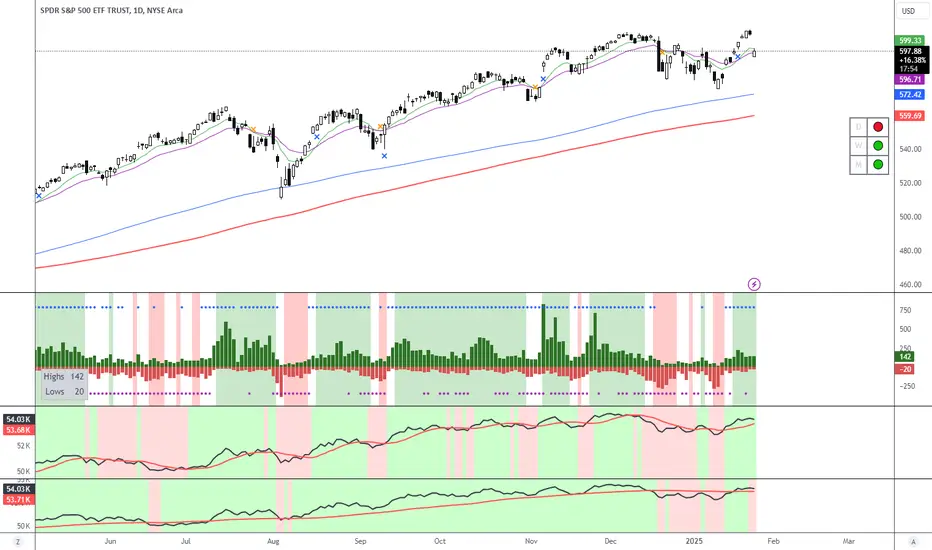
2/03/2025 Weekly Analysis + WatchlistSPY - Failed 2U week after going outside month the week before. Not super shocking, but now we sit in an interesting spot. The new month will open inside bar and has to either take out previous month highs (Which is ATH) or Jan Lows. Seeing that the range is pretty wide for downside, It will take less effort to make new ATH. Not that it means a whole lot, but that is something to note. Next, we see the week closed failed 2D, but is pretty much slapped right in the middle of last weeks range, so it will take an equal amount of effort to make a HH or LL. Finally, from a daily perspective we have a large failed 2U with slight PMG to the downside. We are definitely primed for a sharp corrective move Monday, but of course anything can happen, we are just much closer to seeing the bear scenario than bull. In my mind, the ideal weekly scenario is this: Monday sees sharp corrective move, taking out the PMG guys, then the rest of the week climbs, triggering the weekly 2-2 Rev, which then ideally sends us into ATH once more before seeing either BF expansion on the Month (since we would go 3-2U.), or seeing us start to come back through last months range for a larger corrective move. In the pure bear scenario, we trigger the daily reversal, head down to weekly 2-2 cont. trigger, then see if we can make progress down back through a few daily gaps, ultimately targeting prev month low for the 3-2D M. Given that we are going into a new monthly open after going 3, we could very easily just chop and go nowhere for the week seeing as we may just remain inside week with the month being inside to start out before possibly seeing control more clearly dictated in the 2nd/3rd week of Feb. Main advice regardless is to trade things that are moving early on like gappers, and anything where the month goes 2U or 2D in the first week. Avoid inside bars if possible and trade light!
Main setups for the week:
Bull:
GE - Inside D and W
ORCL - Hammer W to head back through D gap. Cautious with this one
MRVL - Weekly 2-2U. Daily gap fill to the upside after giant gap down to exhaustion risk
Bear:
BA - Shooter 3-2D weekly. Bear Revstrat daily. Daily BF looks solid.
MSFT - MoMo Shooter M, 3-2D W, Daily 2-1-2D. Check daily BF. Still has magnitude after massive ER drop
VZ - Weekly 2-2D, Daily shooter 2-1-2D, FTFC Red. Check daily BF
Neutral:
RKLB - Inside week. Nuclear Green FTFC and super crazy ATR lately

Nightly $SPX / $SPY Scenarios for 2.3.2025🔮
📅 Mon, Feb 3
⏰ 10:00 AM ET
📊 ISM Manufacturing PMI
Previous: 49.3
Forecast: 49.2
💡 Market Scenarios:
📈 GAP ABOVE HPZ:A further gap up would lead to it holding for a little, then chopping near the EEZ.
📊 OPEN WITHIN EEZ:Breakout to the EEZ, make a higher push, and round out the top.
📉 GAP BELOW HCZ:Due to the ongoing momentum, we will get a slight recovery but still drop and chop back down into the lower range.
#trading #stock #stockmarket #today #daytrading #charting #trendtao

SPY POTENTIAL SHORT|
✅SPY price went up sharply
But a strong resistance level was hit at 610.73$
Thus, as a pullback is already happening
And a move down towards the target shall follow at 596.00$
SHORT🔥
✅Like and subscribe to never miss a new idea!✅

Weekly Plan $ES and $NQ FuturesHey traders!
Welcome to this week's market outlook for NYSE:ES and $NQ. In this video, I’ll break down key levels, trends, and setups to watch, helping you stay ahead of the moves. We’ll cover key zones, potential trade scenarios, and what to expect based on volume and price action.
Let’s dive in! 🚀

-10% CRASH Bears coming, Bulls, BTD for a Blow off Top $SPYDecline Ahead, we have the exact same chart on the monthly. I guess that means we could have just one month at least of red. This is a weekly chart with the same pattern as the monthly on SPX. I will post it shortly. We have a 9 Count Sell Signal with a 13 Count Follow up. The 14th Candle takes a 10% dip. On several occasions in this candle combo. I will attach a link to another example.

-10 Decline in the next month, Buy the dip for a Blow off top Refer to a Previous Post. Blow OFF TOP COMING. BUT NOT BEFORE A COUPLE OF SCARES. Short the RIP. BUY THE DIP. Patience. 4-6 weeks of 10% moves back and forth... Accumulate the wins for the Longs... Hold for a year... Short everything Mid 26' if it gets that far MCFLY

SPY Move Down Ahead! Sell!
Hello,Traders!
SPY is trading in an uptrend
So we are bullish biased
Long-term, however the index
Has hit a horizontal resistance
Level of 610.93$ and we are
Already seeing a local bearish
Pullback from the level
So we will be expecting
A further local move down
Sell!
Comment and subscribe to help us grow!
Check out other forecasts below too!

Stock Market Forecast | TSLA NVDA AAPL AMZN META MSFT GOOGLStock Market Forecast | QQQ SPY
Mag 7 Forecast | TSLA NVDA AAPL AMZN META MSFT GOOGL

Plan Your Trade : Behind The Scenes - Learning PerspectiveI created this video to help answer a question from a follower.
One of the biggest concerns for traders is how to use my research/info in a way that benefits them.
My Plan Your Trade videos are based on Daily & Weekly price patterns/cycles. I won't delve into the Intraday research much because it is almost impossible to predict 2 to 10-minute price bars/action throughout the day when new hits and external price data may dramatically change how price moves throughout the day. I would have to continue making videos every 30 to 45 minutes to help you understand the dynamics of intraday price action.
Either way, watch this video to learn a bit more about my research and why I'm trying to help traders learn to make better decisions.
I'm really not here to tell you what to trade - or when to trade. I'm here to help you learn to make better trading decisions ON YOUR OWN.
I try to help you learn to become a more knowledgeable and skilled trader by sharing some of my advanced research and demonstrating patterns, setups, price levels, and Cycle Patterns.
The only thing I can do to help you become a better trader is to help you learn better skills and techniques. If you treat trading like gambling, you'll go broke (often). If you understand trading as a process of grabbing profits when efficient and limiting risks, you'll survive and grow your account over time.
It's really that simple.
Get some.
#trading #research #investing #tradingalgos #tradingsignals #cycles #fibonacci #elliotwave #modelingsystems #stocks #bitcoin #btcusd #cryptos #spy #es #nq #gold

VIX indicates trouble aheadDisclaimer: This idea is not intended as investment advice and should not be interpreted as an offer to sell or a recommendation to purchase any asset. Any decisions made based on the information presented in this idea are the sole responsibility of the individual. All investment decisions should be made independently, taking into account your financial situation and objectives.

SPY/QQQ Plan Your Trade For Jan 31 : GAP PotentialAs we move into the end of January 2025, I'm still watching for technical failure near these higher levels. On Monday, we saw a huge breakdown in the markets just days after my Jan 21-23 Top prediction. Now, as we are moving into the Feb 9-11 DeepV base/bottom pattern - I've been expecting the markets to move into a downward trending phase - which has not happened yet.
The way I see the markets right now and how I would offer a general interpretation of the trend is "struggling to find/set a new trend".
In other words, the markets are really congested in a wide range. I believe the markets will attempt to move downward after today's opening GAP higher.
I believe the markets are going to continue to struggle to find support and trade in a downward-sloping consolidated price range until Q3/Q4:2025.
I believe the markets are reacting to earnings and continued support right now, but that will ultimately resolve as a breakdown phase over the next 60+ days - leading to the multiple BASE/BOTTOM patterns my cycle research suggests will happen.
So, I continue to explain what I see in the context of the broader cycle phases.
Gold and Silver may rally a bit today - but we have a CRUSH pattern on Monday - so try not to carry any positions over the weekend.
BTCUSD is struggling to move away from very strong consolidation. It is also setting up multiple Excess Phase Peak patterns. I believe we need to be patient as BTCUSD struggles to find a new trend. Right now, I see more downside potential than upside potential.
I would offer one warning about today. Today's opening GAP will likely prompt a breakdown in price (moving downward) as we head into next week.
I believe next week will be very volatile. Buckle up.
Get Some.
#trading #research #investing #tradingalgos #tradingsignals #cycles #fibonacci #elliotwave #modelingsystems #stocks #bitcoin #btcusd #cryptos #spy #es #nq #gold

Nightly $SPX / $SPY Scenarios for 1.31.2025🔮
📅 Fri Jan 31
⏰ 8:30am
📊 Core PCE Price Index m/m: 0.2% (prev: 0.1%)
📊 Employment Cost Index q/q: 0.9% (prev: 0.8%)
💡 Market Scenarios:
📈 GAP ABOVE HPZ:
A further gap up would lead to it holding a little, then chopping down into EEZ. Watch for resistance in the Hedge Pressure Zone before any reversal.
📊 OPEN WITHIN EEZ:
Slight move higher from earnings, then drop lower into 6055. Expect some chop and potential liquidity sweeps before continuation.
📉 GAP BELOW HCZ:
Consolidate lower into the Hedge Cushion Zone, then pump back higher. A strong bounce is likely if price interacts with the Weekly Hedge Cushion and liquidity builds up.
#trading #stock #stockmarket #today #daytrading #charting #trendtao

SPY/QQQ Plan Your Trade for 1-30 : Top PatternToday's Top pattern suggests the markets will attempt a minor rally in early trading, possibly targeting the 605 resistance level, then shift/rollover into a downward price trend (the TOP pattern) and being to move downward into the pre-DeepV low levels I've suggests (possibly near 585-588).
At that point, I suspect we'll get a few days of consolidation before we see the DeepV breakdown take place near Feb 11-13 (which may actually start on Friday the previous week).
Overall, I'm expecting the markets to roll into downward trending over the next 7 to 10+ days.
Gold and Silver are moving higher - which is great to see (finally). Maybe all Gold needed was to roll to the newer contract to finally break above the $2820 level. lol
Who knows.
This is the start of the BIG RALLY (Expansion Phase) in metals that should last almost all year. If my research is correct, Gold and Silver will reach a peak level near July-October 2025.
Bitcoin has moved into an inverted Excess Phase Peak pattern that may prompt a rally up to resistance near $108,450.
At this point, the inverted EPP pattern is in the consolidation phase and I'm watching for it to break above $105,500 (moving to the ultimate high), or below $100,270 (as an invalidation breakdown move).
The next 5+ trading days should be very interesting for everyone.
Get some.
#trading #research #investing #tradingalgos #tradingsignals #cycles #fibonacci #elliotwave #modelingsystems #stocks #bitcoin #btcusd #cryptos #spy #es #nq #gold

Nightly $SPX / $SPY Scenarios for 1.30.2025🔮 Nightly SP:SPX / AMEX:SPY Scenarios for 1.30.2025
📅 Thu Jan 30
⏰ 8:30am
📊 Advance GDP q/q: 2.7% (prev: 3.1%)
📊 Unemployment Claims: 221K (prev: 223K)
🌎Global Events:
🇪🇺 European Central Bank Meeting: The ECB is expected to announce its monetary policy decision, with markets anticipating a rate cut.
🇩🇪 Germany GDP Release: Germany will publish its GDP figures, providing insights into the health of Europe's largest economy.
💹 Market Insights:
📈 GAP ABOVE HPZ:
A further gap up would lead to it holding for a little, then chopping near the EEZ.
📊 OPEN WITHIN EEZ:
Markets might overreact, but this meeting was void of new information. All things markets knew beforehand.
📉 GAP BELOW HCZ:
We will likely bounce hard from these lower levels and hold higher.
#trading #stock #stockmarket #today #daytrading #charting #trendtao

2025 S&P500 Forecast Guess by Tim WestI included 2024's guess that I posted here in January last year which turned out to be quite accurate in terms of "action" and "direction". The volatility the market saw with wild swings back and forth was outlined on here as we reached the clusters of guesses from Wall Street estimates.
This is an old technique that I learned from Ken Fisher of Fisher Investments and from Forbes Magazine. His wise and witty insights were the foundation of my investment strategy when I started investing in the mid 1980's.
Basically, when you see what the "market expectations" are for a market like the FOREXCOM:SPX500 or S&P500 Index, you can then figure out what needs to happen to get the market to their estimates and realize the market will go to somewhere else other than their guesses.
With 2024 showing a majority of "less than historical average" forecasts and more downside forecasts, it was quite clear that the market could easily outpace or outperform those forecasts.
Now that 2025 shows that analysts are looking for an average year or more, I think it is safe to say that we won't get an average year.
We now have a rising US dollar, which hurts overseas earnings. We also have higher energy prices which also hurts earnings. And yet we have plenty of cash on the sidelines as everyone who missed the rally is hoping to buy on a decline and others are just happy to earn 5% on their cash balances thanks to an ultra-tight Fed (compared to the last 20 years).
So, I expect more of the same that we have seen in January and I also expect sharp declines if we get any moves above the highs and up towards 6500 on the SPX.

SPY/QQQ Plan Your Trade For 1-29 : GAP ReversalToday's pattern suggests the markets are going to start off with a bit of a bang.
Although I expect the markets to try to hold up with some support, I believe, ultimately, the markets will break downward - continuing into the Deep-V Feb 9-10 bottom my cycles are projecting.
Gold and Silver are acting to attempt to hedge the global risks and could explode much higher over the next 30 - 60+ days.
Bitcoin looks like it will continue to move downward, first to 98k, then to 92k.
I'm seeing lots of Excess Phase Peak patterns in price action. This suggests the markets are struggling for direction right now and could move aggressively into a downward cycle phase before the Feb 9-10 Deep-V base/bottom.
Either way, we are going to find a lot of opportunities over the next 30+ days as traders.
Get some.
#trading #research #investing #tradingalgos #tradingsignals #cycles #fibonacci #elliotwave #modelingsystems #stocks #bitcoin #btcusd #cryptos #spy #es #nq #gold

OEX 100 hourly Forecast 3273I am posting this chart for a guide as to where if we still need to go to complete the advance ! best of trades the Wavetimer

OEX 100 FINAL LEG TARGET 3273 March 13th week The chart posted is the blue chips SP 100 OEX .It is my View that All markets are that of fractals patterns the have a clear movement of math in a repeating Sequence . March 13th week if I am correct and we are into an OEX HIGH near 3273 we would be hitting the long term channel as well as my 1.4 to 3.4 % Breach of the monthly Bollinger band signal as well . I would then generate My Signal for the Major Top to End the bull move from march 9 2009 . I have posted the forecast for 2025 calling for a min drop of 20 % plus as I did in the bed8th forecast 2021 calling for a decline of mIn 20 plus . Well spirals as well as the Math and Bullish Sentiment models call a last wave up in what should be a blowoff ?? in a narrow but it is a new Paradigm !! The MIN decline in this signal has been 21.9 The avg has been 38% and the longest has been over 50 % . If we see a sharp drop over the next 3 td and we drop to 618 target 2886 plus or minus 4 I will move to a 120% long in the money Calls in SPY and QQQ . Best of Trades WAVETIMER After this top I will turn as Bearish as I did January 10th 2020 and dec 2021

SBUX LONG 28TH JAN 2025 READ NOTESSBUX is looking good here at current price with a clear price action.
I will go long here. When ever I am trading at current price then we need to understand that it would be a riskier trade comparing it to a regular trade. It can come back to $92 if it does not go up from here
Do not blindly follow anyone without understanding the risk involved.
NOTE:RISK MANAGED & I WILL GO LONG

$SPY Options | Trump Week TwoAMEX:SPY
Fear and panic has spread in the market, but buyers ate it up by end of day (1/27). There is a gap from December 18th up to $603-$606. $603.44 is the key pivot for bulls and $591.54 for the bears.
For our weekly options trades, we use 15 or 30 minute candle closes for confirmation and stop-loss.
$603 CALL 2/11
Entry: Breakout/Hold Over $599.92
Targets🎯: $603.44, $606
$595 PUTS 2/11
Entry: Breakdown/Rejection Under $599.92 OR $603
Targets🎯: $595, $591.54

SPY/QQQ Plan Your Trade For 1-28 : Temp Bottom PatternToday's SPY Cycle Pattern is a Temp Bottom.
After yesterday's big breakdown and consolidation, I believe the SPY will attempt to identify support, possibly near 597, and attempt to move higher a bit today.
Ultimately, a Temp Bottom pattern is where the price seeks out support (moving downward or retesting recent support levels) and then rolls to the upside, creating a base/bottom type of pattern.
The QQQ should follow the same pattern.
Gold and Silver seem trapped for the next 2-3 days (possibly melting a bit higher as the US Dollar appears to be moving downward a bit).
I don't see Gold/Silver starting to make any big moves until Jan 31 or in early Feb.
Bitcoin will likely stall out, just like the SPY/QQQ, over the next 2-3 days, then move into a downward price phase - attempting to move back towards $92k.
I believe the markets are stalling and in a bit of shock at the moment. Don't get too aggressive in any trades unless you are confident in your ability to manage risk levels.
Some sectors/symbols will trend. But the SPY/QQQ will likely stall out for another 2-3 days before making another big move.
Get some.
#trading #research #investing #tradingalgos #tradingsignals #cycles #fibonacci #elliotwave #modelingsystems #stocks #bitcoin #btcusd #cryptos #spy #es #nq #gold

Nothing bad happendThe US markets fell sharply today. The S&P500 lost almost 2%. Many investors, especially on social media, are wondering whether the “Trump Rally” is now over. I think this is extremely unlikely. As is so often the case, markets tend to exaggerate, both upwards and downwards.
The price slide was triggered by news from China. Th AMEX:SPY ere, the start-up “DeepSeek” has announced that it has AI models that work just as well as their US counterparts at a much lower price and with less data.
This will certainly not have a lasting impact, but it should make us aware that the AI party will be over at some point.