SPY/QQQ Plan Your Trade For 5-8 : EPP & Cradle Pattern UpdateThis video highlights why I continue to stay very cautious of this upward price move in the US markets.
It also highlights that the current trend is BULLISH - not BEARISH. When I post the videos in the morning, I've been selecting BEARISH as the general trend because I believe the markets are going to roll over into a breakdown phase. Until that happens, though, the markets are in a BULLISH price trend - attempting to possibly break above the current Ultimate High.
This is more of an instructional video - trying to show you why I continue to urge caution related to trends and why I belive we may have many months to go before the US markets really start to make a bigger "exit trend" type of move (exiting this broad consolidation range).
The other thing this video should teach you is how to identify EPP and Cradle patterns more efficiently and how to use them.
Ultimately, everything I share with all of you is designed to help you understand price as the ultimate indicator.
If you can grasp these concepts and understand how each phase of price structure presents opportunities, then you should be able to time and execute your trades very efficiently.
As I've stated in the videos, because of family medical issues over the past 60+ days, I've moved away from daytrading and gone back to a 2-5+ week swing trading style.
Simply put, I'm driving all over the place taking care of my family, seeing doctors, and other stuff - so I can't stare at my PC/Phone while the markets are open.
I'm also taking very low risk trades. If I decide to get into a trade, I'm usually avoiding the SPY/QQQ and selecting some SPDR sector (or other ETF) that allows me to play the move I expect without risking a fortune doing it.
Anyway, I hope you enjoy this video. I'll probably create one more after this video posts.
Get some.
#trading #research #investing #tradingalgos #tradingsignals #cycles #fibonacci #elliotwave #modelingsystems #stocks #bitcoin #btcusd #cryptos #spy #gold #nq #investing #trading #spytrading #spymarket #tradingmarket #stockmarket #silver
SPDR S&P 500 ETF (SPY)

$SPY / $QQQ – Bull Flag Breakout in Progress?📈 Both AMEX:SPY and NASDAQ:QQQ just broke out of bull flag patterns after a strong recovery from the April lows.
🔍 Technical setup:
Flags formed after a vertical rally ✅
Breakout candles with follow-through ✅
Still riding key EMAs (20/50) with decent volume ✅
📌 Targets based on flagpole projection:
AMEX:SPY → ~582–590
NASDAQ:QQQ → ~505–510
However… mind the context:
We’re heading into macro risk events, and positioning is getting crowded.
These breakouts need confirmation via volume + higher high closes.

SPX500 local top at 5700? Serious retrace could hit 5500SPX back to its "Liberation Day" highs and possible end of local wave.
Local 4.236 fib at 5700.72 may have marked end of this wave up.
Dip targets include the various green fibs but major target 5505.42
Green Zone below is a MUST HOLD or we return to Bear Markets.
.
===================
Previous Charts below
==================
Major TOP call:
Liberation Day top call:
Tariff Relief road map:
================================================================
.

2025 forecast NYA Wave B top nearing 20% decline plusThe chart posted is that of the NYA .12/8 /2024 Major wave B top forming target 20,190 alt 22130 . Cycles are bearish into 2025 and well into oct 2026 Depression Like decline . into oct 2026 . First big decline should take us down into the spiral turn date 3/10 2025 week . in what should be an 11.8 to 16.6 % decline we should then see a rally into Mid July to Sept 2nd Then cycles begin next bear cycle phase . Down hard in most of 2026 The market in this decline should take us down about another 26 to 35% in wave 3 , The final low if the big picture is correct should see a major low oct 10/20 2026 the total decline should be 38% to 44 % Gold should see 1050 to 1489 . Bonds should form a rally but will fail over n over . BMV:US should see 119 to 121 handle in 2025 by mid oct 2025 . . Tariffs and the trade war are the main reason . But the markets since 2009 have been Liquidity driven with zero rates forced money flows into Assets 2025 will see a Deleveraging of inflation assets as we decline in housing markets based on the 18.8 year cycle in housing . Unemployment will see a sharp rise into 5.5 -6.1% into oct 2025 . based on downsizing of the federal workers Bitcoin will see a drop min 42/35 and a final low is 18500 to 22100 peak to low . . In dec 2021 Forecast called for a 20 plus decline into oct 10 to the 20th 2022 into 3510 to 3490 in the sp 500 .Dec 2022 forecast was calling for a rally to new highs in all indexes . In dec 2023 forecast called for the sp to reach 5636 to 5818 and the year of a vix of 29 or better we saw 60 . What next is at most I have said is a target in the sp of 6183/6235 We may or may not reach that But if is going to it will be jan 2 to the 20th 2025 . The last of the money flow . Best of trades WAVETIMER

SPY/QQQ Plan Your Trade For 5-8 : Carryover PatternToday's Pattern is a Carryover pattern in Carryover mode.
After yesterday's FOMC news (unchanged), the markets are seeking a bit of direction. Bitcoin rallied and INVALIDATED a EPP Flagging pattern. In my opinion this suggests the SPY/QQQ may attempt to move a bit higher after the Fed decision.
Although, I still believe the global markets are reacting to uncertainty and tariff news within a very broad consolidation range. So, I'm cautious of trying to go ALL-IN on any long trades at the moment.
Until we break clear of the consolidation range, price could break strongly to the downside on news or geopolitical content. In reality, any type of big news could prompt a downward price move within an uptrend or a consolidation range.
It just seems as though the current global market environment is fraught with uncertainty - so I continue to stay cautious.
Gold and Silver pulled downward overnight. But I still believe metals will continue to rally - attempting to hedge against global risks.
With Bitcoin rallying a bit higher (still in consolidation) - let's see how the next few days play out.
I would be surprised if BTCUSD and the SPY rallied to new highs before the end of May. VERY SURPRISED given the status of the global markets.
But, the markets can stay completely irrational much longer than I can try to fight them. So we have to move WITH the markets - not against them.
Get some.
#trading #research #investing #tradingalgos #tradingsignals #cycles #fibonacci #elliotwave #modelingsystems #stocks #bitcoin #btcusd #cryptos #spy #gold #nq #investing #trading #spytrading #spymarket #tradingmarket #stockmarket #silver

Up-a-Bar, Down-a-Bar? Sorted.Gap Higher Into 5700 Heat
Ever make a tiny tweak to your bias, ignore the noise, and then watch the market validate every inch of it?
That’s the vibe this morning.
Yesterday’s post-FOMC tag of the lower Bollinger Band confirmed the mechanical turn, and if you’ve been following along, that means our bullish bias got an official upgrade. Futures are already up 60 points overnight, price is lifting into the 5700 zone, and yes… that broken wing butterfly we placed in the slop is now basking in the spotlight.
Didn’t catch the full breakdown of that clean +98.1% ROC win? You should. Because boring trades print – and this one did just that.
---
SPX Market View
Let’s talk about the move we didn’t miss.
We spotted the sideways chop. The indecision. The textbook “up-a-bar, down-a-bar” noise. But instead of guessing direction into FOMC chaos, we made a minor but vital adjustment:
Bullish above 5600. Stay mechanical. Stay patient.
That call aged well.
FOMC came and went with all the urgency of a soggy biscuit. The lower Bollinger Band tag arrived right on cue, and with overnight futures up strong, we’re sitting in validation territory.
Now today? 5700 becomes the zone of truth.
It’s the GEX cluster.
It’s the high of the week. (so far)
It’s where a gap-and-go or gap-and-fade could unfold.
If price breaks clean, we could see new highs forming into the weekend. If not, expect a choppy pullback from the open before things stabilise.
Either way…
Already in swings. Already got B&B on. No need to chase.
Let the market come to us.
This is why structure wins.
Expert Insights:
Flipping bias mid-chop – let price confirm. Don’t front-run.
Forcing entries post-gap – wait for structure, not speed.
Ignoring prior levels – 5700 is loaded. Watch for traps.
Missing the post-review edge – yesterday’s trade gives today’s confidence.
Chasing noise into FOMC hangovers – let the dust settle before committing.
---
Rumour Has It…
Apparently, the Fed’s post-FOMC statement was originally just a shrug emoji and the word “meh” repeated 17 times. When asked to elaborate, the AI bot in charge blinked twice and played a jazz loop. Traders remain unsure if it was dovish or just tired.
This is entirely made-up satire. Probably!
Breaking scoops courtesy of the Financial Nuts Newswire-because who needs sanity?
---
Fun Fact
In 1983, the S&P 500 posted its largest one-day post-Fed reversal at the time, rallying over 3% after a morning selloff – all while inflation was double digits and headlines screamed chaos.
The takeaway? News means nothing if your setup is clean and your risk is defined. The same edge applies today.

Weekly Forecasts UPDATES! ALL Markets Analyzed! Stocks & FOREXIn this Weekly Forecast UPDATE, we will analyze the S&P 500, NASDAQ, DOW JONES, Gold and Metals futures, and the FOREX Majors for Thursday, May 8th.
The targets set in last weekend's forecasts are still in play! Trade accordingly.
Enjoy!
May profits be upon you.
Leave any questions or comments in the comment section.
I appreciate any feedback from my viewers!
Like and/or subscribe if you want more accurate analysis.
Thank you so much!
Disclaimer:
I do not provide personal investment advice and I am not a qualified licensed investment advisor.
All information found here, including any ideas, opinions, views, predictions, forecasts, commentaries, suggestions, expressed or implied herein, are for informational, entertainment or educational purposes only and should not be construed as personal investment advice. While the information provided is believed to be accurate, it may include errors or inaccuracies.
I will not and cannot be held liable for any actions you take as a result of anything you read here.
Conduct your own due diligence, or consult a licensed financial advisor or broker before making any and all investment decisions. Any investments, trades, speculations, or decisions made on the basis of any information found on this channel, expressed or implied herein, are committed at your own risk, financial or otherwise.

Nightly $SPY / $SPX Scenarios for May 8, 2025🔮 Nightly AMEX:SPY / SP:SPX Scenarios for May 8, 2025 🔮
🌍 Market-Moving News 🌍
🇺🇸 Fed Holds Rates Steady Amid Economic Uncertainty
The Federal Reserve maintained its benchmark interest rate at 4.25%-4.5%, citing concerns over rising inflation and economic risks. Fed Chair Jerome Powell emphasized a cautious approach, indicating no immediate plans for policy changes.
🤝 U.S.-China Trade Talks Scheduled
Treasury Secretary Scott Bessent and chief negotiator Jamieson Greer are set to meet China's economic head He Lifeng in Switzerland, marking a potential step toward resolving trade tensions. The announcement has positively influenced global markets.
📈 Record $500 Billion Share Buyback Plans
U.S. companies have announced a record-breaking $500 billion in share buybacks, reflecting growing hesitation to make capital investments amid economic uncertainty driven by President Trump's trade policies. Major contributors include Apple ( NASDAQ:AAPL ), Alphabet ( NASDAQ:GOOGL ), and Visa ( NYSE:V ).
⚠️ Recession Warnings from Economists
Former IMF chief economist Ken Rogoff warns that a U.S. recession is likely this summer, primarily driven by President Donald Trump's aggressive tariff policies. He suggests that markets are overly optimistic and not adequately accounting for the risks.
📊 Key Data Releases 📊
📅 Thursday, May 8:
8:30 AM ET: Initial Jobless Claims
8:30 AM ET: Continuing Jobless Claims
8:30 AM ET: Nonfarm Productivity (Q1 Preliminary)
8:30 AM ET: Unit Labor Costs (Q1 Preliminary)
10:00 AM ET: Wholesale Inventories (March Final)
10:30 AM ET: Natural Gas Storage
⚠️ Disclaimer:
This information is for educational and informational purposes only and should not be construed as financial advice. Always consult a licensed financial advisor before making investment decisions.
📌 #trading #stockmarket #economy #news #trendtao #charting #technicalanalysis

SPY Chart Analysis Symmetrical Triangle Signals Potential BreakThe SPDR S&P 500 ETF Trust (SPY) is exhibiting a classic technical setup that may lead to a significant price move. As of early May 2025, SPY is consolidating within a symmetrical triangle, a pattern commonly associated with periods of indecision and coiled momentum.
The Technical Setup
A symmetrical triangle forms when the price creates lower highs and higher lows, resulting in converging trendlines. Unlike directional patterns such as rising or falling wedges, symmetrical triangles are neutral by nature and can break either upward or downward. The tightening price action reflects a temporary equilibrium between buyers and sellers, typically followed by a breakout once either side gains control.
In SPY's case, the upper trendline is sloping downward while the lower trendline slopes upward. Price is currently moving within this narrowing range, with volatility compressing. This structure is a hallmark of market consolidation and is often seen ahead of larger directional moves.
Key Price Levels
While the triangle pattern itself does not predict direction, it does define key technical levels:
A breakout above the upper trendline would suggest renewed bullish momentum.
A breakdown below the lower trendline could indicate the start of a new downward move.
Traders and investors should watch for a strong daily close beyond the triangle boundaries, ideally supported by increased volume, which would signal conviction behind the move.
Volume and Market Context
The volume profile has been declining during the formation of this pattern, which is typical and further validates the setup. Volume contraction during consolidation is often followed by a surge when price breaks out, making volume a crucial secondary indicator for confirmation.
It’s also worth considering the broader market context. SPY has been recovering from its recent pullback, but resistance remains overhead. A confirmed breakout from this symmetrical triangle could act as a catalyst for continuation. On the other hand, a breakdown may open the door to further downside as support levels are tested.
Conclusion
SPY is at a technical crossroads. The symmetrical triangle pattern suggests that the current sideways movement will soon resolve into a more directional trend. Rather than predicting the outcome, traders should stay alert for a confirmed breakout or breakdown, supported by strong volume. This will provide the clearest signal on SPY’s next move and help define risk and reward going forward.

SPY/QQQ Plan Your Trade For 5-7 : Post FOMC UpdateThis video highlights a number of factors why I believe the markets are stalling and are likely to REVERT back to the 515-525 area on the SPY.
Without any real economic driving component, while tariffs and other concerns continue to play out, I believe the SPY will continue to search for Ultimate Support over the next 5-7+ months, then move into an upward reversion phase.
Part of what I'm trying to teach my followers is to try to understand how price operates in structures and phases.
Price only does two things: TRENDS or FLAGS
Within those phases, price structures (EPP, Cradle, and others) take over to determine how and why price may or may not attempt to make certain price moves.
Additionally, without any bias, or economic impetus (driver), price tends to REVERT.
In this video, I show you how to use the STDDEV channels to identify possible target areas for the different phases of market trend.
Ultimately, IMO, trading is about being able to see the price structure, phases, and path of least resistance (in terms of bias/expectations). This helps us position for the highest probability outcome (and hopefully for successful trades).
Remember, all of these techniques can be applied to intra-day charts the same way I'm applying them to Daily and Weekly charts.
Remember, price only does two things: TREND or FLAG.
Once you understand that, applying price structures/phases to price while it TRENDS or FLAGS helps you to gain a keen understanding of where price may target/move in the immediate future.
Hope this helps.
Get Some.
#trading #research #investing #tradingalgos #tradingsignals #cycles #fibonacci #elliotwave #modelingsystems #stocks #bitcoin #btcusd #cryptos #spy #gold #nq #investing #trading #spytrading #spymarket #tradingmarket #stockmarket #silver

FED DAY IS HERE! $qqq at MAJOR resistance. Today will be a tellQQQ is stuck under the 200sma and a supply zone. WE have used up a lot of the tarriff deals news flow. The market will be looking to uncle Jerome for direction. If he comes in dovish and says the inflation is tempered we could push through into the suction zone.
If he comes in hot and says the tariff war heating up inflation we could get a big pause on the rally. with the QQQ under so much supply this is a logical spot for Powell to dump on the market.
We have the 9ema under if we break under it will trigger a short for me. if we stay above its a leave alone unless we remount the 200sma on the daily chart.

$STZ Get Upgrade and $125 Price TargetNYSE:STZ Has been in a stage one base for about 4 months and is above all the Moving Averages with the fastest on top and slowest on bottom. With the new upgrade can it breakout into a stage 2 uptrend?
I have an alert set at just 188.50, right in the resistance area. I will take the trade if it triggers with a stop just below the most recent low of 182.62. That makes a well-defined risk reward for me.
On the fundamental side, we are moving into summer and beverage sales could easily pick up.

SPY/QQQ Plan Your Trade Video For 5-7 : Breakaway In CounterToday's Breakaway In Counter Trend mode suggests the markets will likely attempt to break downward before the end of trading, today. Why do I state the downward trend direction?
Because the LT/ST trends are BULLISH and the general upward price trend in the SPY over the past 5-10+ days.
Counter-trend patterns are typically inverted compared to the general 5-8 day price trend. If we can't clearly identify a 5-8 day price trend, then the counter-trend patterns should be determined based on the ST/LT and BIAS trend information on the SPY Cycle Patterns data window.
Today, being a FOMC comment day, should stay rather muted/sideways in early trading. Normally, on FOMC days, the markets tend to stay paused ahead of the FOMC comments.
I believe the FED will not raise or lower rates - meaning NO CHANGE. I don't believe the US Fed has any reason to be concerned with US economic performance right now.
Gold and Silver should move into a rally phase today - but that will likely come near the end of the day as the FED comments drive the markets.
BTCUSD has moved into an early FLAGGING formation. This could be very interesting as BTCUSD has been leading the SPY/QQQ by about 4-6 trading days over the past few weeks.
If BTCUSD continues to lead the SPY/QQQ - that means the SPY/QQQ would be in the early breakdown phase right now - moving into a FLAGGING formation possibly next week.
Get some.
#trading #research #investing #tradingalgos #tradingsignals #cycles #fibonacci #elliotwave #modelingsystems #stocks #bitcoin #btcusd #cryptos #spy #gold #nq #investing #trading #spytrading #spymarket #tradingmarket #stockmarket #silver

5600: Bullish Border or Bear Trap?Theta’s Working. Setup’s Lurking.
This market’s behaving like it needs a reboot. We’ve got the classic tag‑n‑turn setup doing a dodgy impression of itself-upper band got touched, but instead of a clean pivot, we’ve now got a bearish pulse bar flashing and a near‑miss on the lower Bollinger Band. It’s like waiting for a bus, getting two at once, and realising they’re both headed to “Confusion Junction.”
So here’s the deal: 5600 is now the cliff edge. Stay above, and we’ve got some bullish life. Drop below, and we’re in breakdown city. If you’re testing the waters today, keep it light. FOMC is on deck, and that alone can whiplash any intraday idea straight off your charts.
Meanwhile, theta quietly does its work in the background, even if price action’s stuck in a tight horizontal fog. And for the more cautious of you yes, we’re experimenting with broken wing butterflies as a way to lean into the system without going full throttle. More on that in today’s Fast Forward call.
---
SPX Market View
Let’s break down the weirdness.
We’re in a mechanical tag‑n‑turn, but it’s misbehaving.
Usually, the upper Bollinger Band tap sets off a swift reversal. But this time? We got the tag… and then nothing. Just sideways drift. Until yesterday, that is, when bear pulse bars flickered in, suggesting sellers might finally be stretching their legs.
Now? We’re hovering just shy of a lower Bollinger Band tag, with the bands pinching tighter than a miser’s wallet. This setup is usually the calm before either a surge—or a slip.
Enter the line: 5600.
• Above 5600: bull bias stays alive.
• Below 5600: breakdown setup gets the greenlight.
The GEX crowd seems to be repositioning slightly, but the main range remains intact. Volatility premiums are compressing again, suggesting the real move hasn’t triggered yet.
If you’re risk‑curious but cautious, broken wing butterflys are worth exploring. By placing your risk off-centre, you create room to collect theta while limiting max damage if direction gets wonky. I’ve been testing it in real-time, and I’ll share specifics on today’s mentorship call.
And then, of course, we’ve got the FOMC main session coming up.
If that makes your stomach churn—don’t trade it. Watch it. Tomorrow’s another day. No one gets a prize for being caught on the wrong side of a news candle.
---
Expert Insights:
Assuming a tag means turn – the tag-n-turn isn’t magic. Wait for confirmation.
Forcing trades around news events – FOMC days don’t need your capital.
Underestimating sideways risk – no trend doesn’t mean no danger.
Skipping risk-defined plays – BWB’s give breathing room when setups are unclear.
Failing to adjust bias – bullish and bearish both live here—bias must shift with price.
---
Rumour Has It…
A mysterious algorithm known only as “TurnTagger X” is reportedly running its own contrarian SPX strategy. It waits for tag-n-turn setups-then does the exact opposite, cackling through your stops. One trader claims it’s powered by caffeine, salt, and old Janet Yellen quotes. Could be hedge fund AI… or just your broker’s cat walking on the keyboard.
This is entirely made-up satire. Probably!
Breaking scoops courtesy of the Financial Nuts Newswire-because who needs sanity?
AI-Powered ETFs Go on Strike
A rogue batch of AI ETFs issued a joint statement this morning refusing to rebalance “until humans stop panic-buying tops.” BlackRock is reportedly negotiating with a mediator chatbot named GaryBot-9000.
Retail Traders Launch ‘NapMap’ App
After months of whipsaw hell, Reddit traders launched NapMap – a tool that identifies the safest hours to sleep through “algorithmic tantrums.” It’s already outperforming the S&P.
CBOE Announces ‘Calm VIX’
The Chicago Board of Exchange revealed its newest product: a “Calm VIX” that tracks how unbothered markets pretend to be. Readings are currently at ‘Zen Master’ despite 4 black swans circling the drain.
This is entirely made-up satire. Probably!
Breaking scoops courtesy of the Financial Nuts Newswire-because who needs sanity?
---
Fun Fact
The phrase “broken wing butterfly” comes from aviation-not options. Pilots once used the term to describe asymmetric recovery manoeuvres. Traders later borrowed it to describe strategies with off-centre risk profiles-ideal when you expect range but want room for error.
Bonus trivia: the strategy can be structured for credit or debit, making it one of the few “choose-your-own-adventure” plays in options.
Cartoon metaphor for using broken wing butterflys in volatile markets.

Nightly $SPY / $SPX Scenarios for May 7, 2025🔮 Nightly AMEX:SPY / SP:SPX Scenarios for May 7, 2025 🔮
🌍 Market-Moving News 🌍
🏛️ Fed Decision Day Amid Tariff Pressures
The Federal Reserve concludes its two-day meeting today, with expectations to maintain the benchmark interest rate at 4.25%-4.5%. Despite President Trump's calls for rate cuts, the Fed remains cautious due to inflationary risks from new tariffs and migration policies.
📈 U.S.-China Trade Talks Resume
U.S. stock futures rose overnight on news of upcoming high-level trade talks between the U.S. and China, marking the first discussions since the imposition of 145% tariffs on Chinese goods. Treasury Secretary Scott Bessent and U.S. Trade Representative Jamieson Greer are set to meet with senior Chinese officials later this week.
🛢️ Oil Prices Rebound on Demand Hopes
Oil prices climbed as U.S. production declined and demand in Europe and China showed signs of recovery. Brent crude rose 0.6% to $62.52 per barrel, while U.S. West Texas Intermediate increased 0.74% to $59.53 per barrel.
💼 Key Earnings Reports Ahead
Several major companies, including Uber ( NYSE:UBER ), Disney ( NYSE:DIS ), and Novo Nordisk ( NYSE:NVO ), are scheduled to report earnings today. Investors will be watching these reports for insights into corporate performance amid ongoing economic uncertainties.
📊 Key Data Releases 📊
📅 Wednesday, May 7:
2:00 PM ET: Federal Open Market Committee (FOMC) Meeting Announcement
2:30 PM ET: Fed Chair Jerome Powell Press Conference
3:00 PM ET: Consumer Credit Report (March)
⚠️ Disclaimer:
This information is for educational and informational purposes only and should not be construed as financial advice. Always consult a licensed financial advisor before making investment decisions.
📌 #trading #stockmarket #economy #news #trendtao #charting #technicalanalysis

AMD BULLISH MAY6TH 2025AMD has its earnings today & I am bullish as per the price action. I have managed my risk, and I am long irrespective of any news. I have discussed in depth analysis of AMD. If you have any questions, feel free to leave a comment below.
NOTE: I AM LONG ONLY WITH STOCKS

MES1!/ES1! Day Trade Plan for 05/06/2025MES1!/ES1! Day Trade Plan for 05/06/2025
📈 5625 5638 5650
📉 5614 5602 5590
Thanks to all my followers! Truly appreciate the support!
Please like and share for more ES/NQ levels Tues & Thurs 🤓📈📉🎯💰
*These levels are derived from comprehensive backtesting and research and a quantitative system demonstrating high accuracy. This statistical foundation suggests that price movements are likely to exceed initial estimates.*

MNQ1!/NQ1! Day Trade Plan for 05/06/2025MNQ1!/NQ1! Day Trade Plan for 05/06/2025
📈 19840 19900 19965
📉 19779 19717 19655
Thanks to all my followers! Truly appreciate the support!
Please like and share for more ES/NQ levels Tues & Thurs 🤓📈📉🎯💰
*These levels are derived from comprehensive backtesting and research and a quantitative system demonstrating high accuracy. This statistical foundation suggests that price movements are likely to exceed initial estimates.*

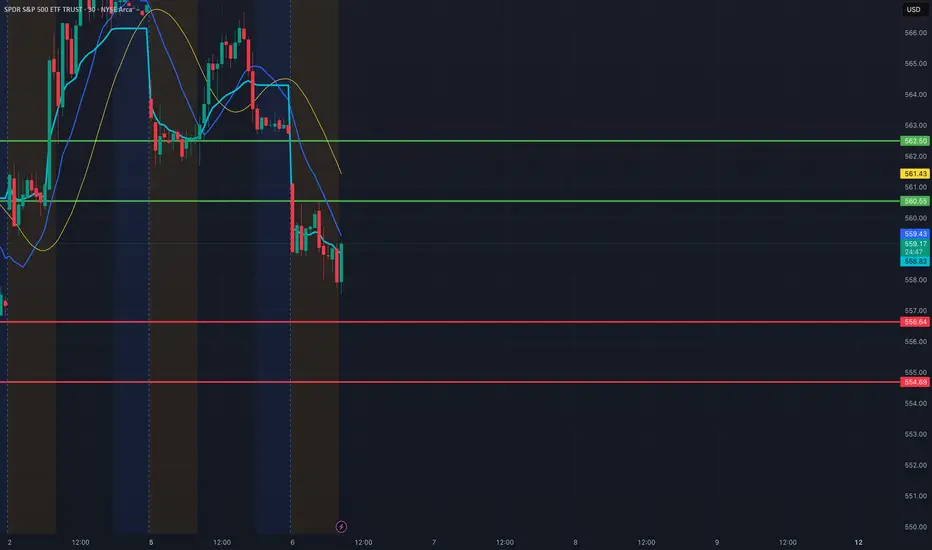
SPY Day Trade Plan for 05/06/2025SPY Day Trade Plan for 05/06/2025
📈 560.55 562.50
📉 556.64 554.69
Thanks to all my followers! Truly appreciate the support!
Please like and share for more ES/NQ levels Tues & Thurs 🤓📈📉🎯💰
*These levels are derived from comprehensive backtesting and research and a quantitative system demonstrating high accuracy. This statistical foundation suggests that price movements are likely to exceed initial estimates.*
Looking for One More High So far, our minor B wave price action has not thrown us any curveballs, which is somewhat unusual considering B waves can become very complex. As I get into the micro price action, this pattern would fit better completed with at least one more high.
Nonetheless, I will offer a warning, we are in the target box...if you are long, please use stops, and make sure your position size is risk managed.
Best to all,
Chris

Tesla Grabbing Liquidity Market Context 🚩
1-Month Move: +7.3% (from $261.30)
1-Year Move: +45.6% (from $192.50)
Technicals
RSI: ~68.4 (nearing overbought )
Moving Averages: Above 20-day, 50-day, and 200-day MAs (uptrend, but showing signs of exhaustion )
MACD: Bearish crossover forming (momentum fading, potential pullback )
Trade Setup
Instrument: TSLA ❌
Direction: PUT
Entry Price: $280.21
Take Profit 1 (TP1): $270.00 (~3.6% gain ) 🟢
Take Profit 2 (TP2): $260.00 (~7.2% gain ) 🟢
Expected Move: ~8–10% downward
Best AI Signals on the market.

SPY/QQQ Plan Your Trade For 5-6 : GAP Breakaway patternToday's pattern suggests a morning GAP will take place and price will continue to break away from yesterday's body range.
Given the fact that the markets are already almost 0.8-0.9% lower than yesterday's closing price level, this suggests the markets will continue to trend downward today.
Is this it? Is this the breakdown for May 2-5, seeking the Major Bottom I've talked about for the past 3+ weeks?
We'll find out over the next 5-10+ days.
Ultimately, the EPP patterns have aligned across multiple instruments/symbols to present a very clear opportunity to the downside. Now, we need to watch and wait as the markets should be moving into the early FLAGGING stage of the downward EPP pattern.
After the FLAGGING pattern, we should get the breakdown into consolidation, which is where I believe big profits can be made. That breakdown into the consolidation phase is usually very aggressive and can often be after the FLAGGING range.
Gold and Silver are making a move higher. I suggested this would be the case over the past 5-10+ days - but, boy, was it frustrating to watch Gold and Silver consolidate over the past few weeks.
At this point, I'm looking for Gold to rally above $3500 and for Silver to attempt to rally above $34.00.
Bitcoin seems to be leading the SPY/QQQ (again) and appears to be about 2-3 days ahead of the major US indexes, attempting to move into a downward FLAGGING formation.
This could be very interesting if BTCUSD continues to lead the SPY/QQQ. Meaning, we may be able to rely on the structures/setups in BTCUSD as a 2-3 day early window of that the SPY/QQQ may be doing (for a while). I'm sure it won't continue to align at some point in the future.
Again, I'm getting great comments from followers and subscribers. Thank you.
I'm doing my best to deliver the best research I can within these 15 to 20-min videos.
Get some.
#trading #research #investing #tradingalgos #tradingsignals #cycles #fibonacci #elliotwave #modelingsystems #stocks #bitcoin #btcusd #cryptos #spy #gold #nq #investing #trading #spytrading #spymarket #tradingmarket #stockmarket #silver

May 6, 2025 - Markets Hold Their Breath Before Powell SpeaksHello everyone, it’s May 6, 2025 and markets are once again at the mercy of politics, Powell, and presidential mood swings.
After a 9-day rally, U.S. markets finally took a breather yesterday, with mild profit-taking ahead of the much-anticipated Federal Reserve decision. Investors are caught between two competing visions: Trump’s push for massive rate cuts, insisting inflation is a myth cooked up by bureaucrats, and Powell’s more sober stance acknowledging inflation isn’t dead, the economy is softening, and premature easing could trigger full-blown stagflation.
With Friday’s job report stronger than expected, Powell is expected to hold rates steady, staying cautious while tariffs and growth clouds loom. Markets are pricing in a July cut at best, but uncertainty lingers mostly around what Trump might tweet in reaction to Powell’s speech tomorrow night.
Meanwhile, despite the 90-day tariff moratorium, the trade war narrative hasn’t vanished. NYSE:F suspended its 2025 outlook, citing $1.5 billion in expected tariff costs and four major risks: disrupted supply chains, retaliatory measures, unclear tax policies, and emission rules. NASDAQ:MAT is also hedging its bets shifting production out of China and pausing forecasts, while begging for zero tariffs on toys “for the kids.” Their stocks dropped modestly after hours.
OANDA:XAUUSD surged again to $3,368, as fear and safe-haven demand ticked up. BLACKBULL:WTI rebounded to over $58 following an OPEC statement, helping airline stocks breathe a bit. BINANCE:BTCUSDT continued its meteoric rise, now sitting around $94,400.
On the macro front, inflation data like CPI and PPI are being shrugged off everyone’s waiting to see if Powell plays ball with Trump. There’s hope, too, that all this chaos is just Trump’s way of muscling the world into negotiation especially China and if a “deal” emerges, markets could rip higher. Until then, we’re stuck dancing between uncertainty and hope.
Asia opened strong this morning, led by China’s cautious optimism. Futures point slightly lower in the U.S., and volatility remains king. The Fed could flip the script tomorrow or keep us hanging. Stay buckled in.
