SPY at 3 important event! POC, 200 ema and 30 days reversalHi All SPY is at an interesting intersection:
1) a month from where it crashed and reversed entirely
2) At point of control (POC) from the top in Feb
3) at 200 ema
In Aug 22 SPY reversed from POC, at other times it found support or broke out with a gap
My opinion is, it will continue going up till 13th May (date when CPI is published). Nobody knows for sure how much tariff will impact CPI. It cannot as bad as we had during covid.
SPDR S&P 500 ETF (SPY)

SPY Day Trade Plan for 05/01/2025SPY Day Trade Plan for 05/01/2025
📈 562.70 565.60
📉 557 554.30
Thanks to all my followers! Truly appreciate the support!
Please like and share for more ES/NQ levels Tues & Thurs 🤓📈📉🎯💰
*These levels are derived from comprehensive backtesting and research and a quantitative system demonstrating high accuracy. This statistical foundation suggests that price movements are likely to exceed initial estimates.*

SPY Day Trade Plan for 04/29/2025SPY Day Trade Plan for 04/29/2025
📈 550 553 556
📉 544 543 540.50
Thanks to all my followers! Truly appreciate the support!
Please like and share for more ES/NQ levels Tues & Thurs 🤓📈📉🎯💰
*These levels are derived from comprehensive backtesting and research and a quantitative system demonstrating high accuracy. This statistical foundation suggests that price movements are likely to exceed initial estimates.*
MARKETS NOT OVERSOLD CAUTION! UPDATE!This is a monthly chart and TV keeps forcing "Target reached" on my updates. As such i am reposting this chart I first issued back on April 1st, 2025, before our "LIBERATION DAY" FACEPALM!
We are still not oversold on a monthly chart!
WARNING!
Click Boost, follow, subscribe!

Today is oct 14th 1929 I have moved back to Long puts at 105%The chart posted was in the forecast written dec 8th 2024 We have now reached my targets of 5669 area I have been buying the dips in calls and made $ I am now 105 % long in the money puts and I do Not see a bottom until july once we break and a second bottom mid oct The market should see a drop of 38 % into july and form a small double bottom in oct at 41 % off the highs . I will move to 125 % long puts on a sell stop at 5300 even the math at 5334 is key Best of trades WAVETIMER

Nasdaq-100 Goes Back to 'PRE-PAIN' 20 000 Level. Series IIApril has gone..
Wow.. Duh..!? ..really? ... or still not!?
Briefly a month ago or so, we have examined at our wonderful @PandorraResearch Team what is 'Revenge Trading', watch our recent 'Educational' idea right here (if you missed one), to learn what sort of lessons we should know about it.
Indeed, it was a really bad story, to purchase in late March 2025 most-hyped so-known Mag Seven stock that came flagships of the recent stock market collapse.
First of all, watch how it's been below (late March 2025) 👇👇
What's happened next just in a week or two since our publications has been made?
⚒ Russell 2000 Index TVC:RUT 95% stocks were: DOWN
⚒ S&P500 Index SP:SPX 96% stocks were: DOWN
⚒ Nasdaq-100 NASDAQ:NDX as well as Dow Jones Industrial Averages DJIA indices: 97% stocks were DOWN
⚒ Magnificent Seven: ALL STOCKS WERE DOWN
Since Nasdaq-100 went back to pre-pain 20'000 Level, lets repeat some lessons.
Revenge trading is DANGEROUS AND HARMFUL pracrice where traders, after suffering a loss, attempt to immediately recoup their losses by making impulsive, emotionally-driven trades. This behavior is widely recognized as one of the major reasons traders lose significant amounts of money and often blow up their accounts.
Why Revenge Trading Is Bad
1. Emotional Decision-Making Replaces Strategy
When traders engage in revenge trading, they abandon their carefully crafted trading strategies and risk management rules. Instead, trades are made based on anger, frustration, or the desire to "get back" at the market. This emotional state clouds judgment, leading to irrational decisions such as increasing position sizes recklessly, disregarding stop-loss orders, or chasing trades without proper analysis. As a result, the likelihood of making successful trades plummets.
2. Escalating Losses and Account Blowups
The urge to recover losses quickly often leads traders to double down or over-leverage their positions, exposing a large portion of their capital to additional risk. Statistically, 80% of revenge trading ends disastrously, with only a small fraction experiencing temporary success before ultimately facing larger losses. This cycle of chasing losses can rapidly erode trading capital, making recovery increasingly difficult.
3. Psychological Burnout and Stress
Revenge trading is mentally and emotionally exhausting. The constant cycle of loss and frantic attempts to recover can lead to stress, depression, and burnout. This further impairs decision-making, creating a vicious cycle of poor performance and deteriorating mental health.
4. Long-Term Damage to Trading Habits
Repeatedly succumbing to revenge trading ingrains bad habits, making it difficult for traders to maintain discipline and consistency in the long run. This lack of consistency undermines the potential for sustainable profitability and can end trading careers prematurely.
Recent Real-World Examples
Recent years have seen numerous cautionary tales illustrating the dangers of revenge trading (all links are from r/wallstreetbets subreddit for learing/ educational purposes only):
$40,000 Lost on NVDA Options (2024). A trader repeatedly doubled down on Nvidia (NVDA) put options during its price rally in mid-2024. Despite initial small wins, the trader, driven by the urge to recover losses, continued to increase his position size, ultimately losing over $40,000.
$26,000 Lost in 20 Minutes on SPX. A Reddit user reported losing $26,000 in about 20 minutes trading the S&P 500 index (SPX) after prices dropped sharply. The loss was the result of impulsive trades made in an attempt to quickly recover from earlier setbacks.
From $27,000 to $0 in Three Days. Another trader turned $500 into $27,000 in just a few days, only to lose it all within 48 hours after a market reversal. Instead of taking profits or stepping back, the trader kept chasing losses with increasingly risky trades, ending up with nothing.
$100,000 Loss on a Yen Carry Trade. A trader, influenced by news of geopolitical tensions, made a large leveraged bet on the yen. After an initial loss, he refused to cut his losses and doubled down, ultimately losing $100,000 instead of accepting a smaller $30,000 hit.
More juicy stories are to be collected...
These stories are not isolated incidents. They are echoed across trading forums and social media, serving as stark warnings of how quickly revenge trading can destroy even substantial gains.
Conclusion
Revenge trading is DANGEROUS AND HARMFUL because it replaces rational, strategic decision-making with emotional reactions, leading to escalating financial losses, psychological distress, and long-term damage to trading discipline. The real-world examples from the past year underscore that no trader-regardless of experience-is immune to its risks. The best defense is to recognize the urge, step away, and return only with a clear, objective mindset and a disciplined strategy.
--
Best wishes,
@PandorraResearch Team 😎

If you think the 2025 bottom is in you couldn't be more wrongIf you think the bottom for 2025 is in and it's only up from here let me have what you're smoking.
Just a puff, please!
About 80% of social media retail traders are confidently calling a bottom, that's a major contrarian signal.
Herding equals danger!
If everyone is bullish, most are already positioned long leaving a few buyers to push prices higher.
It's known as "pain trade" where markets often move in the direction that causes the most discomfort.
Many of loudest voices are retail traders influencers chasing engagement, not portfolio managers or data driven strategists.
AMEX:SPY SP:SPX NASDAQ:QQQ AMEX:DIA NASDAQ:META NASDAQ:NVDA NASDAQ:MSFT NASDAQ:GOOG NASDAQ:AAPL NASDAQ:AMZN

Mechanical Over Mood. AlwaysWell, this week really wanted to test both my trading discipline… and my tech patience.
My laptop decided to kick the bucket mid-session.
But honestly? Not even mad.
Because it reminded me of something traders forget too often:
Simple is better. Mechanical is best.
No charts? No problem.
Noisy bias? Ignore it.
Just follow the system and let the setups do the work.
And right now?
The market gave us a Tag off the lower Bollinger Band…
Then a Turn with some clean bullish pulse bars…
Now we’re tagging the upper band again.
Textbook mechanical structure.
No predictions. No overlays. Just rules.
Yes, compression still lingers – the bands are squeezed tighter than my laptop battery casing.
But until something breaks out (or explodes), I’m trading it simple.
---
SPX Market View
Some days the market whispers.
Some days it screams.
And then… there are days like this – where it quietly tags, turns, and retags like a kid playing solo hide and seek.
Welcome to compression.
Welcome to Tag ‘n Turn 2: Return to the Band.
Yesterday gave us exactly what we needed:
Tag off the lower Bollinger Band
Bullish pulse bars firing in sequence
Now back to the upper BB as of this morning
It’s a full mechanical cycle playing out in slow motion.
The band width? Still squeezed.
So unless we get a confirmed breakout – no compounding, no fireworks, no fast lane.
That’s not a problem.
It’s a feature.
Why?
Because in environments like this, the strategy doesn’t just work – it filters the noise.
No guesswork. No hoping. No “is this the one?”
Just a defined setup, and a playbook that responds only when the price earns it.
I’m staying bullish as long as this range holds.
Pulse bars off the highs or lows? I’m in.
Breakout confirmed? Let’s ride it.
Dip to mid-band? Still valid.
The structure is intact.
The setup is valid.
And even if my laptop’s dying breath is a warning beep, I’ll still be trading off what matters.
Trade the system. Trust the sequence. Let the rest break down.
---
Expert Insights:
Mistake #1: Overcomplicating compressed conditions.
Compression doesn’t mean “do more” – it means “do less, better.”
Fix: Let the pulse bar do the talking. Keep your setup clean.
Mistake #2: Ignoring band re-tags as valid setups.
Returning to the upper or lower band doesn’t invalidate the prior move.
Fix: Use structure. Re-tags can still deliver if pulse bars confirm.
Mistake #3: Letting tech failures bleed into trading decisions.
Just because your screen flickers doesn’t mean your system broke.
Fix: Stay mechanical. Even from a mobile. It’s not the gear – it’s the method.
---
Rumour Has It…
Wall Street insiders are reporting that Apple’s next product will be the MacBook Trader, a laptop designed specifically to fail whenever Bollinger Bands compress.
Features include:
An auto-dimming screen whenever pulse bars form
A built-in “Hope Mode” that deletes your rulebook
And a random error that whispers “maybe just this once…”
Traders are advised to plug directly into their mechanical setups or, failing that, scribble strategies on a coffee-stained napkin like it’s 2002.
Rumour has it that a squirrel from Central Park is currently outperforming several hedge funds using nothing but broken Fibonacci tools and pure optimism.
This is entirely made-up satire. Probably!
Breaking scoops courtesy of the Financial Nuts Newswire-because who needs sanity?
---
Fun Fact – Did You Know?
The term “Frankenstein” originally came from Mary Shelley’s story of a scientist trying to control something he didn’t fully understand…
Which is what most traders do with indicators.
They bolt on RSI here, MACD there, sprinkle in some Fibonacci dust, and hope it walks.
But the real monsters aren’t the tools – they’re discretionary trades pretending to be mechanical.
Moral of the story?
You don’t need a stitched-together algo monster.
You just need a clean pulse bar, a set of rules, and the ability to sit still.

Bulls and Bears zone for 05-01-2025S&P 500 is going to have a gap up Open and finally closing gap from early last month.
Also traders could be taking profit after yesterday's big UP move.
Level to watch: 5643 ---5645
Reports to watch:
US : PMI Manufacturing Final 945am
US : ISM Manufacturing Index 1000am
US : Construction Spending 1000am

SPY/QQQ Plan Your Trade For 5-1 : Bottom-104Today's Bottom pattern suggests the markets will attempt to move downward - trying to find support.
Even though it may appear my May 2-5 Major Bottom pattern will not happen as I expect - this is a very good lesson for traders.
I'm not 100% accurate all the time. Sometimes, the markets do things that are not aligned with my research/patterns and sometimes the markets can be far more irrational than traders expect.
For example, I believe this current rally is more of a speculative rally in the SPY/QQQ/BTCUSD. There is nothing I'm seeing in the Crash Index (or TRAN) to support this upward price move other than traders attempting to "buy the dip".
Ultimately, I believe the current contraction in the global economy based on policies, tariffs and economic disruptions will continue to drive a consolidation, basing type of price trend, traders are buying into this dip and attempting to drive price upward on expectations of a growing global economy.
Time will tell how things play out - but my longer-term modeling systems are still Bearish.
I will be on the road with my father today - so I'm not going to be as available to answer questions.
Watch this video twice if you need to. It will be interesting to see how the next 5+ days in the markets play out.
As I stated, I'm not 100% accurate all the time. I do my best to try to help guide all of you through these market trends with my research and cycle patterns - but, that is not enough to guarantee 100% accuracy on any trade.
That's just how it is in the world. No one is 100% perfect at predicting market moves.
Get some.
#trading #research #investing #tradingalgos #tradingsignals #cycles #fibonacci #elliotwave #modelingsystems #stocks #bitcoin #btcusd #cryptos #spy #gold #nq #investing #trading #spytrading #spymarket #tradingmarket #stockmarket #silver

SPY - dump or bull market is back?hi traders,
Some months ago, we shared the idea where we explained that SPX will experience a correction:
The targets were reached, and next we saw a decent bounce, which is very well visible on the monthly candle.
Today, I see a lot of excitement about the monthly close, and many people call for a new all-time high soon.
I want to bring to your attention the monthly close in 2000.
It looks very similar to what we got yesterday.
A long, lower-shadow wick resulted in a bearish imbalance characterised by an excess of sellers, exerting downward pressure.
I still can see SPY/SPX retesting 570-580 levels, but it doesn't change the fact that lower levels may be tested in the next few weeks/months.
We got a bearish cross on the monthly time frame, which is not a joke.
If bears take control, I expect SPY to visit 460~ levels and later even lower: 410-408.
Long story short:
1. Short-term bounce may continue.
2. Mid-term - bears will take control, and we will see a bigger correction.
Do you agree? Share your opinion in the comments section

Nightly $SPY / $SPX Scenarios for May 1, 2025 🔮 Nightly AMEX:SPY / SP:SPX Scenarios for May 1, 2025 🔮
🌍 Market-Moving News 🌍
🇺🇸 Q1 GDP Contraction Raises Recession Fears
The U.S. economy shrank for the first time in three years, down 0.3% in Q1. Weaker government spending and a rise in imports ahead of Trump’s tariff policies are weighing on growth outlook.
📈 Big Tech Lifts the Market
Strong earnings from Microsoft ( NASDAQ:MSFT ) and Meta ( NASDAQ:META ) have boosted sentiment. Meta’s revenue guidance and capex surge point to aggressive growth positioning in AI and infrastructure.
🏛️ Treasury Refunding Outlook in Focus
Markets are watching the quarterly refunding announcement for clues on upcoming bond issuance. This could influence rate volatility as the Treasury balances deficits and market demand.
🌐 Risk-On Mood Despite Macro Headwinds
Global stocks notched a 4-week high as traders bet on resilient earnings and central bank policy steadiness, even as U.S. macro data softens.
📊 Key Data Releases 📊
📅 Thursday, May 1:
📈 Initial Jobless Claims (8:30 AM ET)
Tracks new unemployment filings – a key gauge of near-term labor market stress.
📈 Continuing Jobless Claims (8:30 AM ET)
Measures ongoing unemployment benefit recipients, reflecting persistent joblessness.
🏗️ Construction Spending (10:00 AM ET)
Reports monthly change in total construction outlays — a direct measure of real economy investment.
🏭 ISM Manufacturing PMI (10:00 AM ET)
Provides a snapshot of U.S. factory activity. Readings below 50 suggest contraction.
⚠️ Disclaimer:
This information is for educational and informational purposes only and should not be construed as financial advice. Always consult a licensed financial advisor before making investment decisions.
📌 #trading #stockmarket #economy #news #trendtao #charting #technicalanalysis

SPX bullishI am now bullish in near term. For those following me, I have updated HILO EMA squeeze band with an option to plot more lines as seen this chart. I see a swing high of 5770, although a bit cautious about the month end. Market is tired of Trump tantrums and more focused on earnings which have been great so far. For near term month or two I would be looking for bye the dip

April 30 Trade Journal & Stock Market Analysis
EOD accountability report: -1310 on a Eval. + 125 on Funded
Sleep: 8 hour, Overall health: :thumbsup:
I used a trailing stoploss ATM order by mistake, and got rid of the stoploss, because market zig zagging it up. BAD BAD Idea
Market humbled me by showing me why i should always have stoploss on.
Back to doing manual stoploss and getting rid of trailing stops because they are horrible during chops
**Daily Trade recap based on VX Algo System**
10:48 AM VXAlgo NQ X3 Buy Signal
11:00 AM Market Structure flipped bullish on VX Algo X3!
— 12:10 PM VXAlgo NQ X1 Sell Signal,
— 2:29 PM VXAlgo ES X1 Sell Signal, (triple sell)
3:30 PM Market Structure flipped bearish on VX Algo X3 (False signal, got cancelled right away)
Next day plan-->
Video Recap -->https://www.tradingview.com/u/WallSt007/#published-charts

SPY/QQQ Plan Your Trade Update For 4-30 : Moving Into FlaggingThis quick update video should help you understand how my May 2-5 Major Bottom pattern could represent a move into FLAGGING within an inverted EPP pattern.
If my research is correct, the next move for the market will be a moderate downward price trend that will represent the FLAGGING portion of the inverted EPP pattern.
You've all see how bullish EPP patterns play out over the past 3 to 5+ months. Now we get to see how this recent SPY low near 480 turns into an inverted EPP pattern. This is basically the same pattern - but forming in an inverted mode.
As we transition through this inverted EPP pattern, what I'm looking for is a breakdown move to create the new FLAGGING formation. This move aligns perfectly with my May 2-5 Major Bottom pattern and could be a perfect setup for the attempted "breaking of the Flag High" in late May 2025.
I'm watching Gold and Silver stay relatively strong today. So I'm seeing today's market move as a "reversion move" - not really a breakdown move (yet).
It will be interesting to see how this plays out.
If the markets move into Flagging, as I expect, the big opportunities will be to ride the Flagging & Breakdown patterns over the next 30+ days before we move into either an INVALIDATION or CONTINUATION phase of the inverted EPP pattern.
Price is the ultimate indicator - you just need to know what to look for.
Get some.
#trading #research #investing #tradingalgos #tradingsignals #cycles #fibonacci #elliotwave #modelingsystems #stocks #bitcoin #btcusd #cryptos #spy #gold #nq #investing #trading #spytrading #spymarket #tradingmarket #stockmarket #silver

REJECTION OF $292Tesla's stock ( NASDAQ:TSLA ) has faced multiple rejections at key resistance levels. To establish a strong upward trend, it may require forming a triple bottom pattern. This would indicate a solid foundation for potential growth. It is anticipated that the stock will retest the $270 and $250 levels before making a decisive move.

SPY/QQQ Plan Your Trade For 4-30 : Carryover PatternToday's Carryover pattern suggests the markets may attempt to trend slightly upward after the big downward pressure/GAP sets up this morning.
As many of you are already aware, I have been predicting a May 2-5 Major Bottom in the markets.
I would suggest today's carryover pattern may be negated by an early breakdown in the markets. If my May 2-5 Major Bottom pattern is going to show up, the markets would likely start to break downward today and tomorrow - leading to the Major CRUSH pattern on Friday.
Gold and Silver appear to be consolidating into a flagging/cradle pattern. I believe the downward pressure on the markets will likely prompt a flush-out low in metals before another big rally phase sets up.
BTCUSD is stalling and will likely pull downward as my May 2-5 Major Bottom pattern plays out.
Basically, HEDGE your positions.
This market looks like it will roll into a moderate low over the next 4-5+ days, then base and bottom after May 10th or so.
As I've suggested, I positioned for this move about 4-5 days ago. Now, I just need to ride it out and start booking profits when they happen.
Get some.
#trading #research #investing #tradingalgos #tradingsignals #cycles #fibonacci #elliotwave #modelingsystems #stocks #bitcoin #btcusd #cryptos #spy #gold #nq #investing #trading #spytrading #spymarket #tradingmarket #stockmarket #silver

Will April Close with a Bang?You ever get that feeling the market’s just waiting for a reason to move?
That’s where we are.
It’s been a quiet start to the week – barely a pulse.
And Tuesday? One signal. Just one.
But it was a bullish pulse bar, and it paid.
Price is still coiling, compressing tighter, and Bollinger Bands are pinching harder than a crab on Red Bull.
We’re seeing the classic signs of range contraction – which usually means a range expansion is coming.
So what’s the move?
Stay bullish.
Stay patient.
And be ready to pounce the moment price breaks free.
Today’s calendar gives us a few nudges – ADP, GDP, ECI, PCE – nothing major, but enough to cause a wobble or spark.
The bias is bullish.
The system’s ready.
And if we break out of this pinch, I’m looking at 6106 on the swing.
Even a dip to 5400 wouldn’t change the structure – just another spot to reload the bulls.
Let’s finish April strong.
Let’s grab another one by the horns.
---
SPX Market View
Let’s call it like it is – the market’s been locked in a deep freeze.
Monday and Tuesday barely moved.
Why?
No real news. Month-end positioning. And a crowd of big players too busy doing their internal accounting gymnastics to push buttons.
But while it looked like nothing happened, Tuesday’s single bullish pulse bar delivered the goods.
One bar. One setup. One result: Profit.
Now as we roll into Wednesday, things get spicy – not because the economic data is explosive… but because compression like this doesn’t last.
The Bollinger Band width is pinched tighter than a tax refund cheque.
And we know what that means:
Tight range = pressure building.
Breakout = opportunity waiting.
So today’s plan?
Stay bullish until proven otherwise.
Use the pulse bar system to play range edges or trigger entries.
Look for breakout confirmation to ride it toward 6106.
Remain calm if we dip toward 5400 – structure still holds.
Economic data today (ADP Jobs, GDP, Employment Costs, and Core PCE) might trigger volatility, but it’s not about reacting to the numbers…
It’s about watching how price responds.
We’re not forecasting.
We’re not feeling.
We’re waiting for the setup – then pulling the trigger.
Price is whispering right now.
Soon, it’ll yell.
Be ready.
---
Expert Insights:
Mistake #1: Assuming news equals movement.
Just because data drops doesn’t mean price pops.
Fix: Always wait for price confirmation. Pulse bars > economic guesses.
Mistake #2: Ditching the bias at the first wobble.
A dip isn’t a collapse.
Fix: Know your structure. Dips to 5400 are still within a bullish regime.
Mistake #3: Forgetting the role of compression.
Tight ranges often precede big shifts.
Fix: Don’t ignore the squeeze. Bollinger Band pinch = breakout fuel.
---
Rumour Has It…
In a desperate bid to solve market stagnation, Wall Street has reportedly hired a motivational speaker named Terry the Turnaround Candle.
His credentials?
He once convinced a doji to become a dragonfly.
Sources say he opens every session with, “Are you going to let that Bollinger Band define you?!”
Meanwhile, the Fed is beta-testing new AI price models based on squirrel hoarding patterns in Central Park.
Traders remain cautiously optimistic.
Squirrels remain heavily long acorns.
This section is entirely made-up satire. Probably.
---
Fun Fact
Did You Know?
The term “month-end rebalancing” sounds official… but it’s really just fund managers shuffling things around so their spreadsheets look prettier.
They often trim winners, pad laggards, and balance sector weights.
But in low-volume markets like this week, even tiny shifts can cause weird little waves that trigger setups.
So when price “randomly” spikes or dips late in the session on month’s end?
It’s often not news – it’s bookkeeping chaos in disguise.
Which is why we trust setups, not headlines.

Nightly $SPY / $SPX Scenarios for April 30, 2025 🔮
🌍 Market-Moving News 🌍
🇺🇸 Bessent's Trade Remarks Stir Markets
Treasury Secretary Scott Bessent emphasized the U.S.'s readiness for a significant trade deal with China, suggesting potential easing of the ongoing tariff war. His comments have heightened investor anticipation for developments in U.S.-China trade relations.
📉 China's Factory Activity Contracts
China's April manufacturing PMI is projected to fall below 50, indicating contraction, as recent U.S. tariffs impact production. This downturn raises concerns about global supply chain disruptions and economic slowdown.
💼 Major Earnings Reports on Deck
Investors await earnings from key companies including Apple ( NASDAQ:AAPL ), Alphabet ( NASDAQ:GOOGL ), Meta Platforms ( NASDAQ:META ), Microsoft ( NASDAQ:MSFT ), and Amazon ( NASDAQ:AMZN ). These reports will provide insights into how tech giants are navigating current economic challenges.
🏛️ Treasury's Borrowing Plans Under Scrutiny
The U.S. Treasury is set to release its quarterly refunding announcement, detailing borrowing plans amid economic uncertainties and the impact of recent tariffs. Market participants will closely analyze the guidance for implications on interest rates and fiscal policy.
📊 Key Data Releases 📊
📅 Wednesday, April 30:
📈 Q1 GDP (8:30 AM ET)
Forecast: 0.3% QoQ
Previous: 2.4%
Initial estimate of U.S. economic growth for Q1, reflecting the early impact of new trade policies.
📈 ADP Employment Report (8:15 AM ET)
Measures private sector employment changes, offering a preview of the official jobs report.
📈 Chicago PMI (9:45 AM ET)
Assesses business conditions in the Chicago area, serving as an indicator of regional economic health.
⚠️ Disclaimer: This information is for educational and informational purposes only and should not be construed as financial advice. Always consult a licensed financial advisor before making investment decisions.
📌 #trading #stockmarket #economy #news #trendtao #charting #technicalanalysis
April 29 Trade Journal & Stock Market AnalysisEOD accountability report: +686.25
Sleep: 8 hour, Overall health: :thumbsup:
Overall a decent day, but signals felt iffy today.
**Daily Trade Signals based on VX Algo System**
— 10:00 AM Market Structure flipped bullish on VX Algo X3!
10:27 AM VXAlgo ES X1 Sell Signal (double signal) :x:
1:08 PM Market Structure flipped bearish on VX Algo X3! :x:
1:51 PM Market Structure flipped bullish on VX Algo X3!
— 2:20 PM VX Algo ES X1 Sell Signal :x:
— 3:38 PM VXAlgo ES X3 Sell Signal (Double signal)
Next day plan--> Over 5470 = Bullish, Under 5470 = Bearish
Video Recap -->https://www.tradingview.com/u/WallSt007/#published-charts

$BMYLooks like price is near a support range dating back between November and February of 2024. If you look at the "throw up" emoji, there was a nice flat down drop in price and since then, it seems like we are at the brink of possibly starting to gas out a bit for some potential relief. They just came off of good earnings to. I'm looking for a target between $49.48 and $49.86 minimum. Price looks like its gassing out the recent move down. Let's see if we get some buyer in the market or if the Bears close some of they positions.

MACD says a little higher for a little longerAs per the individual stocks I cover that have not yet reached their ideal retracement areas I am looking for the SPX to get higher into my target box. In any event it's reasonable for me to say we're in a B wave and therefore our pattern can develop into something more complex. Nonetheless, I am mainly looking for MACD to reach the zero line at the very minimum.
The take-a-way from this update is I am looking slightly higher in the markets for slightly longer...before our minor C wave takes hold of the market.
Best to all.
Chris

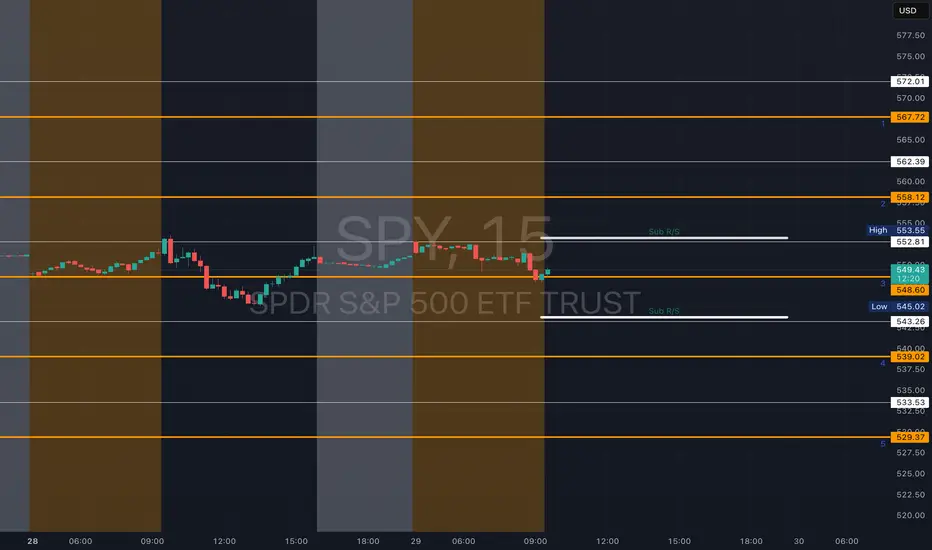
SPY - support & resistant areas for today April 29 2025These are Support and Resistance lines for today, April 29, 2025, and will not be valid for the next day. Mark these in your chart by clicking grab this below.
Yellow Lines: Heavily S/R areas, price action will start when closing in on these.
White Lines: Are SL, TP or Mid Level Support and Resistance Areas, these are traded if consolidation take place on them.
Sub R/S: An Area where price action could happen.