SPY/QQQ Plan Your Trade For 4-29 : BreakAway in CarryoverToday's pattern is a Breakaway in Carryover mode.
That suggests today's price move will attempt to break away from yesterday's body range and may be somewhat similar to yesterday's price action.
I interpret this pattern as a potential breakdown (breakaway) attempting to possibly find support below 540.
Remember, we are moving into the May 2-5 Major Low cycle pattern - so price should attempt to move downward at this stage.
Gold and Silver are moving through a consolidated topping phase. Where price attempts to push higher through a series of tops. Ultimately, I believe Gold and Silver will make a big breakout move higher (above $3500, $35.00) and attempt to rally up - breaking the $4200+ level (eventually).
Bitcoin seems to be stalling, like the SPY/QQQ, near upper resistance (near the FIB 50% level).
I see this stalling as the markets searching for a trend.
As I keep saying, I have a hard time seeing any reason why the markets will rally to new ATHs in the current environment (except the possibility of pure speculation).
We need to see some real growth expectations for the markets to begin another big rally phase.
Right now, I'm looking for confirmation of my breakdown into the May 2-5 Major Bottom pattern. Let's see if that actually happens or not.
Get some.
#trading #research #investing #tradingalgos #tradingsignals #cycles #fibonacci #elliotwave #modelingsystems #stocks #bitcoin #btcusd #cryptos #spy #gold #nq #investing #trading #spytrading #spymarket #tradingmarket #stockmarket #silver
SPDR S&P 500 ETF (SPY)

April 28 Trade Journal & Stock Market AnalysisEOD accountability report: +1228
Sleep: 8 hour, Overall health: :thumbsup:
Signals were pretty on point today, almost all of them worked out effectively, I mainly use the signals to guide my direction and 20pt stoploss to prevent the position from blowing up.
**Daily Trade Signals based on VX Algo System**
— 9:30 AM VXAlgo ES X1 Sell Signal, (B+ Set up, triple sell)
10:30 AM Market Structure flipped bearish on VX Algo X3!
12:35 PM VXAlgo ES X1 Buy signal (Double signal)
— 2:00 PM VXAlgo NQ X3 Buy Signal
2:30 PM Market Structure flipped bullish on VX Algo X3!
Next day plan--> Over 5470 = Bullish, Under 5470 = Bearish
Video Recap -->https://www.tradingview.com/u/WallSt007/#published-charts

Trading the Impulse Rally Retracement — Price and Time Symmetry Fundamental —
Trend is observed from an impulse run’s lowest/highest point and projected outwards in symmetrical fibonacci retracement via price/time from the first reversal candle to the end of the rally, creating crosshairs. These ‘crosshairs’ visually represent the trending ‘price distribution projection’ in price/time symmetry.
Using this concept, I draw a ‘projection trend line’ from the bottom or top of the impulse run thru the projected 78.6% price/time retracement value, to identify the price distribution structure in a linear form.
Now to introduce my STOP LOSS TRIANGLE.
This is a concept of decaying price and time as an underlying move towards our theoretical projection, where if the underlying enters our built faded cross-section, the SL is triggered to avoid sideways consolidation and decaying contract premiums.
This ‘right’ triangle that is ‘sclene’ by nature is created by taking the furthest projection in price/time symmetry (78.6%) and drawing a vertically placed straight line to the highest/lowest point in the rally previously identified. Here, I create a ‘right triangle’ by turning 90 degrees towards my final point, which is made by the nearest projection in price/time symmetry (38.2%). In its entirety, this forms the stop loss triangle

Nightly $SPY / $SPX Scenarios for April 29, 2025🔮 Nightly AMEX:SPY / SP:SPX Scenarios for April 29, 2025 🔮
🌍 Market-Moving News 🌍
🇺🇸 Anticipation Builds for Key Economic Data: Investors are on edge as they await a series of critical economic reports this week, including GDP growth figures and the April jobs report. Concerns are mounting that recent tariff policies may have begun to weigh on economic performance, with forecasts suggesting a significant slowdown in growth.
💼 Earnings Season in Full Swing: Major corporations are set to report earnings today, including AstraZeneca, Honeywell, Regeneron, PayPal, PACCAR, Kraft Heinz, Ares Capital, SoFi, Zebra Technologies, Incyte, Repligen, and Commvault. Investors will be closely monitoring these reports for insights into how companies are navigating the current economic landscape.
📉 Market Volatility Persists Amid Trade Tensions: The stock market continues to experience volatility as investors grapple with the implications of ongoing trade disputes and tariff implementations. Analysts warn that prolonged trade tensions could further dampen economic growth and corporate profitability.
📊 Key Data Releases 📊
📅 Tuesday, April 29:
📦 Advance Economic Indicators (8:30 AM ET):
Includes data on international trade in goods, wholesale inventories, and retail inventories for March. These figures provide early insights into trade balances and inventory levels, which are critical for assessing economic momentum.
📊 Consumer Confidence Index (10:00 AM ET):
Measures consumer sentiment regarding current and future economic conditions. A decline in confidence could signal reduced consumer spending, impacting overall economic growth.
💼 JOLTS Job Openings (10:00 AM ET):
Reports the number of job openings, indicating labor market demand. This data helps assess the health of the job market and potential wage pressures.
⚠️ Disclaimer: This information is for educational and informational purposes only and should not be construed as financial advice. Always consult a licensed financial advisor before making investment decisions.
📌 #trading #stockmarket #economy #news #trendtao #charting #technicalanalysis

Bull in a China Shop. The S&P 500 Index After 100 Days of TrumpPresident Donald Trump's first 100 days in office were the worst for the stock market in any postwar four-year U.S. presidential cycle since the 1970s.
The S&P 500's 7.9% drop from Trump's inauguration on Jan. 20 to the close on April 25 is the second-worst first 100 days since President Richard Nixon's second term.
Nixon, after taking office as President of the United States (for the second time) on January 20, 1973, witnessed the S&P 500 index fall by 9.9% in his first 100 days in office, due to the unsuccessful economic measures he took to combat inflation, which led to the recession of 1973-1975 when the S&P 500 index losses of nearly to 50 percent.
It all started in January 1973 in the best soap opera traditions of Wall Street, at the historical peaks of the S&P 500 index..
..But less than two years later it quickly grew into a Western with a good dose of Horror, because the scenario of a 2-fold reduction of the S&P 500 index was unheard those times for financial tycoons and ordinary onlookers on the street, since the Great Depression of the 1930s, that is, for the entire post-war time span since World War II ended, or almost for forty years.
Nixon later resigned in 1974 amid the Watergate scandal.
On average, the S&P 500 rises 2.1% in the first 100 days of any president's term, according to CFRA, based on data from election years 1944 through 2020.
The severity of the stock market slide early in Trump's presidency stands in stark contrast to the initial "The Future is Bright as Never" euphoria following his election victory in November, when the S&P 500 jumped to all-time highs on the belief that Mr. Trump would shake off the clouds, end the war in Ukraine overnight, and deliver long-awaited tax cuts and deregulation.
Growth slowed and then, alas, plummeted as Trump used his first days in office to push other campaign promises that investors took less seriously, notably an aggressive approach to trade that many fear will fuel inflation and push the U.S. into recession.
The S&P 500 fell sharply in April, losing 10% in just two days and briefly entering a bear market after Trump announced “reciprocal” tariffs, amid a national emergency that gave him free rein to push through tariffs without congressional oversight.
Then Trump began yanking the tariff switch back and forth, reversing part of that tariff decision and giving countries a 90-day window to renegotiate, calming some investor fears.
Many fear more downside is ahead.
Everyone is looking for a bottom. But it could just be a bear market rally, a short-term bounce of sorts.
And it's not certain that we're out of the woods yet, given the lack of clarity and ongoing uncertainty in Washington.
Time will tell only...
--
Best 'China shop' wishes,
@PandorraResearch Team

SPY/QQQ Plan Your Trade Update : Playing Into The Major BottomThis update highlights what I believe will be the last level of defense for price (support) on the SPY and why it is so important to HEDGE the markets right now.
The upward price move has reached the ULTIMATE HIGH (I believe) and is now moving into a Bullish EPP pattern (shifting into the downward pullback, then it will move into the flagging phase).
This flagging phase will be the deciding move (IMO) related to IF the markets attempt to break upward or downward near the current Fib 50% level.
This is why it is so important to HEDGE all open positions right now.
This battle zone in the markets (near the Fib 50% level) is not a guaranteed move higher or lower. Basically, we are watching the battle take place in live trading.
What we can do is try to rely on the EPP patterns and other formations to help guide us to the highest probable outcome, but we have to stay liquid and fluid as the markets trend.
Right now, I would suggest the breakdown (Major Low) outcome is about 70-80% likely. Thus, the breakaway (upside) outcome may be 20-30% likely based on my analysis.
But that could change if the SPY moves above $555.
Thank you again for all the great comments. I'm trying to help as many traders as I can. But this move to the 50% level is very "indecisive". So, I'm having to rely on Fibonacci Price Theory and other techniques (money management/HEDGING) as a way to protect my capital while I trade.
This is a great example of how you can learn techniques (beyond technical analysis) related to what to do when you really don't know what the markets may do in the near future.
The answer is HEDGE ACTIVE POSITIONS - or pull trades off (even if they are at a loss) and then HEDGE whatever you want to keep active.
No one is going to laugh when you tell them, "I protected my capital by hedging last week" when they are looking at severe losses and you are NOT looking as severe losses.
It is SMART TRADING.
Get some.
#trading #research #investing #tradingalgos #tradingsignals #cycles #fibonacci #elliotwave #modelingsystems #stocks #bitcoin #btcusd #cryptos #spy #gold #nq #investing #trading #spytrading #spymarket #tradingmarket #stockmarket #silver

S&P 500 correction before the global fall.S&P 500 correction before the global fall of the usa stock market.
Hey traders! I’m sure many of you have noticed that after the introduction of retaliatory tariffs, the markets started getting pretty choppy.
The S&P 500 took a serious dive.
• On the weekly chart, I’ve marked a support level + the 161.8% Fibonacci level, where we might see a bounce back to the $5680–$5800 range.
• But from there, I think we could see the start of a major crash—both in equities and crypto—that could last 1–2 years.
• Based on my estimates, the S&P 500 could drop back to 2020–2021 levels, a wide range of 2200–3000.
• For Bitcoin, we’re talking around $5000; for Ethereum, $100–$300; and for Solana, $2–$12.
3D Chart:
3W Chart:
Real-world events that could tank the stock market this hard:
Global Recession: If major economies (US, China, EU) slide into a recession at the same time—think trade wars, rampant inflation, or a debt crisis—investors will dump risky assets like hot potatoes.
Trade War Escalation: Harsher tariffs between the US and China/EU could wreck supply chains, crush corporate earnings, and spark a full-on market panic.
Geopolitical Conflict: A big blow-up—like a full-scale war or crisis (say, Taiwan or the Middle East)—could send capital fleeing to safe havens (gold, bonds), while stocks and crypto get slaughtered.
Collapse of a Major Financial Player: If a big bank or hedge fund goes bust (Lehman Brothers 2.0-style) due to an overheated market or bad debt, it could trigger a domino effect.
Energy Crisis: A spike in oil/gas prices (from sanctions or conflicts, for example) could kneecap the economy and drag risk assets down with it.
Market Bubble Burst: If the current rally turns out to be a massive bubble (and plenty of folks think it is), its pop could pull indexes down all on its own.
Looming Wars: A potential Russia-Europe war starting as early as 2025, or an Iran-Israel conflict that drags in multiple nations, could destabilize global markets, spike energy prices, and send investors running for the exits.

$SPY bear flag target between $387-443AMEX:SPY has been consolidating in a bear flag since April 7th. Should we break down from the flag, I can see a sharp move down to the lower support levels.
I think the most likely targets are at $443 and $409. However, it's possible we can find support at the other targets as well.
I think the move likely plays out before June. Let's see where we end up bouncing.
Invalidation of the downside would be a break over $567.

SPY Green Light to All Time Highs?As VIX is sitting around 25, this is the first Monday in I can't remember how long we aren't gapping down at open! I'll take it! There is a ton on the calendar this week: jobs, first print for Q1 GDP, PCE, ISM mfg, and a ton of consequential earnings! Not to mention will we get a couple deals announced this week. Feels like India, UK and Japan are close. This could spur a market rally to continue! Did a ton of work on Elliott this weekend, but didn't create a video. Essentially, since we closed in the wave 1 of the red C leg (on daily and weekly basis), we have invalidated a chance of a fifth leg lower (thank God!). This means we are in first impulsive intermediate 5 wave that should go to all time highs (next Apr)! Since we already have two minute impulsive waves that were similar in size, we likely will finish the minor wave 3 as pictured and then since 1 & 3 of minor waves will be similar in size the impulsive 5 wave target will be as pictured as well. Remember it is simply the net of waves 1 through 3 times 0.618 and add that to the finish of wave 4 in either case. After wave 3, we will get a pullback, but this will be a buy the dip opportunity finishing the 5th wave around 580ish. After this we will get a deeper corrective wave but if sentiment is positive it may be shallow, only 38% to 50%, so will want to re-evaluate at that point! This is why it is important if you are investing not to FOMO, as there will be many opportunities to buy the dip!

SPY/QQQ Plan Your Trade For 4-28 : Inside Breakaway In TRENDToday's Inside Breakaway pattern in Trend mode suggests the SPY will attempt to break away from Friday's body range. The Weekly Bias turned to BULLISH last week.
I believe today's price move will be indicative of the rest of the week. We are moving into a very strong Major CRUSH pattern on Friday and I believe that pattern will be a big breakdown move in price.
Thus, I believe the early trading this week (today and tomorrow) will set the tone for the rest of the week.
If we see a rotation in price near the 550 level (to the downside) then my May Low pattern will likely transition into a price breakdown this week.
If we see more upside price action on Monday/Tuesday, then I would be very cautious of the end of this week as a sudden price breakdown may happen.
Gold and Silver will likely stay very muted for the next two trading days. The Canadian Elections will likely cause the US to briefly pause as one of our closest neighbors and trading partners moves through this pivotal election.
Bitcoin will also likely pause a bit in early trading this week and BTCUSD moves up to the $95-96k upper resistance area.
I suggest traders take advantage of this pause in price action to HEDGE their open positions. I believe the bigger move is still to the downside, but I also believe the markets could continue to push a bit higher before ROLLING into that May 2-5 Major Bottom.
At this point, near the 50% Fib retracement level, the markets could break in either direction. But I still believe the May 2-5 Major Bottom will play out as a unique lower low price level - below $525-530 on the SPY.
Get some.
#trading #research #investing #tradingalgos #tradingsignals #cycles #fibonacci #elliotwave #modelingsystems #stocks #bitcoin #btcusd #cryptos #spy #gold #nq #investing #trading #spytrading #spymarket #tradingmarket #stockmarket #silver

3 Oversold Stocks Poised for a Rally – MAS, IQV & TMOBelow is today’s SmartApingAI snapshot of three highly oversold names showing early signs of a rebound. Scroll down for a quick refresher on each company’s fundamentals, key technicals, and what makes them attractive at current levels.
1. Masco Corp ( NYSE:MAS )
What They Do:
Masco designs, manufactures and sells a broad range of home-improvement and new-construction products, including faucets, cabinets, hardware, coatings and architectural products.
Customers:
• Homeowners tackling renovation projects
• Professional contractors and builders
Income Source:
Primarily through the sale of mid-range to premium fixtures, cabinetry systems and paint/coatings.
Geographic Footprint:
• ~85% North America
• ~15% Europe
Product Pricing:
Mid-range to premium, with strong brand recognition in kitchen and bath fixtures.
SmartAping AI Model Target Price:
$81.36
Technical Snapshot:
• Broke below—and then bounced off—the $57 weekly support zone
• Now trading at $60.42, up from the intra-week low
• WiseStrat Macro ASI: deeply oversold at –120, turning bullish
• WiseStrat Micro ASI: still bearish, suggesting cautious position sizing
Why Watch:
Home-improvement spending has held up despite moderating housing starts, and MAS’s disciplined balance sheet and dividend yield (~2%) make it a compelling recovery play if consumer confidence picks up.
2. IQVIA Holdings Inc ( NYSE:IQV )
What They Do:
IQVIA provides data analytics, research services and technology solutions that power clinical trials, market research and real-world evidence for the life-sciences industry.
Customers:
• Pharma and biotech firms
• Medical device companies
• Healthcare providers and payers
Income Source:
Subscription and project-based fees for data platforms, consulting and trial execution services.
Geographic Footprint:
• 50% Americas
• 30% EMEA (Europe, Middle East & Africa)
• 20% Asia-Pacific
Product Pricing:
Variable, tailored to project scope—from high-volume data subscriptions to multi-million-dollar trial outsourcing contracts.
SmartAping AI Model Target Price:
$275.35
Technical Snapshot:
• Dropped below the $137 weekly support last week, then staged a relief rally
• Currently at $150.28
• WiseStrat Macro ASI: extremely oversold at –127, now in bullish reversal mode
• WiseStrat Micro ASI: turning positive, hinting at building short-term momentum
Why Watch:
With global R&D spend on track to exceed $250 billion this year, IQVIA’s blend of analytics and CRO services is in high demand. A seasonal uptick in trial starts could catalyze upside toward our $275 target.
3. Thermo Fisher Scientific Inc ( NYSE:TMO )
What They Do:
Thermo Fisher supplies scientific instruments, reagents and software used in research, diagnostics, manufacturing and safety testing across life-sciences and industrial markets.
Customers:
• Academic, government and corporate research labs
• Clinical and diagnostic facilities
• Biopharma manufacturers
Income Source:
Sales of equipment (from a few hundred to multi-million dollars), consumables, and service contracts.
Geographic Footprint:
• ~50% North America
• ~30% Europe
• ~20% Asia-Pacific & other
Product Pricing:
Ranges widely: entry-level lab kits to high-end sequencers and complete lab automation lines.
SmartAping AI Model Target Price:
$645.83
Technical Snapshot:
• Tested and held the $412.73 weekly support last week, bouncing back to $424.24
• WiseStrat Macro ASI: oversold at –129, now showing bullish tilt
• WiseStrat Micro ASI: still negative, cautioning potential retest of $412
Why Watch:
Strong long-term secular drivers—gene therapy, personalized medicine and diagnostics—remain intact. A washout in biotech funding fears has left TMO trading at a rare discount to growth peers.

$SPX Sell in May, Go Away, $5k, Dead Cat to $5.3k, $4.8k by EOMAlrighty. My forecast is as follows. I made a video explaining just a quick thought and here's the video in a written version for the most part. Basically, I'm a pattern chart trader and I spend the majority of my days looking for specific candlestick patterns that match candle for candle. I cannot find anything remotely close to today's Price Action besides October 2001. I have been and will continue to be doubted and that's okay. I am not here for anyone except myself and anyone that wants to gain a fresh unbiased perspective. People have called me a Permabear but that only pertains to my personality, which is that of a realist. I do not believe investing for the next 20-50 Years will work for everyone. You'd have to do it well and continuously contribute even during the down days. Either way. This is the analog I will be following. Fib is Extended way beyond Blow Off Top measurements imo. The market gained 50% in One Year and Three Months. I'd like to think that the uncertainty being priced in will cause these Deeper Fib Retracements. We already crashed down to the 1.61 GOLDEN POCKET from above and now bounce back to Secon Golden Pocket at 2.61. Based on the past behavior, now we move back to 2.0 for a move to the original extension of the 1.00 Fib. If we lose this, we start moving back to the 1.27 near $4.74k on SPX where I will then be looking for one final dead cat to $5300 by mid August, Every July dip being grabbed up ... Final Sell in August for an End of Year Crash to Mark 2025 as one of the worst years ever in Life as far as the Market goes. Good Luck everyone. Tips always welcome.

Weekly $SPY / $SPX Scenarios for April 28 – May 2, 2025🔮 🔮
🌍 Market-Moving News 🌍
🇺🇸 President Trump's 100th Day in Office: Wednesday marks President Trump's 100th day of his second term. His administration's protectionist tariffs continue to influence global markets and political landscapes, with notable impacts observed in Canada, Australia, and the UK.
📉 Trade Tensions and Economic Indicators: Investors are closely monitoring the effects of recent U.S. tariffs on economic performance. Key data releases this week, including GDP and employment figures, will provide insights into the economy's resilience amid these trade policies.
💼 Major Corporate Earnings: This week features earnings reports from major companies, including Apple, Amazon, Microsoft, Meta Platforms, ExxonMobil, and McDonald's. These reports will offer a glimpse into how large corporations are navigating current economic challenges.
📊 Key Data Releases 📊
📅 Monday, April 28:
🏠 Housing Vacancies and Homeownership (10:00 AM ET):
Provides data on rental and homeowner vacancy rates, offering insights into housing market dynamics.
📅 Tuesday, April 29:
📈 Advance Economic Indicators (8:30 AM ET):
Includes data on international trade in goods, wholesale inventories, and retail inventories for March.
📊 Consumer Confidence Index (10:00 AM ET):
Measures consumer sentiment regarding current and future economic conditions.
💼 JOLTS Job Openings (10:00 AM ET):
Reports the number of job openings, indicating labor market demand.
📅 Wednesday, April 30:
📈 GDP (Q1 Advance Estimate) (8:30 AM ET):
Provides an early estimate of economic growth for the first quarter.
💳 Personal Income and Outlays (10:00 AM ET):
Includes data on personal income, consumer spending, and the PCE price index, the Fed's preferred inflation measure.
🏭 Chicago PMI (9:45 AM ET):
Assesses business conditions in the Chicago region, reflecting manufacturing sector health.
📅 Thursday, May 1:
🏗️ Construction Spending (10:00 AM ET):
Reports total spending on construction projects, indicating economic activity in the sector.
📉 Initial Jobless Claims (8:30 AM ET):
Measures the number of new filings for unemployment benefits, reflecting labor market
conditions.
🏭 ISM Manufacturing PMI (10:00 AM ET):
Provides insight into the manufacturing sector's health through a survey of purchasing managers.
📅 Friday, May 2:
👷 Nonfarm Payrolls (8:30 AM ET):
Reports the number of jobs added or lost in the economy, excluding the farming sector.
📉 Unemployment Rate (8:30 AM ET):
Indicates the percentage of the labor force that is unemployed and actively seeking
employment.
🏭 Factory Orders (10:00 AM ET):
Measures the dollar level of new orders for both durable and nondurable goods, indicating manufacturing activity.
⚠️ Disclaimer: This information is for educational and informational purposes only and should not be construed as financial advice. Always consult a licensed financial advisor before making investment decisions.
📌 #trading #stockmarket #economy #news #trendtao #charting #technicalanalysis


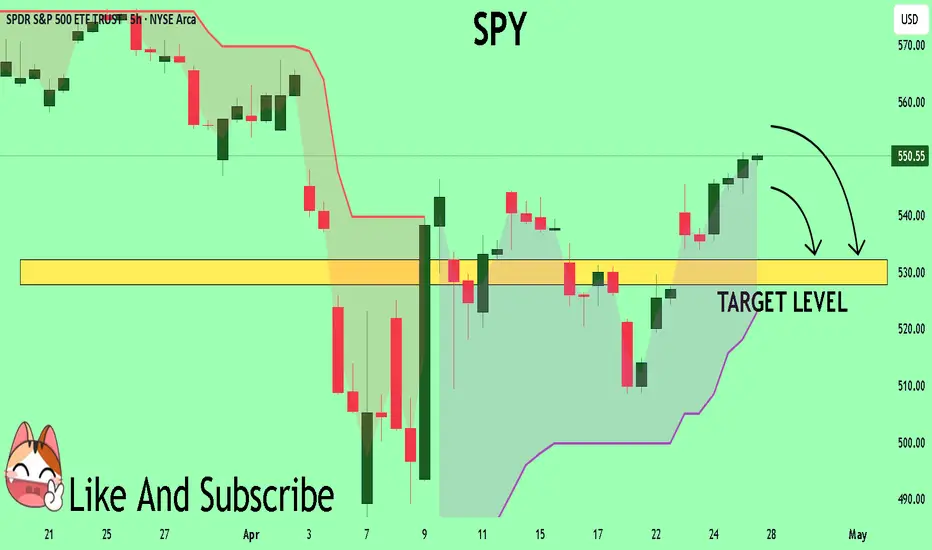
SPY Buyers In Panic! SELL!
My dear subscribers,
This is my opinion on the SPY next move:
The instrument tests an important psychological level 550.55
Bias - Bearish
Technical Indicators: Supper Trend gives a precise Bearish signal, while Pivot Point HL predicts price changes and potential reversals in the market.
Target - 532.22
About Used Indicators:
On the subsequent day, trading above the pivot point is thought to indicate ongoing bullish sentiment, while trading below the pivot point indicates bearish sentiment.
Disclosure: I am part of Trade Nation's Influencer program and receive a monthly fee for using their TradingView charts in my analysis.
———————————
WISH YOU ALL LUCK
I SPY an opportunity to riseThe "macro" environment has an extreme bearish tone. There is a great deal of uncertainty still. So let's look to the charts to see what's the deal. Monday morning was a spill over from Trump's tantrums and we bounced at the end of the day Monday with a wick. Interesting note... big tech earnings was beginning. What a perfect time to see some rise on the charts.
NFLX already had us anticipating some positive movement b/c of their Good Friday earnings. So most people were focused on the play of 1000-1100. So many people took a position.
Back to SPY... Trump stated after hours after during TSLAs awful earnings call that he was not going to fire JPowell and TSLA began rallying as well as other big tech companies (interesting). The rallies held overnight. There were selloffs after the earnings, creating HL (higher lows) that held across many charts. The week proceeded and we slowly rose the rest of the week.
I'm recalling that Trump initiated a 90 day pause. & though their is still negative chatter and uncertainty with the final outcome; it's enough to have bullish thoughts for the remainder of the earnings season (esp big tech and major companies) while we chop.
Cautiously viewing the charts one day at a time; watching for candlestick patterns to assist with plays. If the pattern is bullish, looking for a bullish play. if the pattern is bearish, looking for a bearish play. Or... just pick a side and wait for what you connect to. My notes on candle recognition below over the next week will be below.
Tootles

S&P 500 E-mini Futures: Bullish Momentum Meets Key Resistance📈 Technical Analysis: S&P 500 E-mini Futures (ES1!) – April 2025
🚀 Market Structure & Price Action for US500
The daily chart shows the S&P 500 E-mini Futures in a bullish recovery after a significant correction. The recent rally has pushed price back toward previous swing highs, an area likely to contain resting buy-side liquidity. This move suggests that the market is currently in a markup phase, but is now approaching a critical resistance zone where profit-taking and counter-trend activity may emerge.
🧠 Wyckoff Perspective
From a Wyckoff methodology standpoint, the recent price action resembles a classic accumulation-to-markup transition. The sharp selloff in March and early April appears to have formed a selling climax (SC) followed by an automatic rally (AR) and a secondary test (ST). The current advance could be interpreted as a sign of strength (SOS), but the proximity to previous highs raises the risk of an upthrust (UTAD) or a bull trap if supply emerges.
🌊 Liquidity & Potential Pullback
As price trades into the prior highs, it is likely "eating" buy-side liquidity—triggering stops and breakout orders. This process often leads to a liquidity sweep, where price briefly exceeds resistance before reversing as large players offload positions. If the market fails to sustain above these highs, a pullback or even a reversal could be initiated, especially if volume and momentum wane.
🌐 Market Sentiment & Fundamentals
Current sentiment remains cautiously optimistic, with the S&P 500 E-mini trading above 5,500 and recent sessions showing resilience despite mixed earnings and macroeconomic uncertainty. The broader market is supported by expectations of stable Fed policy and robust corporate earnings, but there are persistent concerns about inflation and global growth. According to Markets Insider, the ES futures are up 0.59% recently, reflecting a positive but not euphoric tone. However, as noted by Investing.com, there are signs the market could be setting up for a reversal if bulls fail to maintain momentum.
🛠️ Trade Ideas
🟢 Bullish Scenario: If price breaks and holds above the previous highs with strong volume and closes, consider a long entry targeting the next psychological resistance (e.g., 5,700–5,800). Place stops just below the breakout level to manage risk. This would confirm continued demand and a potential extension of the markup phase.
🔴 Bearish Scenario: If price fails to hold above the highs and forms a reversal pattern (e.g., bearish engulfing, upthrust), look for a short entry targeting the first support zone (e.g., 5,300–5,200). Stops should be placed above the failed breakout. This would align with a Wyckoff upthrust after distribution and a likely liquidity sweep.
⚠️ Disclaimer
This analysis is for informational purposes only and does not constitute financial advice. Trading futures involves significant risk and may not be suitable for all investors. Please conduct your own research and consult with a licensed financial advisor before making any trading decisions.

S&P 500 - Key Levels and Measurements (Bonds vs Yields vs Homes)Happy Friday!!!
Starting with a BLANK chart, here are my key levels and measurements for the S&P 500
Earnings season is stable, more MAG 7 next week with AAPL, AMZN, META, MSFT
Trump and Company are softening the trade war narrative quickly and the market
is taking notice. Prices recovered nicely this week
5500 SPX is a key level for the bulls to push above - if done look for open space
melt-up into 5700-5800 resistance
If SPX rejects 5500 early next week we will be dealing with some more noise
and intermediate levels
4830 lows will be absolutely critical to maintaining a long-term bull market. You will
see why with this analysis.
Last piece is talking about bonds vs yields and the current housing market in the US
My belief is that yields stay sticky and home prices MUST drop to see any improvements
in affordability
Thanks for watching - have a great weekend!!!

𝗧𝗲𝘀𝗹𝗮 𝗕𝗿𝗲𝗮𝗱𝗸𝗼𝘄𝗻: Priced for perfectionPriced for perfection in an imperfect market
NASDAQ:TSLA nearly hit its 200dma and key resistance area (~288–292) after a roughly 20% post-earnings squeeze, and as long as it stays below that level, it risks retesting the long-term uptrend line that has marked major lows twice since COVID.
𝘛𝘢𝘳𝘪𝘧𝘧 𝘢𝘯𝘥 𝘴𝘶𝘱𝘱𝘭𝘺-𝘤𝘩𝘢𝘪𝘯 𝘳𝘪𝘴𝘬: Tesla depends heavily on Chinese-made battery and electronic components now hit by reciprocal U.S. tariffs, while over 60% of global neodymium and dysprosium—vital for its EV motors—are mined and processed only in China, creating a critical bottleneck that could sharply elevate its input costs.
𝘔𝘢𝘳𝘨𝘪𝘯 𝘱𝘳𝘦𝘴𝘴𝘶𝘳𝘦 𝘷𝘴. 𝘭𝘰𝘧𝘵𝘺 𝘷𝘢𝘭𝘶𝘢𝘵𝘪𝘰𝘯: Q1 price cuts of up to 20% on core models drove Tesla’s auto gross margin to its lowest since 2020, calling into question the sustainability of its >70× forward P/E multiple, which assumes exceptionally high profits from future ventures like robotics and autonomous fleets.
$NQ_F NASDAQ:NDX NASDAQ:QQQ NASDAQ:AMZN NASDAQ:META NASDAQ:NVDA NASDAQ:SOX $ES_F AMEX:SPY SP:SPX TVC:DXY NASDAQ:TLT TVC:TNX TVC:VIX #Stocks #TrumpTariffs 🇺🇸 #ChinaTariffs 🇨🇳

Move index saw a140 level this is a Panic short term bottom ONLYThe spreads loved like a failure was near ! So the move index reached a short term bottom Only in the High yield market so now everyone things it is safe to jump back to RISK ON . This is what we see in BEAR MARKETS sharp strong up thrusts to be followed By longer declines .Best of trades WAVETIMER . NOT A NEW BULL MARKET TRADERS

ORB Breakout PullbackWaiting for SPY to break my 15 min ORB on the 5 and/or 15 min time-frame then I'll enter on pullback if it holds, especially if it hold at the 9 EMA, Volume supports and the VIX is inline as well. If VIX up SPY down and vice versa. Also, will confirm on 30 min timeframe for more confirmation. Let's see. Patience is key.

Opening (IRA): SPY June 20th 375 Short Put... for a 3.74 credit
Comments: High IVR/>21 IV. Starting to ladder out here, targeting the strike paying around 1% of the strike price in credit.
Will generally look to roll up at 50% max to the strike paying around 1% of the strike price in credit if >45 DTE remain in the expiry and IVR/IV remains sufficient to collect 1% of the strike price in credit at 16 delta or less.

Opening (IRA): SPY May 16th 385 Short Put... for a 4.04 credit.
Comments: High IVR, >21 IV. Sticking a little pickle in here, targeting the strike paying around 1% of the strike price in credit which is quite a bit out of the money at the 8 delta.
Metrics:
Buying Power Effect/Break Even: 380.96
Max Profit: 4.04
ROC at Max: 1.06%
50% Max: 2.02
ROC at 50% Max: .54%
