$QQQ Things looking Grim for the next week - $450 ExtremeWell... I've done my absolute best to figure this out... I have my bearish outlook, although I will post another to add to this, as the bar pattern can extend much lower. Bounce regardless, after 3/14, says most of the charts I have.
SPDR S&P 500 ETF (SPY)

US Technology Sector Futures. The Heartbreak HotelPresident Donald Trump's tariffs on imported tech goods, targeting China, the EU, Canada, and Mexico, are reshaping the U.S. technology sector through higher costs, supply chain disruptions, and retaliatory trade risks. While intended to boost domestic manufacturing and reduce trade deficits, these measures are creating immediate economic strain across critical industries. Below is an analysis of their key negative impacts:
Rising Consumer Prices and Hardware Costs
The 25% tariff on EU semiconductors, 10% levy on Chinese goods, and 25% duties on Canadian/Mexican imports are projected to add $50 billion in new costs to North American tech supply chains. This directly affects consumer electronics:
Smartphones and laptops. Apple’s iPhone production in China exposes it to 10% tariffs, likely forcing U.S. price hikes.
Semiconductors. The U.S. relies on China and Taiwan for 80% of 20-45nm chips and 70% of 50-180nm chips, with tariffs disrupting access to essential components.
Cloud/AI infrastructure. Steel and aluminum tariffs (25%) increase data center construction costs, potentially raising prices for AWS, Google Cloud, and Microsoft Azure services.
Experts warn companies may pass 60-100% of tariff costs to consumers rather than absorb profit losses.
Supply Chain Disruptions and North American Integration
The tariffs jeopardize tightly integrated North American production networks:
Cross-border dependencies. Components often cross U.S.-Mexico or U.S.-Canada borders multiple times during manufacturing. Christine McDaniel of the Mercatus Center notes this integration means tariffs “hurt the pricing power of the U.S.” by inflating domestic costs.
Critical material shortages. Canada supplies nickel and cobalt for batteries, while Mexico handles assembly for firms like Foxconn. Tariffs risk delays and renegotiations with suppliers.
Retaliatory measures. The EU may respond with fines or trade barriers against U.S. tech giants like Apple and Google, escalating tensions.
Sector-Specific Challenges
Semiconductors and Hardware
Chip shortages. With limited domestic foundry capacity, tariffs on EU semiconductors threaten AI development and device manufacturing.
Networking equipment. Proposed 10% tariffs on Chinese-made routers and modems could disrupt cloud providers reliant on these components.
Data Centers and AI
Construction delays. Steel/aluminum tariffs increase costs for server racks and cooling systems, potentially delaying $80 billion in planned U.S. data center investments.
AI infrastructure. Projects like the $500 billion Stargate initiative face higher expenses for imported components, slowing AI adoption.
Macroeconomic Risks
Trade deficit growth. Despite tariffs aiming to reduce the $1 trillion U.S. goods trade deficit, S&P Global warns retaliatory Chinese tariffs could worsen imbalances.
Job losses. Economic modeling suggests tariffs may cost 125,000+ U.S. tech jobs through reduced consumer spending and IT budget cuts.
Innovation slowdown. While firms like TSMC and Intel accelerate U.S. fab construction, short-term supply chain reallocations divert R&D funding.
Corporate Responses and Limitations
Some companies are attempting mitigation strategies:
Stockpiling. NVIDIA and AMD are urging partners to increase pre-tariff production.
Domestic shifts. Apple plans $500 billion in U.S. manufacturing, while TSMC pledged $160 billion for stateside fabs.
However, these efforts face scalability issues. Building advanced chip foundries takes 3-5 years, leaving gaps in critical components. Meanwhile, 65% of IT firms report difficulty finding tariff-free alternatives for Chinese inputs.
Technical challenge
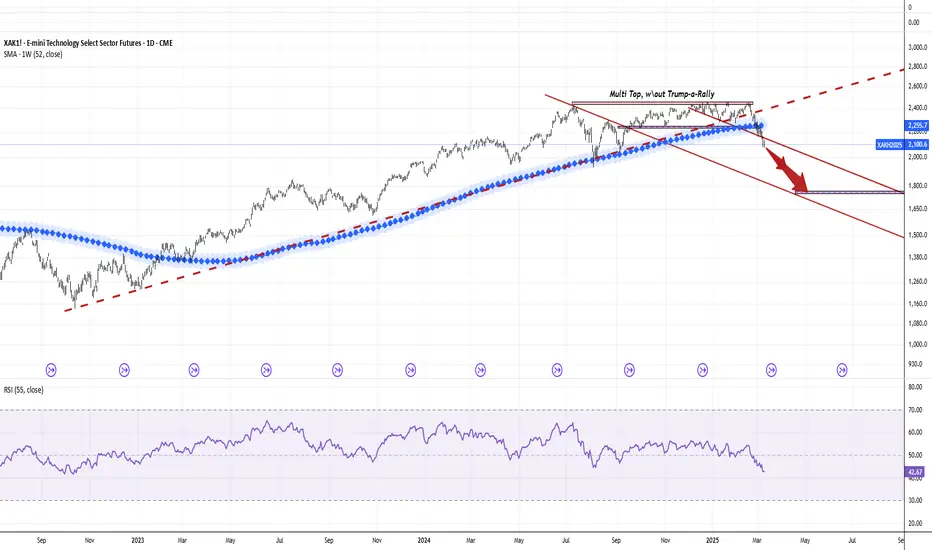
The main technical graph for US Technology Select Sector Futures CME_MINI:XAK1! (CME Group mode of AMEX:XLK - SPDR Select Sector Fund - S&P500 Technology ETF) indicates on further Bearish market in development since major support of 52-week SMA has been broken already, with possible upcoming Bearish cascade effects in the future.
It is also important to note the almost complete absence of a Trump-a-rally in the 2024 holiday quarter, which contributed to the formation of a multi-resistance top.
Conclusion
While the tariffs aim to strengthen U.S. tech autonomy, their immediate effects—higher prices, supply instability, and strained international relations—outweigh potential long-term benefits. With global IT spending still projected to grow 9% in 2025, the sector’s resilience is being tested by policy-driven headwinds that threaten America’s competitive edge in semiconductors, AI, and consumer electronics.
Investing in S&P500 Technology Sector Futures / ETFs seeks to provide precise exposure to companies from technology hardware, storage and peripherals; software; communications equipment; semiconductors and semiconductor equipment; IT services; and electronic equipment, instruments and components industries; allows investors to take strategic or tactical positions at a more targeted level than traditional wide style based investing.
S&P500 Technology Sector Futures / ETFs are designed for investing at a more targeted Technology level, since nearly 50 percent of holdings weight just a five well-known names:
Name Weight
APPLE INC NASDAQ:AAPL 15.61%
MICROSOFT CORP 12.83%
NVIDIA CORP NASDAQ:NVDA 11.91%
BROADCOM INC NASDAQ:AVGO 5.18%
SALESFORCE INC NYSE:CRM 3.11%
--
Best 'Heartbreaking' wishes,
@PandorraResearch Team 😎
SPY/QQQ Plan Your Trade For 3-18-25 : Gap Reversal Counter-TrendFirst off, thank you for all the great comments and feedback. I really love hearing from TradingView subscribers and how my research is helping everyone find success.
Just recently, I received some DMs from viewers saying my research has been "dead on" - which is great.
One thing is for sure, the big move in Gold/Silver is just getting started.
Today's SPY Cycle Pattern is a Gap-Reversal in a Counter Trend mode. The long-term & short-term bias is currently BEARISH - so I believe the GAP Reversal will be to the upside.
Meaning, I suggest we start the day with a mild lower GAP - followed by a moderate price reversal in early trading, leading to a continued melt-up type of trend for the SPY/QQQ
Gold and Silver are likely to attempt to melt a bit higher into the TOP pattern for today. I believe this is just a temporary resistance level for metals.
Bitcoin is struggling to find upward momentum - but I believe BTCUSD still has a $3k-$5k rally left to reach the current Consolidation highs. We'll see if it breaks higher over the next 3-5 days before rolling over into a new downtrend.
Again, I really appreciate all of my followers and viewers. I want all of you to learn to see, read, and understand price action more clearly than ever before.
That's why I don't use any technical indicators on my chart. I want you to understand PRICE is the ultimate indicator.
Get some..
#trading #research #investing #tradingalgos #tradingsignals #cycles #fibonacci #elliotwave #modelingsystems #stocks #bitcoin #btcusd #cryptos #spy #gold #nq #investing #trading #spytrading #spymarket #tradingmarket #stockmarket #silver

Nightly $SPY / $SPX Scenarios for March 18, 2025 🔮 🔮
🌍 Market-Moving News 🌍:
🇺🇸🏛️ Federal Reserve Meeting Commences 🏛️: The Federal Open Market Committee (FOMC) begins its two-day policy meeting on March 18, with a decision on interest rates expected on March 19. While markets anticipate that the Fed will maintain current rates between 4.25% and 4.5%, investors will closely monitor the meeting for any signals regarding future monetary policy directions.
🇨🇳📊 China's Economic Data Release 📊: China is set to release key economic indicators, including retail sales and industrial production figures for February. These data points will offer insights into the health of the world's second-largest economy and could have ripple effects on global markets, including the U.S.
📊 Key Data Releases 📊:
📅 Tuesday, March 18:
🏠 Housing Starts (8:30 AM ET) 🏠:This report measures the number of new residential construction projects begun during the month, providing insight into the housing market's strength.
Forecast: 1.31 million units (annualized)
Previous: 1.34 million units
🏢 Building Permits (8:30 AM ET) 🏢:This data indicates the number of permits issued for new construction projects, serving as a leading indicator for future housing activity.
Forecast: 1.35 million units (annualized)
Previous: 1.36 million units
⚠️ Disclaimer: This information is for educational and informational purposes only and should not be construed as financial advice. Always consult with a professional financial advisor before making investment decisions.⚠️
📌 #trading #stockmarket #economy #news #trendtao #charting #technicalanalysis

The Bigger Picture5300 area still looks like it will be possible sometime next week. I explain the leading diagonal count and why I think another ABC down is likely.

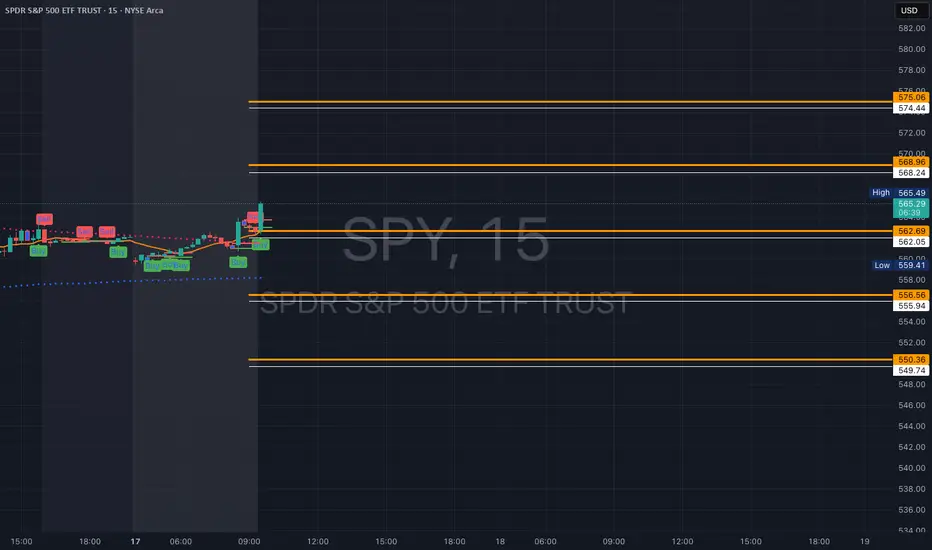
SPY - support & resistant areas for today March 17, 2025The key support and resistance levels for SPY today are above.
Follow me to get this notified when I publish in the morning.
Understanding key levels in trading can provide valuable insights into potential market movements. These levels often indicate where prices might reverse or consolidate, serving as important signals for traders considering long (buy) or short (sell) positions.
Calculated using complex mathematical models, these levels are tailored for today's trading session and may evolve as market conditions change.
If you find this information beneficial and would like to receive these insights every morning at 9:30 AM, I invite you to support me by boosting this post and following me @OnePunchMan91. Your engagement is greatly valued! However, please note that if this post doesn’t receive more than 10 boosts, I will have to reconsider providing these daily updates. Thank you for your support!
Need any other charts daily, comment on this.
SPY/QQQ Plan Your Trade Video for 3-17: GAP PotentialAs we start moving into the Excess Phase Peak pattern consolidation phase, I believe the SPY/QQQ will attempt a moderate rally for about 3-5+ days, then roll into a deep selling mode after March 21-24.
I don't believe we have reached a bottom - yet.
I do see a lot of people talking about "the bottom is in" and I urge all of you to THINK.
What do you believe will be the basis of US and GLOBAL economic growth starting RIGHT NOW?
Can you name one thing that will be the driver of economic expansion and activity?
I can't either.
Thus, I suggest traders prepare for more sideways consolidation range trading over the next 60+ days as hedge assets and currencies attempt to balance risks.
BTCUSD, Gold, Silver should all be fairly quiet this week. I'm not expecting any huge price moves this week.
I expect the SPY/QQQ & BTCUSD to move a bit higher while Gold and Silver melt upward a bit further.
Then, after March 21, I expect bigger volatility and a broad rotation in the SPY/QQQ/Bitcoin where Gold/Silver will start a bigger move higher.
Get some.
#trading #research #investing #tradingalgos #tradingsignals #cycles #fibonacci #elliotwave #modelingsystems #stocks #bitcoin #btcusd #cryptos #spy #gold #nq #investing #trading #spytrading #spymarket #tradingmarket #stockmarket #silver

Markets Open, Guinness Poured—Can SPX Deliver a Perfect Finish?Markets Open, Guinness Poured—Can SPX Deliver a Perfect Finish? | SPX Analysis 17 Mar 2025
SPX feels like it’s stuck on a broken record—a little up, a little down, an occasional intraday yo-yo… and then back to square one. But this time, history might repeat itself—again.
📌 A bullish breakout isn’t off the table, but it needs to clear 5650.
📌 Until then, I’m riding the bear swing lower, watching for a final push.
📌 Friday’s rally took us to the upper range, but futures are hinting at weakness.
I’ve rolled some experimental GEX trades since I’ll be away from the desk Monday, checking in from St. Paddy’s Day festivities.
And if we get one last bearish flush while I’m raising a pint anf splitting the G? Even better. 🍻
Let’s break it down…
---
Deeper Dive Analysis:
At this point, the market feels like a Netflix show that’s dragging out an episode—we know something big is coming, but when?
📌 The Setup – A Familiar Pattern, A Familiar Plan
We’ve seen this before.
SPX is back in the same range, teasing another bearish repeat.
Friday’s rally was nice, but futures are already softening.
ADD is at its bullish extreme—suggesting a drop or more sideways churn.
The question is whether this is just a rerun or the start of something new.
📌 The Trade Plan – Patience Pays… and So Does my Guinness
I’m favouring the bearish move for now because:
✅ I still have an open bear swing that’s in play.
✅ I’ve rolled some Friday GEX trades to extend my duration.
✅ A move lower to 5550/5500 would be ideal for exits.
As for the bullish swing, if it plays out:
✅ I won’t need to take action until Tuesday.
✅ 5650 needs to break, and a clear pullback entry to confirm.
📌 Looking Ahead – Let the Market Come to Me
For now, I’m happy letting the market do its thing while I enjoy my long weekend.
If SPX pushes lower, I’ll cash out and move on.
If it grinds sideways, my positions stay in place.
And if it rallies, I’ll reassess on Tuesday.
Either way, my trades are set, my strategy is solid, and my Guinness is cold. 🍀🍻
---
Fun Fact
📢 Did you know? The New York Stock Exchange was once closed every St. Patrick’s Day—until 1953, when they decided traders probably shouldn’t get an official day off for drinking.
💡 The Lesson? Markets may evolve, but traders will always find a reason to take a break when they can. 🍻

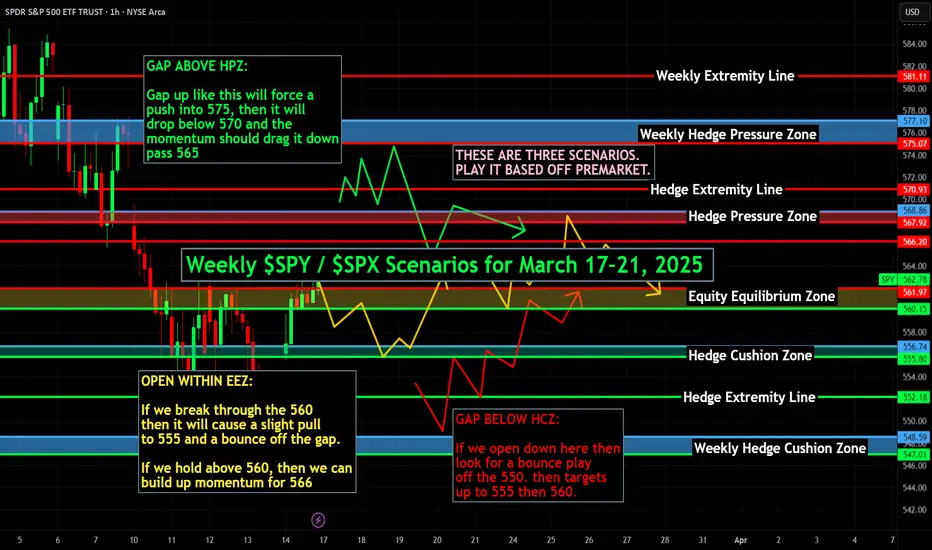
Weekly $SPY / $SPX Scenarios for March 17–21, 2025 🔮 🔮
🌍 Market-Moving News 🌍:
🇺🇸📉 Anticipated Federal Reserve Rate Decision 📉: The Federal Reserve is scheduled to announce its interest rate decision on Wednesday, March 19. Markets widely expect the Fed to maintain the current rates between 4.25% and 4.5%, following favorable inflation data. Investors will closely analyze the Fed's quarterly economic projections and Chair Jerome Powell's remarks for insights into future monetary policy.
🇨🇳📈 China's Economic Stimulus Measures 📈: China has announced plans to implement measures aimed at reviving domestic consumption. This initiative is expected to bolster global markets, including the U.S., as increased Chinese consumption can lead to higher demand for international goods and services.
🇯🇵🏦 Bank of Japan's Monetary Policy Decision 🏦: The Bank of Japan is set to announce its interest rate decision on March 20. While specific expectations are not detailed, any changes or guidance provided could have implications for global financial markets, including currency and equity markets.
📊 Key Data Releases 📊:
📅 Monday, March 17:
🛒 Retail Sales (8:30 AM ET) 🛒:This report measures the total receipts of retail stores, providing insight into consumer spending trends.
Forecast: +0.2% month-over-month
Previous: +0.3% month-over-month
📅 Wednesday, March 19:
🏠 Existing Home Sales (10:00 AM ET) 🏠:This data indicates the annualized number of previously constructed homes sold during the previous month, reflecting housing market conditions.
Forecast: 5.50 million annualized units
Previous: 5.47 million annualized units
📅 Thursday, March 20:
🏦 Federal Reserve Interest Rate Decision (2:00 PM ET) 🏦:The Federal Open Market Committee (FOMC) announces its decision on short-term interest rates, influencing borrowing costs and economic activity.
Forecast: No change, maintaining rates at 4.25%–4.50%
Previous: 4.25%–4.50%
⚠️ Disclaimer: This information is for educational and informational purposes only and should not be construed as financial advice. Always consult with a professional financial advisor before making investment decisions.⚠️
📌 #trading #stockmarket #economy #news #trendtao #charting #technicalanalysis
Skew traders don't lieIt is either a market's bottom, or it is going to get much worse! A reasonable point of entry for moderate-risk position sizes.

$QQQ WARNING! April Fool's Market a Joke this year at SUB $400Is this happening? I'm going to have to bet my money on yes. I have been doing this for a long time. Pattern Chart Trading . This has a high probability of happening imo. Is it absolute? Of course not. Is it better to be prepared? Absolutely. Now for the technicals of it.. I'm trying to do better with this...
If we take a bearish perspective on the fib from the previous high in December , and the most previous lower low mid January , we have ourselves at the 1.61 Golden Pocket below. I have a Bullish perspective if we hold here and move above the 1.00 Fib Level, mid January Lows at $499.70 . Last defense would be a 50% retracement to the .786 FIB at the $508 area. Currently, I expect a rally to the 50 day SMA for a retest, then a SLAM to $380s in April . This is the possibility. Take it with a Grain of Salt. The possibility is there. I have one Bullish outlook.. I will post after this...

Is the Stock Market Bottom in? Stock market analysis | NASDAQ:QQQ AMEX:SPY NASDAQ:SMH
Mag 7 Price Forecast | TSLA NASDAQ:NVDA AAPL AMZN META MSFT GOOGL

SPY: Long Trade Explained
SPY
- Classic bullish formation
- Our team expects pullback
SUGGESTED TRADE:
Swing Trade
Long SPY
Entry - 562.78
Sl - 550.29
Tp - 583.92
Our Risk - 1%
Start protection of your profits from lower levels
Disclosure: I am part of Trade Nation's Influencer program and receive a monthly fee for using their TradingView charts in my analysis.
❤️ Please, support our work with like & comment! ❤️

A look at the ES1!What's up traders,
Havent posted in a while.
Heres my take and outlook for next week, using the MES1! (SP500)
Current Outlook
Technical Look:
Momentum Bearish -323.25 (looks weak)
MACD Bearish, possibly inflecting
RSI 36.72, off lows and crossing MA (oversold)
200D SMA at 5775.75 (Below the 50 Day)
50D SMA at 5967.43 (Above the 200 Day) Trending towards a Death Cross
Price Action
Bullish Engulfing Candle on the March 14 bounce.
Price successfully crossed the 5600 Psychological Level
We bounced at ~5500
Experiencing resistance in the 5640-5620 Range (expected)
Sentiment
Canada showed promise as heading towards a (take your best guess at the details) resolution to the tariff fight with the united states.
Tariffs remain a major drag on the stock market pricing.
Government shut down at time of this post, is apparently narrowly avoided.
Gold Set a new high.
Outlook for Next Week
Economic Reports
Monday - Retail Sales 830AM
Tuesday - Building Permits, Housing Starts 830AM
Wednesday - Fed Int Rate Decision 2PM, JPOW Speech 230PM
Thursday - Existing home sales 10AM
Notable Earnings Reports
Micron
Nike
Fed Ex
General Mills
Carinval Cruise
NIO
Tencent
I viewed the Firday bounce as a sort of 'relief rally'. My belief is that we could go higher on the back of it. The market has majorly 'oversold' by the numbers - and the probability of a bounce became increasingly likely. Upside resistance to remain mercurial on the rapidly changing sentiment narrative.
A possible outcome: retest the underside of the 200DMA.
I do not expect a notable price recovery towards ATH's until the tariff effects are known, which means: I expect higher than normal volatility for several months
Earnings projections (in the coming earnings season) will shed the required light on reality.
I have been adding long term holds - such as:
GDX
DAX
META
GOOG
AMZN
BABA
UNH
C
CRWD
IBIT
NVO
CMG
INDA
AVGO
I remain ~90% cash at ~3.7% yield.
Resistance possibly at:
5672 August 2024 Resistance, September 2024 Support
5724 July 2024 Resistance and later Support
5775 (200 Day SMA)

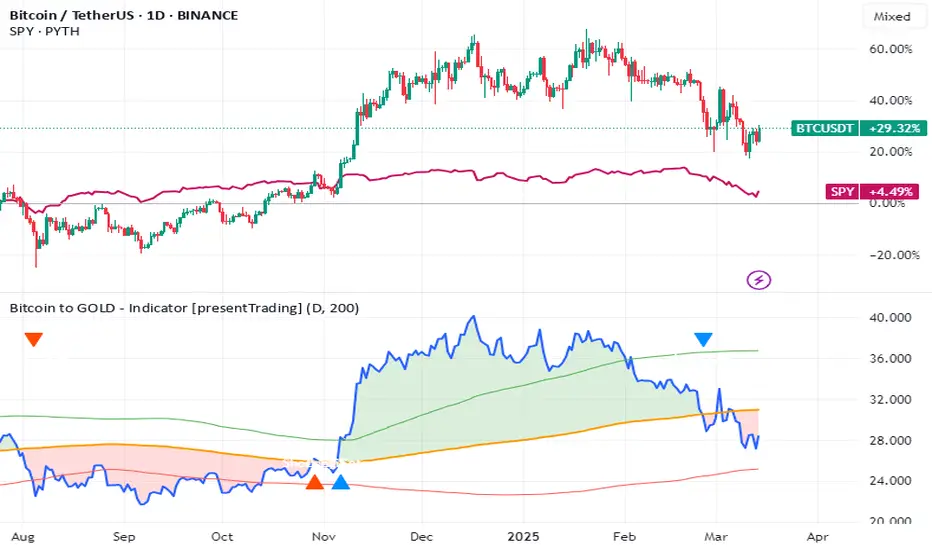
Bitcoin, S&P, Gold: Market Decline & DivergenceThe intricate dance of financial assets often reveals hidden correlations and predictive patterns. Recently, the synchronized decline of Bitcoin and the S&P 500 has raised concerns, while gold's historic rally has left Bitcoin trailing. However, a deeper dive into the data suggests a potential turnaround, hinting at a shift in market dynamics.
For much of the past few years, Bitcoin has exhibited a strong correlation with the S&P 500, behaving as a risk-on asset.1 When the stock market surged, Bitcoin often followed suit, and conversely, market downturns typically coincided with Bitcoin's price depreciation. This correlation stems from shared macroeconomic drivers, such as interest rate expectations, inflation concerns, and overall investor sentiment. The recent parallel decline reflects anxieties surrounding persistent inflation, potential interest rate hikes, and geopolitical uncertainties.
However, this synchronized movement doesn't tell the whole story. While Bitcoin and the S&P 500 have been grappling with downward pressure, gold has embarked on a remarkable rally, reaching unprecedented heights. This surge is fueled by several factors, including substantial inflows into gold ETFs, escalating geopolitical tensions, and heightened market volatility. Gold's traditional role as a safe-haven asset has been reaffirmed, as investors seek refuge from the turbulence in equity and cryptocurrency markets.
The divergence between Bitcoin and gold is particularly striking. The Bitcoin-to-gold ratio, a metric that reflects the relative value of Bitcoin compared to gold, has broken a 12-year support level. This breach signals a significant shift in investor preference, with gold emerging as the dominant asset. The recent climb of gold to a hypothetical $3,000 mark (or equivalent in other currencies) further underscores this trend, demonstrating its resilience in the face of economic uncertainty.
The observed pattern of Bitcoin breaking its multiyear uptrend against gold bears a striking resemblance to the market behavior witnessed between March 2021 and March 2022. During that period, Bitcoin experienced a similar decline relative to gold, ultimately leading to a substantial drop in its dollar value. This fractal pattern suggests that Bitcoin may be poised for further depreciation, potentially falling below the $65,000 mark.
However, it's crucial to acknowledge that historical patterns are not infallible predictors of future performance. Market dynamics are constantly evolving, and unforeseen events can significantly alter the trajectory of asset prices. While the current data points towards a potential decline for Bitcoin, there are countervailing factors that could trigger a reversal.
One such factor is the increasing institutional adoption of Bitcoin. As more institutional investors allocate a portion of their portfolios to cryptocurrencies, the market may become less susceptible to short-term fluctuations driven by retail sentiment. Moreover, the long-term potential of Bitcoin as a decentralized store of value remains a compelling narrative for many investors.
Additionally, the regulatory landscape surrounding cryptocurrencies is gradually becoming clearer. As governments and regulatory bodies establish frameworks for the operation of digital asset markets, investor confidence may improve, leading to renewed interest in Bitcoin. The upcoming Bitcoin halving is also anticipated to reduce the supply of new Bitcoin entering the market, which could potentially drive up its price.
While the current correlation between Bitcoin and the S&P 500 may persist in the short term, the underlying fundamentals of Bitcoin suggest a potential decoupling in the long run. As the cryptocurrency market matures and gains wider acceptance, its correlation with traditional asset classes may weaken.
The recent divergence between Bitcoin and gold highlights the importance of diversifying investment portfolios. While gold has proven its resilience in times of uncertainty, Bitcoin offers the potential for substantial returns in the long term. Investors should carefully consider their risk tolerance and investment objectives when allocating capital to these assets.
The breakdown of the Bitcoin to gold ratio is a concerning indicator, however, the cryptocurrency world moves quickly. The market is driven by new innovation, and adoption. The market has been known to have large pullbacks, followed by even larger rallies. The current market may be pricing in a large amount of fear, and a simple change in the news cycle could cause a large change in the price of bitcoin.
In conclusion, the current market dynamics present a complex picture. The synchronized decline of Bitcoin and the S&P 500, coupled with gold's historic rally, suggests a potential downturn for Bitcoin. However, the long-term potential of Bitcoin, coupled with increasing institutional adoption and a maturing regulatory landscape, could trigger a reversal. Investors should remain vigilant, monitor market trends, and make informed decisions based on a comprehensive understanding of the underlying fundamentals. The data suggests a potential turn around, but only time will tell if the market will comply.
TSLA PRICE ACTION 14 MARCH 2024This is the price action of TESLA. Everything is discussed in depth in this analysis. If you have any questions, feel free to leave a comment.
Understand the price action & then trade

SPY - support & resistant areas for today March 14, 2025The key support and resistance levels for SPY today are above.
Follow me to get this notified when I publish in the morning.
Understanding key levels in trading can provide valuable insights into potential market movements. These levels often indicate where prices might reverse or consolidate, serving as important signals for traders considering long (buy) or short (sell) positions.
Calculated using complex mathematical models, these levels are tailored for today's trading session and may evolve as market conditions change.
If you find this information beneficial and would like to receive these insights every morning at 9:30 AM, I invite you to support me by boosting this post and following me @OnePunchMan91. Your engagement is greatly valued! However, please note that if this post doesn’t receive more than 10 boosts, I will have to reconsider providing these daily updates. Thank you for your support!
Need any other charts daily, comment on this.

Gold takes Adv. since Trump-a-rally pans out to Bulls fartIt's gone 2 weeks or so, since Mr. Trump has secured a win over his Democrat-rival Kamala Harris in the 2024 U.S. presidential election, as it declared by the Associated Press.
Since that, a lot of stocks soared in a meme-style mode, while Bitcoin clears $93,000 and Dogecoin soared amid Trump-fueled crypto rally.
Among nearly 2000 components of Smallcap Russell 2000 Index TVC:RUT , appr. 90 percent of them (without any fundamental reasons) were up on November 6 - at the day Trump clinched White House victory.
For S&P 500 SP:SPX and Nasdaq-100 NASDAQ:NDX indices these numbers were 70 and 75 percent respectively.
Since US dollar interest rates are still near multi year highs and Powell still says the Fed is in no hurry to cut interest rates.. all of that means Trump-a-rally gives no light for super-duper bets, as it's been discussed in earlier posted ideas.
Moreover, Geopolitics is roaring back, as current U.S. President Joe Biden tries to authorize the yellow-blues to use powerful long-range American-made weapons inside Russia's legal areas, potentially inside Kursk region where located The Kursk Nuclear Power Plant, that is one of the three biggest nuclear power plants (NPPs) in Russia and one of the four biggest electricity producers in the country.
The main graph is for Gold spot OANDA:XAUUSD , and it indicates on Cup with Handle technical structure in development as Gold takes Adv. since Trump-a-rally pans out to Bulls fart.

3/14/2025 SPY reversal or just a lil' bit more before a bounce? Key Observations:
1. Significant Downtrend:
• The recent price action shows a notable decline from its highs, suggesting strong selling pressure.
• The price has fallen to a major support zone around $551.42, close to a longer-term uptrend line (green line).
2. Support & Resistance Levels:
• $563.91 – A previous support level turned resistance after the recent decline.
• $551.42 – Currently being tested as a support level.
• $539.44, $518.36, and $510.27 – Potential next support levels if price continues downward.
3. Trendline Test:
• The long-term uptrend line is being tested right now. If it holds, SPY could see a bounce.
• If it breaks below, it might lead to a deeper correction towards $539.44 or lower.
4. Indicators:
• Stochastic RSI (middle panel):
• Currently in oversold territory, suggesting that selling momentum is strong, but a potential bounce could occur.
• MACD (bottom panel):
• The histogram is deeply negative, showing strong downward momentum.
• The MACD lines are still bearish but may start flattening, which could indicate slowing bearish momentum soon.
Prediction for Tomorrow & Near-Term:
• Bullish Scenario:
• If $551.42 and the trendline hold, SPY may attempt a bounce toward $563.91 resistance.
• Confirmation would require bullish momentum on lower timeframes and increased volume.
• Bearish Scenario:
• If SPY breaks below $551.42 and the trendline, expect further downside to $539.44 and possibly $518.36 in the coming days.
• A continued negative MACD and weak Stoch RSI would reinforce this bearish outlook.
Conclusion:
• Critical level to watch: $551.42.
• If SPY closes above it, we could see a short-term rebound.
• If it breaks below, expect more downside pressure toward $539.44 and $518.36.

Nightly $SPY / $SPX Scenarios for March 14, 2025🔮 🔮
🌍 Market-Moving News 🌍:
🇺🇸⚠️ Potential U.S. Government Shutdown ⚠️: The United States faces a potential government shutdown on March 14 if lawmakers fail to agree on the 2025 budget. This impasse could lead to the closure of government agencies and furloughs of federal employees, impacting various sectors and potentially affecting market sentiment.
📊 Key Data Releases 📊:
📅 Friday, March 14:
🛒 University of Michigan Consumer Sentiment Index (10:00 AM ET) 🛒:This index measures consumer confidence regarding personal finances, business conditions, and purchasing power, providing insights into consumer sentiment.
Forecast: 64.0
Previous: 64.7
🛢️ Baker Hughes Rig Count (1:00 PM ET) 🛢️:This report provides the number of active drilling rigs in the U.S., offering insights into the oil and gas industry's health.
Previous: 592
⚠️ Disclaimer: This information is for educational and informational purposes only and should not be construed as financial advice. Always consult with a professional financial advisor before making investment decisions.⚠️
📌 #trading #stockmarket #economy #news #trendtao #charting #technicalanalysis
$SPY Next 5 Years A rounding top on the tape. Soon it’s time to wreck late bears and get everyone excited for America’s greatness. Then the grim reaper will rear his head as the reduction of fiscal spending makes a reality check 🧐

SPY/QQQ Plan Your Trade EOD Update for 3-13-25What a crazy day. The markets certainly decided to burn the longs almost all day.
I got a few messages from traders who continued trying to pick bottoms in this downtrend. FYI, that can be very dangerous.
If you are a short-term trader and are trying to pick a base/bottom all day today - you have to have a limit in terms of how much you are willing to risk within a single day.
I've seen dozens of traders blow up their accounts in a big, trending market.
Please learn from your actions. Develop a STOP POINT related to your trading decisions.
There is no reason to continue to try to execute "bounce" trades when the markets are trending as strongly as they are today.
This video should help you understand what I see as the potential over the next 5+ days.
We are still trying to hold above critical support near the 50% retracement level on the SPY.
Everything depends on what happens in DC and how the markets perceive risks.
Gold/Silver rallied very strong today. This is FEAR related to risks.
If the US government enters a shutdown, Gold and Silver could skyrocket much higher.
Get some.
#trading #research #investing #tradingalgos #tradingsignals #cycles #fibonacci #elliotwave #modelingsystems #stocks #bitcoin #btcusd #cryptos #spy #gold #nq #investing #trading #spytrading #spymarket #tradingmarket #stockmarket #silver

TSLA ! You like money? You like money ?We're here to make money! I don't care about politics or idealists. If TSLA makes +20% in the next few weeks, I'll be very happy! End of story. I only do technical analysis. No emotions here.
hedge funds, YOUR pension funds and market makers have to pay themselves! They're buying the dip, while you're watching the stock collapse! Wake the hell up!
Some troll here haha
