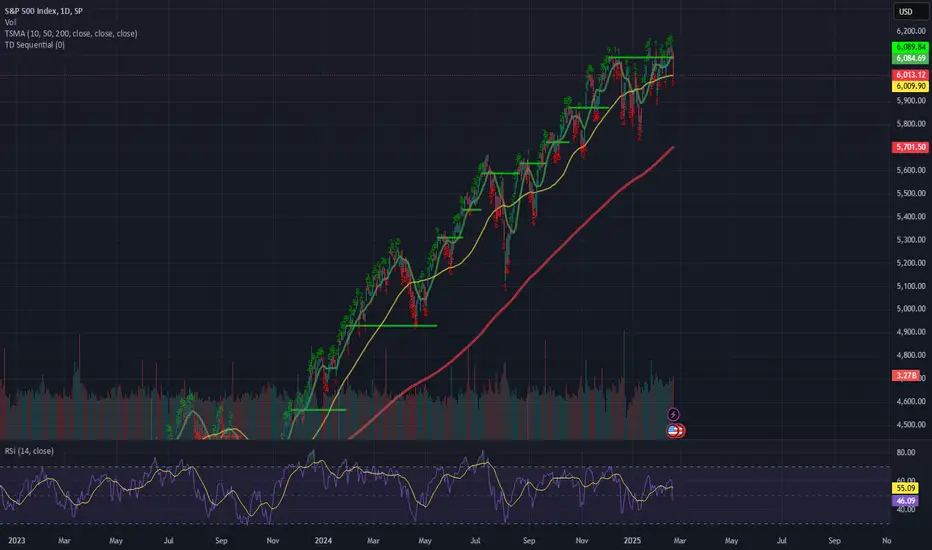
$SPY $SPX OLD CHART BAR PATTERN COVID CRASH NOW!!!!Holy crap.... I just came across an old chart and literally in the nick of timeI tell you. All I'm going to say is... I'm a pattern chart trader and this is the COVID bar pattern attached to our daily from like a year ago almost and I loaded up an old layout to do work and boom... here we are... Good LUCK ... Not sure what the trigger will be but we are here.
SPDR S&P 500 ETF (SPY)
Weekly Market Outlook: February 24 – 28, 2025 🔮 🔮
🌍 Market-Moving News 🌍:
🇺🇸📈 U.S. Tariffs Implementation 📈: President Donald Trump has announced plans to impose a 25% tariff on imported automobiles, pharmaceuticals, and lumber products, set to take effect on April 2, 2025. This move aims to protect domestic industries but has raised concerns about potential impacts on global trade relations.
🇺🇦🇷🇺 Diplomatic Efforts 🇺🇦🇷🇺: This week marks the third anniversary of Russia's full-scale invasion of Ukraine. Key events include French President Emmanuel Macron visiting President Trump in Washington and a virtual G7 meeting to discuss potential resolutions to the ongoing conflict.
📊 Key Data Releases 📊:
📅 Tuesday, Feb 25:
🏠 S&P CoreLogic Case-Shiller National Home Price Index (9:00 AM ET) 🏠: Provides data on home prices across 20 major U.S. cities.
📈 Consumer Confidence Index (10:00 AM ET) 📈: Measures consumer sentiment regarding economic conditions. Analysts forecast a slight dip in February to 102.6 from January's 104.1.
📅 Wednesday, Feb 26:
🏠 New Home Sales (10:00 AM ET) 🏠: Reports the number of newly constructed homes sold in the previous month. Economists predict a modest decline to a seasonally adjusted annual rate of 680,000 homes from December's 698,000.
📅 Thursday, Feb 27:
📉 Initial Jobless Claims (8:30 AM ET) 📉: Weekly report on the number of individuals filing for unemployment benefits.
📊 Gross Domestic Product (GDP) Second Estimate (8:30 AM ET) 📊: Revised estimate of the nation's economic growth for Q4 2024. The initial reading showed a 2.3% annual growth rate, slightly below expectations.
🛠️ Durable Goods Orders (8:30 AM ET) 🛠️: Indicates new orders placed with domestic manufacturers for delivery of long-lasting goods.
📅 Friday, Feb 28:
💰 Personal Consumption Expenditures (PCE) Price Index (8:30 AM ET) 💰: The Federal Reserve's preferred measure of inflation.
💳 Personal Income and Outlays (8:30 AM ET) 💳: Reports changes in personal income and spending.
🏠 Pending Home Sales (10:00 AM ET) 🏠: Measures housing contract activity for existing single-family homes.
📌 #trading #stockmarket #economy #news #trendtao #charting #technicalanalysis

SPY Bearish Breakout! Sell!
Hello,Traders!
SPY was trading in an
Uptrend but then the index
Made a bearish breakout
From the bearish wedge
Pattern and we are locally
Bearish biased and we will
Be expecting a local
Bearish move down
Sell!
Comment and subscribe to help us grow!
Check out other forecasts below too!

CELH Breakout: Can Buyers Hold the Line?CELH closed the week slightly above its IPO AVWAP on the highest volume ever, signaling significant short liquidation and a potential market sentiment shift. The immediate resistance at the $36 range aligns with a key consolidation zone, adding weight to its importance. With the weekly RSI approaching 50—historically a pivot point—a breakout above could strengthen the bullish case.
The volume spike indicates not only short covering but also potential new buyer accumulation. The SMI crossing up from oversold and the stock reclaiming the anchored VWAP above the 200-week moving average further support the strength of this move.
What’s crucial now is whether CELH can attract real buying interest above $36 once short-covering subsides. If this level holds, mid-$40s could be the next target, with significant resistance around $50. Ideally, I'd like to see a low-volume pullback that confirms new buyer support, suggesting a trend reversal rather than a short-term bounce.

Following up SPYEntry Strategy
Entry Levels:
599: Initiate your first position here.
593: Consider adding to your position if the price pulls back.
585: Evaluate a further entry during a deeper retracement.
Profit Targets:
607: Aim for an initial profit target at this level.
611: A secondary target to capture additional gains.
615: The final target where you may exit for optimal returns.
Remember to use proper risk management, including stop-loss orders, and ensure your risk/reward ratio meets your trading criteria.
Disclaimer: This information is for educational purposes only and does not constitute financial advice. Trade responsibly.

SPY: Market of Buyers
The charts are full of distraction, disturbance and are a graveyard of fear and greed which shall not cloud our judgement on the current state of affairs in the SPY pair price action which suggests a high likelihood of a coming move up.
❤️ Please, support our work with like & comment! ❤️

Stock Market Analysis | TSLA NVDA AAPL AMZN META GOOGL MSFTStock Market Forecast | NASDAQ:QQQ AMEX:SPY SEED_ALEXDRAYM_SHORTINTEREST2:NQ NYSE:ES
Mag 7 Forecast | NASDAQ:TSLA NASDAQ:NVDA NASDAQ:AAPL NASDAQ:AMZN NASDAQ:META NASDAQ:GOOGL NASDAQ:MSFT

$QQQ Support and Resistance Areas?QQQ had a big bearish candle on Friday. If you look left on the chart there were 2 comparable recent days. On Dec 18, 2024, and Jan 7, 2025, both lead to further downside. On Dec 18, the decline before a rally was about 5.3% and the Jan 7 decline was around 4.9%. Friday’s decline was about 2.4%. “If” those declines are any guide, we could expect another 2.5% to 3% additional deterioration. Which portends a pullback to around 512 to 510. Think of those as areas of concern, not a prediction. I have also drawn in horizontal lines that “may” become areas of support or resistance. In addition, we are touching an area of upward sloping line (area) that has defined a series of higher lows over the last 4 weeks.
In summary, it is a good idea to have an open mind about any outcome over the next few days to weeks and simply look at these areas to see if they do indeed end up being turning points.
One more point, this is an index fund and as such looks at heavily weighted stocks. We are likely in a period of picking individual stocks that are leading and using this index simply as a guide to overall market health.
I hope that helps.

SPY On The Rise! BUY!
My dear friends,
My technical analysis for SPY is below:
The market is trading on 599.97 pivot level.
Bias - Bullish
Technical Indicators: Both Super Trend & Pivot HL indicate a highly probable Bullish continuation.
Target - 605.39
About Used Indicators:
A pivot point is a technical analysis indicator, or calculations, used to determine the overall trend of the market over different time frames.
———————————
WISH YOU ALL LUCK

Market about to RIP FACES OFF!AMEX:SPY SP:SPX : Contrarian Take!
Market about to RIP FACES OFF! 🚀
$631 Inbound! 🎯
Same outcome different reason since Sept.
Not financial advice

SPX S&P 500 Short term Bearish ? Retracement ?SP:SPX SP:SPX S&P 500
Is it Chart look good for Retracement purpose get shorts for 50% Fib Support ?
Chart lovers know the wonder fibo levels especially in Index.
is it Real time charts invisible ? Trust Your process stick with plan and play it.!

SPY and QQQ today drop is a 3 wave decline for abc wave 4One last rally to 546 to 547 in qqq and in the spy 515/517 today is minor wave 4 of 5 of 5 one last up into friday close Best of trades WAvetimer

SPY/QQQ Plan Your Trade Afternoon Update : BREAKDOWNIf you've followed my research over the past 90+ days - you were ready for this move.
If you were positioned for this breakdown, many of you should have seen decent profits or green in your accounts.
I'm so happy and proud to have helped many of you prepare for this move.
Stay cautious into the close as we may see more selling pressure drive prices lower.
Remember, everything I do is about helping you become a better trader.
Get some.
#trading #research #investing #tradingalgos #tradingsignals #cycles #fibonacci #elliotwave #modelingsystems #stocks #bitcoin #btcusd #cryptos #spy #es #nq #gold

SPY/QQQ Plan Your Trade For 2-21 : Top Pattern Counter TrendToday's Top pattern in Counter-Trend mode suggests the markets will attempt to move downward, seeking a new support level, then find a base and attempt to roll a bit higher.
I don't expect a big breakdown to take place today, but the YM is already struggling to maintain support - so we may see the ES/NQ break downward if the major markets continue to weaken throughout the day.
I do expect the markets to move into my Major Bottom pattern over the next 3-5+ trading days. So, overall, I expect the markets to reject these recent highs and attempt to move downward.
Gold and Silver should continue to rally with Gold trying to break above $3k and silver trying to break above $35.
Bitcoin is moving into an early stage Excess Phase Peak flagging formation. This should prompt a fairly solid rally phase for Bitcoin over the next few days/weeks.
If my longer-term research is correct, the recent new highs will be rejected and price will roll into a double-bottom type of setup between now and the end of March 2025.
I suspect traders are not prepared for this move and will continue to try to BUY any dip they see over the next 30+ days.
My only advice is to play the short-term trends and avoid position or swing trading too heavily.
The markets are going to become very volatile over the next 30+ days.
Get some.
#trading #research #investing #tradingalgos #tradingsignals #cycles #fibonacci #elliotwave #modelingsystems #stocks #bitcoin #btcusd #cryptos #spy #gold #nq #investing #trading #spytrading #spymarket #tradingmarket #stockmarket #silver

Nightly $SPY / $SPX Scenarios for 2.21.2025🔮
🌍 Market-Moving News:
🇺🇸🛢️ Trump Considers 25% Tariff on Imported Cars: President Donald Trump has announced plans to impose a 25% tariff on imported automobiles, aiming to protect domestic manufacturers. This move could impact global trade relations and the automotive industry.
🇷🇺🇺🇸 U.S.-Russia Diplomatic Talks: High-level discussions between U.S. and Russian officials are set to continue, focusing on resolving the ongoing Ukraine conflict. Outcomes from these talks may influence global markets and geopolitical stability.
📊 Key Data Releases:
📅 Friday, Feb 21:
🏭 Manufacturing PMI (9:45 AM ET): Forecast: 51.3; Previous: 51.2.
💼 Services PMI (9:45 AM ET): Forecast: 53.0; Previous: 52.9.
🏠 Existing Home Sales (10:00 AM ET): Forecast: 4.13M; Previous: 4.24M.
📉 Michigan Consumer Sentiment (10:00 AM ET): Forecast: 71.1; Previous: 67.8.
📌 #trading #stockmarket #economy #news #trendtao #charting #technicalanalysis


SPY/QQQ Plan Your Trade For 2-20 : Rotation PatternSorry for my delay this morning. Everything is fine over here - just a bit hectic this morning, and I had to drive my son to his work at 530am - which interrupted my plans.
OK, so here we go.
This video helps to organize my analysis/thinking into more clearly presented data for my followers. I use the Fibonacci Price Theory as a basis for all my analysis. On top of that, I use other techniques (anchor bars, my SPY Cycle Patterns, and my custom indexes) to help identify when and where opportunities exist for the best trades.
I've been getting comments related to my labeling these videos as Bullish or Bearish which may go against the primary trend direction presented on the charts. So, now I've added a TEXT LABEL that tells you what every chart is doing on a Short, Intermediate, and Long-term basis.
This will help all of you follow my analysis/thinking going forward (I hope).
Today's Rotation Pattern suggests the markets will slide into a sideways price rotation phase.
This rotation could be a stalling pattern after the recent rally to new ATHs.
I'm still very cautious of a breakdown/pullback in trend after this move higher. As I keep saying, I don't believe the markets have sufficient momentum to continue a massive rally phase. And I really believe this new ATH level is a BULL TRAP - setting up longs to jump into this rally mode before a bigger pullback/breakdown takes place.
Gold and Silver are struggling to move higher with a fairly broad rotating range - but they are still pushing higher.
I believe Gold and Silver will make a big move higher over the next 30+ days. So, be prepared for volatility - but stick with long trades for metals as I believe Gold will rally to levels above $3100 very quickly.
Bitcoin could be shifting into a new Excess Phase Peak pattern off recent lows. The FPT trends for Bitcoin are still BEARISH, but we are starting to see a base setup that may become a new Excess Phase Peak low.
Watch this video and please comment if you have any questions.
Again, sorry for my delay this morning.
Get some..
#trading #research #investing #tradingalgos #tradingsignals #cycles #fibonacci #elliotwave #modelingsystems #stocks #bitcoin #btcusd #cryptos #spy #gold #nq #investing #trading #spytrading #spymarket #tradingmarket #stockmarket #silver

Nightly $SPY / $SPX Scenarios for 2.20.2025🔮
🌍 Market-Moving News:
🇰🇷📉 Samsung Share Cancellation: Samsung Electronics plans to cancel over 57 million shares, including 50.1 million common shares and 6.9 million preferred shares, on February 20. This move aims to reduce the total number of issued shares without decreasing the company's capital.
📊 Key Data Releases:
📅 Thursday, Feb 20:
🏭 Philadelphia Fed Manufacturing Index (8:30 AM ET): Forecast: 19.4; Previous: 44.3.
📉 Initial Jobless Claims (8:30 AM ET): Forecast: 214K; Previous: 213K.
📈 Leading Index (10:00 AM ET): Forecast: -0.1%; Previous: -0.1%.
📌 #trading #stockmarket #economy #news #trendtao #charting #technicalanalysis

SPY Bullish Breakout! Buy!
Hello,Traders!
SPY is trading in a strong
Uptrend and the index made
A bullish breakout of the key
Horizontal level around 608$
So we are bullish biased and
We will be expecting a further
Bullish move up
Buy!
Comment and subscribe to help us grow!
Check out other forecasts below too!

Bullish Cypher - SPY spotted a bullish Cypher pattern on SPY’s daily chart, and it looks promising.
Entry: Current Market Price
Stop Loss: 575.50, just under the D-point, to give the trade some breathing room.
Targets: All time high
Ideas and Inputs are welcome.
Thank you for dropping by.
Disclaimer:
This analysis is for educational purposes only and is not financial advice. Trading involves significant risk, and you should only trade with money you can afford to lose. Past performance is not indicative of future results. Always do your own research and consult with a financial advisor before making any trading decisions.

Bulls and Bears zone for 02-19-2025So far S&P 500 has been trading sideways this week.
Any test of yesterday's Close could provide direction for the day.
Level to watch : 6136 ---6138
Report to watch:
US: FOMC Minutes 2:00PM ET

SPY/QQQ Plan Your Trade For 2-19-25: GAP Reversal Counter-trendToday's pattern suggests a morning GAP will lead to a price reversal in a counter-trend type of mode.
I read this as a potential that price will initially struggle to find a trend. Eventually, when it does identify a trend mode, I believe that trend will strengthen into a reversal of the current upward price trend.
Normally, Counter-trend patterns invert. So, what I would have expected as an uptrend would turn into a downtrend. But, the markets have moved into a very consolidated price channel near recent highs and volume has diminished strongly.
Because of this type of setup, I believe an aggressive breakaway or breakdown price move is pending.
Price will attempt to make a move - and when it does, it should be explosive.
My continued research, which I share with you in this video, continues to suggest price will stall out and revert downward.
We'll see how things play out over the next few days.
Gold and Silver are back near recent all-time highs. Stay cautious of a breakdown in metals associated with a breakdown in the SPY/QQQ.
BTCUSD is still struggling to make a move. As you will see, I believe the dominant trend is to the downside right now.
In short, we are standing at the edge of a cliff regarding price action. At this point, we either grow wings and soar higher or fall downward - hoping for a soft landing.
Buckle up.
Get some.
#trading #research #investing #tradingalgos #tradingsignals #cycles #fibonacci #elliotwave #modelingsystems #stocks #bitcoin #btcusd #cryptos #spy #gold #nq #investing #trading #spytrading #spymarket #tradingmarket #stockmarket #silver

$SPY🚨 AMEX:SPY Outlook
We are overextended here and failed to surpass major OB(s). The next leg down will be a wild ride, as we may fall below $590 heading into March.
The great financial switch to the Digital Financial System is upon us.
