YEN CARRY TRADE TICK TICK BOOM WAVE E The chart posted is my work on the yen trade I have maintained the same labeling and as you can see What I think is rather near . I am major bearish the US stock market and I am starting to reposition for a MAJOR DOWN TURN into mid OCT the 10th best of trades WAVETIMER
SPDR S&P 500 ETF (SPY)

SPX500 Awaits Breakout as Trade Talks Fuel Market CautionWall Street Edges Up Amid Tariff Talks & Trade Turbulence
U.S. stock index inched higher on Wednesday as markets remain on edge over President Donald Trump's aggressive tariff stance and the ongoing negotiations with global trade partners. Traders are cautiously watching for clarity, with sentiment shifting quickly on any updates.
📉 SPX500 Technical Outlook
The index continues to consolidate within a narrow range between 6223 and 6246. A confirmed breakout from this zone is needed to define the next directional move.
A break below 6223 would confirm bearish continuation toward 6194, with potential extension to 6143.
A break above 6246 would shift the bias bullish, targeting 6282, followed by 6305.
Key Levels:
Support: 6223 / 6195 / 6143
Resistance: 6282 / 6305

07/08/25 Trade Journal, and ES_F Stock Market analysis EOD accountability report: +220
Sleep: 7 hours
Overall health: Good
VX Algo System Signals from (9:30am to 2pm) 4/4 success
— 9:30 AM Market Structure flipped bullish on VX Algo X3! :check:
— 10:30 AM VXAlgo NQ X1 Buy Signal :check:
— 12:24 PM Market Structure flipped bullish on VX Algo X3! :check:
— 1:30 PM Market Structure flipped bearish on VX Algo X3! :check:
What’s are some news or takeaway from today? and What major news or event impacted the market today?
After taking losses, I usually set a lock out on my account after $200 profit to build back small wins and confidence. so luckily I was locked out pretty early today and avoided most of the market whipsaw. But on days like these, if you don't walk away after you make money, you could eventually get triggered and tilted by the whipsaw. a lot of orb traders probably died today.
News
*HOWARD LUTNICK ON TARIFFS: EXPECT ANOTHER 15-20 LETTERS TO GO OUT OVER THE NEXT 2 DAYS- CNB
*Trump announces 50% tariff on copper imports, threatens 200% tariff on pharmaceuticals and maybe chips
What are the critical support levels to watch?
--> Above 6280= Bullish, Under 6260= Bearish
Video Recaps -->https://www.tradingview.com/u/WallSt007/#published-charts

SHORT ON SPY (SPX/USD)SPY has a double top and is currently pulling back to a supply zone.
I expect spy to drop to the next demand level or FVG to the downside.
This is a sell limit order. Waiting for price to reach the supply area before taking the sell.

SPX500 Range-Bound Between 6223–6246 |Breakout Will Define TrendSPX500 – Technical & Fundamental Outlook
The SPX500 is currently trading within a narrow consolidation zone between 6223 and 6246.
A 1H or 4H candle close below 6223 would confirm a bearish breakout, with downside targets at 6191 and 6143.
Conversely, a 1H close above 6246 would signal bullish continuation, potentially driving the price toward the next resistance at 6287, followed by 6305.
Support: 6223 / 6191 / 6143
Resistance: 6287 / 6305
Fundamental Note:
The tariff situation remains a major driver.
Successful negotiations would likely boost bullish sentiment across indices.
Lack of progress may trigger renewed bearish momentum.

Are We Completing the Larger Ending Diagonal Now?The last time I updated followers of my work; I stated that the pattern was advancing, but NOT with confidence, and that it is marked with choppy, overlapping price action that appears to be an ending diagonal. Those sentiments have not changed.
However, what has changed is I was forecasting a more pronounced drop first before getting to new highs. It is now possible; this move higher is completing that move on a more immediate basis. Although I cannot rule out the previous larger ABC... it is more likely once this high completes, it could represent the end of the bull market.
Only the structure of the decline will inform us what is playing out.
I will warn followers that once this more immediate high completes, I am expecting a forceful and swift reversal that will undoubtedly catch most traders off guard.
Best to all,
Chris

TESLA PRICE ACTION 7 JULY 2025I have clearly explained the price action for Tesla. I have tried my best to explain why you should not be aggressive here.
I have also discussed the stops
NOTE:DO NOT BUY CALLS

GOOGLE Count changed, Bullish outlook.I have adjusted NASDAQ:GOOG NASDAQ:GOOGL Elliot wave count with a wave 1 completing a leading diagonal backed up by a deep wave 2 correction into High Volume Node support (HVN). We potentially have another 1-2 with fast drop and recovery to the S1 daily pivot which would make long term outlook extra bullish by extending target.
Wave 3 is underway with a target of the all time hime high HVN for wave 5. The next resistance HVN is $191.
Price above the daily pivot and is continuing upwards after testing as support.
Analysis is invalidated below $162 swing low.
Safe trading

SPY (S&P500 ETF) - Daily Golden Cross and All-Time-High PriceSPY (S&P500 ETF) price has reached all-time-highs in July 2025, after a SMA Golden Cross printed on the daily chart.
SPY is still in a price uptrend since May 2025, however a higher-low pullback has not occurred for the past two weeks.
Resistance levels: $625, $630, $635, $640.
Support levels: $622, $617, $614, $611.
A significant reversal or bearish candle pattern has not occurred yet on either the daily or weekly charts.
The Stochastic RSI indicator has reached overbought levels, both on the Daily chart and Weekly chart.
Stock market earnings season begins in July 2025, trade deal negotiations and new tariffs are in progress this week. Volatility could increase this month due to these news catalysts.

Opportunity Beneath the Fear: SPY's Reversal SetupIn the Shadow of Headlines: SPY’s Drop Could Be 2025’s Big Opportunity
As markets react sharply to renewed tariff fears and Trump-related headlines, SPY continues its descent. Panic is setting in—but behind the noise, a strategic opportunity may be quietly forming.
While many rush to exit, others are beginning to position for the bounce. A well-structured entry strategy could be key to turning uncertainty into gains.
Entry Zone (Staggered):
🔹 543: First watch level—look for signs of slowing momentum.
🔹 515: Deeper entry point as the selloff extends.
🔹 <500 (TBD): Stay flexible—if panic accelerates, this could mark a generational setup.
Profit Targets:
✅ 570: Initial rebound target.
✅ 590: Mid-range level if recovery builds.
✅ 610+: Full recovery potential—rewarding those with patience and vision.
Remember: Headlines fade, but price action and preparation stay. This selloff may continue—but it might also be laying the foundation for 2025’s most powerful move. The key? Enter with discipline, protect your capital, and let the market come to you.
⚠️ Disclaimer: This content is for educational purposes only and does not constitute financial advice. Trading carries significant risk. Always conduct your own research and use proper risk management.

SPY: Bearish Continuation & Short Trade
SPY
- Classic bearish pattern
- Our team expects retracement
SUGGESTED TRADE:
Swing Trade
Sell SPY
Entry - 625.36
Stop - 633.00
Take - 611.27
Our Risk - 1%
Start protection of your profits from lower levels
Disclosure: I am part of Trade Nation's Influencer program and receive a monthly fee for using their TradingView charts in my analysis.
❤️ Please, support our work with like & comment! ❤️

ES, SPY, SPX will be testing key support on Sunday After a welcome rally into new highs for the s&p, there appears to be a critical crossroad forming. Using the ES continuous contract I have placed 2 anchored VWAP's. The first being anchored to the last higher low on Thursday, June 19. And the the second, being anchored to this last Thursdays high on July 3rd.
For this post we will call the anchor from June 19 - VWAP1. And for the July 3rd anchor - VWAP2
VWAP1 r1 has acted as a key support line since the higher low was set. Successfully bouncing and holding support several times.
As we headed lower on this Thursdays July 3rd session, we remained between the center and r1 of VWAP2 indicating strong selling pressure for the day. With it being a shortened trading day with less liquidity however, I have less concern over the days price action. The forming crossroads and the upcoming Sundays open will be more telling for where we likely head this week.
The blue Horizontal Line at 6266 is placed directly on VWAP1s r1 (green line) which has acted as support. If we trade into this level on the Sunday open, it's a clear signal the sellers are still in control. If however, price can consolidate at that level (6266) and form structure, a breakout of the structure would be evidence of sellers backing off and buyers stepping in creating a good buying opportunity for the week.
Another possible scenario, if we first manage to trade up into s1 of VWAP2 (orange line) around the 6300 level, I will be looking for a short scalp down to the r1 of VWAP1 at 6266. From here it would be prudent to sit and wait for more confirmation on if this is a reversal, or just another pullback in the uptrend.
These are my two trade setups and ideas for Sunday's open. Hope this analysis helps. Happy trading 🤙💰📈

July 7 - 11: Buy Stock Indices DIPs! Watch For Gold, Oil FVGs!In this Weekly Market Forecast, we will analyze the S&P 500, NASDAQ, DOW JONES, Gold and Silver futures, for the week of July 7 - 11th.
Stock Indices are strong, so dip opportunities should present themselves next week.
Gold is bullish-neutral. Could see strength enter this market as July 9th approaches.
Silver is bullish. No reason to short it.
Oil is in a Monthly +FVG. If the FVG fails, it will confirm bearishness. Couple that with the fundamentals, I am watching for that confirmations to sell US Oil.
Enjoy!
May profits be upon you.
Leave any questions or comments in the comment section.
I appreciate any feedback from my viewers!
Like and/or subscribe if you want more accurate analysis.
Thank you so much!
Disclaimer:
I do not provide personal investment advice and I am not a qualified licensed investment advisor.
All information found here, including any ideas, opinions, views, predictions, forecasts, commentaries, suggestions, expressed or implied herein, are for informational, entertainment or educational purposes only and should not be construed as personal investment advice. While the information provided is believed to be accurate, it may include errors or inaccuracies.
I will not and cannot be held liable for any actions you take as a result of anything you read here.
Conduct your own due diligence, or consult a licensed financial advisor or broker before making any and all investment decisions. Any investments, trades, speculations, or decisions made on the basis of any information found on this channel, expressed or implied herein, are committed at your own risk, financial or otherwise.

Inevitable Pull Back Coming Soon?| NVDA TSLA AAPL AMZN META MSFTStock market Forecast | QQQ SPY CME_MINI:NQ1! CME_MINI:ES1!
Mag 7 FORECAST| NASDAQ:NVDA NASDAQ:TSLA AAPL AMZN META MSFT July 2025 Forecast

SPY Under Pressure! SELL!
My dear friends,
Please, find my technical outlook for SPY below:
The instrument tests an important psychological level 625.36
Bias - Bearish
Technical Indicators: Supper Trend gives a precise Bearish signal, while Pivot Point HL predicts price changes and potential reversals in the market.
Target - 610.17
Recommended Stop Loss - 632.61
About Used Indicators:
Super-trend indicator is more useful in trending markets where there are clear uptrends and downtrends in price.
Disclosure: I am part of Trade Nation's Influencer program and receive a monthly fee for using their TradingView charts in my analysis.
———————————
WISH YOU ALL LUCK

SPY/QQQ Plan Your Trade End Of Week Update For 7-4Happy 4th of July
I've been very busy with projects and new tools for traders, as well as the new book I'm working on, and thought I would deliver an End Of Week update for everyone.
In this video, I cover the past Cycle Patterns and how they played out for the SPY/QQQ, Gold/Silver, and Bitcoin, as well as add some of my own insight related to the market trends.
All of my systems are still LONG and have not changed. I still believe this market is extremely overbought, and I believe it could roll over at any moment into a pullback - but we need to wait to see if/when that may/does happen.
Gold made a big move higher this week, and I believe that move could continue throughout July.
Bitcoin made a surprising Double-Top and is not rolling downward. Could be a breakdown in the markets as BTCUSD tends to lead the QQQ/NQ by about 3-5 days.
The SPY/QQQ rallied like a rocket all week. It was absolutely incredible to see the markets rally like this. But, I'm still cautious of a sudden rollover top.
I managed to catch some nice trades with options spreads this week, and my metals positions were on fire. I'm still trading from a "hedge everything" mode as I don't trust this rally, and I'm still watching for REJECTIONS near these new highs.
Stay safe and GET SOME.
DM me if you have any questions.
#trading #research #investing #tradingalgos #tradingsignals #cycles #fibonacci #elliotwave #modelingsystems #stocks #bitcoin #btcusd #cryptos #spy #gold #nq #investing #trading #spytrading #spymarket #tradingmarket #stockmarket #silver

SPX500 Holds Above 6,225 – Bullish Trend Intact for NowSPX500 Update – Bullish Pressure Holds Above Pivot
SPX500 continues to show bullish momentum, as highlighted in our previous analysis. The price remains supported by strong buying volume above the key pivot zone at 6,225.
As long as the price stays above this level, a retest toward 6,225 remains possible before another leg higher.
However, a confirmed break below 6,225 would signal potential bearish momentum and shift the short-term structure.
Key Levels:
• Pivot Line: 6,246
• Resistance: 6,265 / 6,287 / 6,325
• Support: 6,225 / 6,191 / 6,143

SPX500 at New ATH – Will NFP Fuel the Next Leg Up? SPX500 Outlook: Trade Optimism Fades as Focus Shifts to U.S. Jobs Data
Caution prevails ahead of today’s high-impact U.S. Nonfarm Payrolls report, which could be pivotal for the July rate cut narrative. A weaker print may support risk assets and push SPX500 higher, while a strong report could dampen momentum.
Technical Analysis (SPX500):
SPX500 has printed a new all-time high and is now targeting 6287, especially if the index closes above 6246 on the 1H chart.
As long as price holds above 6225 (pivot), the bias remains bullish, with potential upside targets: 6287 & 6325
However, a 4H close below 6213 would suggest a correction toward: 6190 & 6143
Key Levels:
• Resistance: 6287 / 6325
• Support: 6190 / 6143
Stay alert — today's NFP report could trigger major moves across indices and FX.

July Doesn't Disappoint - S&P Nasdaq Dow Russell All RunningS&P All Time Highs
Nasdaq All Time Highs
Dow Jones closing in on All-Time Highs (and outperforming both S&P and Nasdaq recently)
Russell 2000 playing catch up and moving higher
This is melt-up at its finest
Since US/China Trade Agreement and Middle East Ceasefire Agreement, markets have used
these two events as further catalysts to continue the upside runs
Stochastic Cycle with 9 candles suggesting a brief pause or pullback in the near-term, but
a 3-5-10% pullback is still an opportunity to position bullish for these markets
I'm only bearish if the markets show that they care with price action. The US Consumer isn't breaking. Corporate Profits aren't breaking. Guidance remains upbeat. Trump is Pro Growth and trolling Powell on the regular to run this economy and market HOT demanding cuts (history says that's a BUBBLE in the making if it's the case)
Like many, I wish I was more aggressive into this June/July run thus far, but I'm doing just fine with steady gains and income trades to move the needle and still having plenty of dry powder
on the sidelines for pullbacks
Markets close @ 1pm ET Thursday / Closed Friday for 4th of July
Enjoy the nice long weekend - back at it next week - thanks for watching!!!

Opening (IRA): SPY July 18th 495 Short Put... for a 5.13 credit.
Comments: Targeting the <16 delta strike paying around 1% of the strike price in credit.
Max Profit: 5.13
ROC at Max as a Function of Strike Price: 1.04%
Will generally look to roll up if the short put is in profit at 45 DTE or greater, add at intervals if I can get in at strikes better than what I currently have on at the June 513's and July 495's, and/or consider a "window dressing" roll (i.e., a roll down to a strike that is paying about the same in credit) to milk the last drops out of the position.

SPRIAL TURN MAJOR JULY 5to the 10th TOP 4 spiral and one FIBThe chart posted is the updated chary for SPY SPIRAL calendar TURN Notice f12 is a spiral from July 16th 2024 top F 10 is from 11/2024 DJI The SPY was 12/5 th TOP F8 is from Feb 19th Top They ALL have a focus point on JULY 5th to 10th 2025 it is also 89 days since the print low. I Am looking for a MAJOR World event into this date . This time I feel it will be something with JAPAN . As to the markets here The put/call is now at the same level as july 2023 top and july 2024 . I have had fib targets in cash sp 500 from 6181 to as high as 6331 we are now in the middle of the targets But Time still has 3 to 5 days .So if we close strong today I will be buying deep in the money puts once again . The QQQ have entered the min target 551/553 But I tend to think {HOPE] we can reach 562 plus or minus 1.5 to move to a full short . But now in cash BTW the SMH target 283/285 is also a target .for its TOP Bitcoin is now setup for the next TOP I just need a new high .Best of trades WAVETIMER

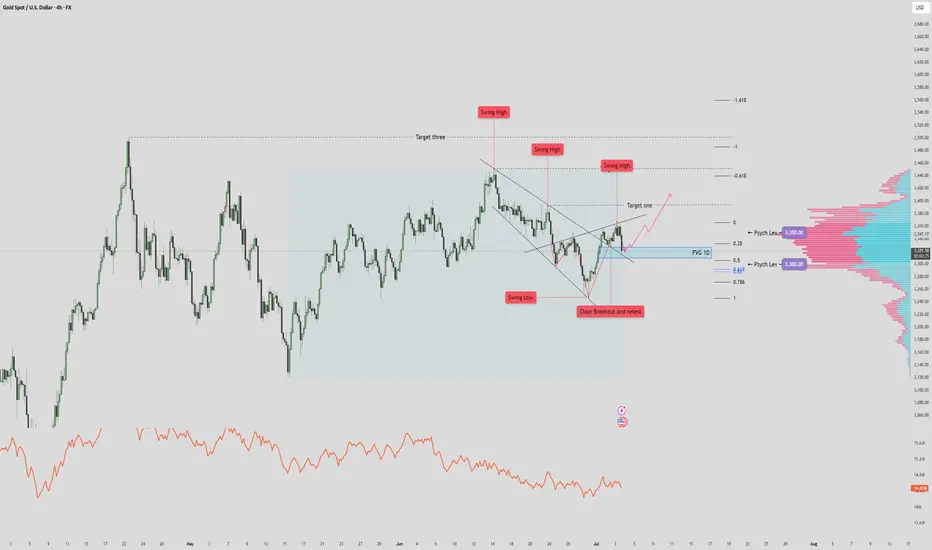
XAUUSD $3500 Recovery? Reverse Heads and Shoulders? 🔎 STRUCTURE & TECHNICAL ELEMENTS
1. Pattern:
A falling wedge was formed and broken cleanly to the upside → bullish reversal structure.
Breakout was followed by a successful retest at prior structure lows (marked “Clear Breakout and Retest”).
2. Fair Value Gap (FVG 1D) Zone:
Currently being tested. This zone coincides with:
Minor support from prior consolidation
Fib retracement (0.5 level)
Potential demand area (watch for bullish reaction/candle structure here)
3. Volume Profile:
3,350 = POC (Point of Control) → heavy resistance.
3,300 = Secondary HVN → strong support below current price.
Low-volume nodes just under current price → if broken, price likely accelerates into the GP zone.
4. Fibonacci & Liquidity Confluence:
Golden Pocket (3287) just below 3,300 = ideal liquidity draw if FVG fails.
Target 1 / 2 / 3 above are Fibonacci-based projections + historical swing zones.
✅ SCENARIO 1: Bullish Case – FVG Holds
If price respects the FVG 1D zone, expect:
Continuation up toward Target One (~3,430)
Extension to Target Two (~3,470) and even Target Three (~3,540+) possible
Confirmation: Bullish engulfing / high-volume bounce / sweep of intraday lows without close below FVG
Bias: Bullish continuation as long as price holds above FVG/0.5 Fib
🚨 SCENARIO 2: Bearish Case – FVG Breaks Down
If price closes below FVG zone, particularly below 3,312:
High probability drop toward 3,300 (psych level)
Liquidity sweep and deeper correction into Golden Pocket (~3,287) likely
This area can act as a high-probability long re-entry zone
Bias: Short-term bearish if close below FVG + swing structure invalidation
⚖️ REFINED SUMMARY
Price rejects off FVG - we can expect target 1 and 2 tagged.
Price breaks & closes below FVG zone - we can expect it to drop/wick to 3,300
$TSLA Time to Fade or..?NASDAQ:TSLA (like NASDAQ:GOOG ) is standing out to me as bullish, yet, corrective Elliot Waves a higher degree series of ABCs appear to be underway.
A final wave C appears to be underway which would take price too all time highs in an expanded flat correction pattern. My count could be wrong and the interference could be from the increase it sentiment volatility connected to the US headlines lately and Trump posting on socials. Things may get back to normal after the summer and a clearer pattern may emerge.
Price is struggling to get past the weekly pivot point bullishly or the weekly 200EMS bearishly and is trapped within that range.
For now long term target is the R2 daily pivot at $693 as the higher probability is continued upside
Safe trading
