$SPY Price Action *OptionsWe are currently in a downtrend towards the ~$454.81 OB.
If we fail to get a bonce we will fill the previous $454.18 OB.
If we get a bonce and breakthrough the previous downtrend we shall see a retest of $456 OB.
Spy500

$SPY Weekly Price TargetsBased off Price Action, the next 2 weeks will determine if we will see new ATH or fill previous Order Blocks (OB).
Currently, we are in an Uptrend with the continuation from Oct. 10th ~$360 Demand. We had a clean break through the OB created on the week of Aug. 22nd. Which lead us to fill the Apr. 4th OB.
We could potentially see a continuation to ATH or a pullback to the $437 FVG with a reversal towards ATH.
If we fail to break through the current OB or the previous ATH we could see a sell off leading to the closing of previous OB's on, Mar. 13th ~$386 & Oct. 10th ~360.

SPY WEEKLY 19th Nov,2023This is my weekly analysis for SPY. make sure to go through entire analysis and understand what is being again and again highlighted in the video.
NOTE:BE ON THE RIGHT SIDE OF THE MARKET(LONG)

S&P sell off for 1:5 on the risk to reward (Don't buy stocks)! The S&P has had an extraordinary run in November. It has moved up 400 points from the low and now looks to have consolidated and waiting to drop. Here are the reasons we want to sell this pair this week.
1) Daily RSI is overbought
2) H4 RSI is overbought and there is a double top
3) There is a Weekly pattern to sell which reacted previously and now there is a TYPE 2 test.
4) Strong resistance of last week's high of 4525 is there
This will be a long term trade. S&P takes time to come down so I expect this to run for about 4-5 weeks.

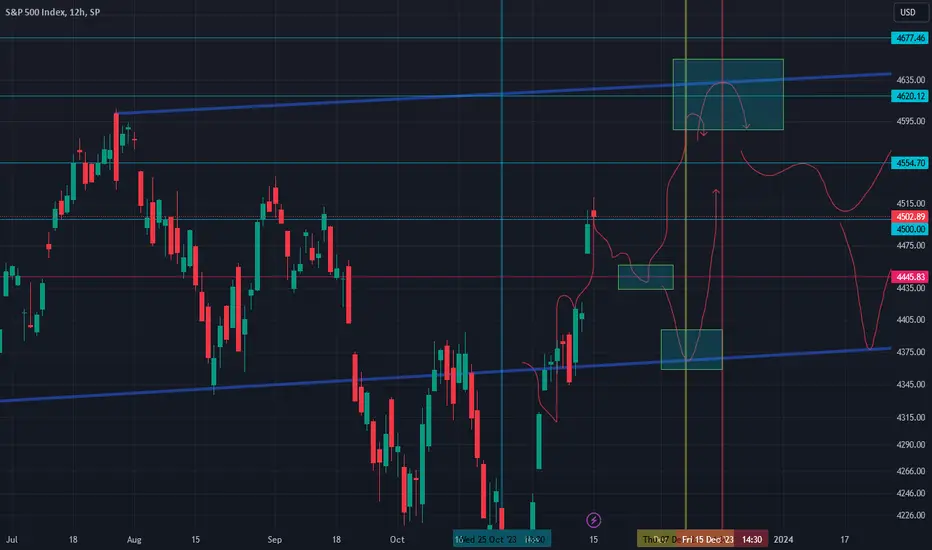
S&P 500 Preferred Short: Better Risk-RewardToday I want to discuss about the bull and bear cases for S&P and introduce the fractal concept
Bull case:
Cup with a handle
uptrend can be considered 1-2-3 wave and recent downmove as 4th wave
it is a possibility because wave 4 is in wave 1's terrority, similar to the big downtrend. But this can also be considered a leading diagonal
downtrend sub-wave 5 ended on uptrend wave 1
Bear case:
Fractal
retracement % is very close
both retracements reached peak of wave 2 of same degree
Preferred Elliott Wave Counts
Risk-reward is better on the short side now
speed of upmove

Buy This Bargain Before It's GoneIn early October 2023, we updated our previous forecast for the SPDR S&P 500 ETF Trust for the current year. Its price, after a short-term breakthrough of the triangle pattern (marked as (A)-(B)-(C)-(D)-(E)), returned above its lower border, and a new upward trend began despite the intensification of geopolitical tensions in the world, mainly due to the Hamas war against Israel.
On the other hand, in mid-November, US inflation data was released, which demonstrated the effectiveness of the Fed's policy. So, the consumer price index (CPI) rose by 3.2% for the 12 months ending in October, one of the lowest values in recent years.
The sharp decline in this indicator was primarily due to a significant decrease in prices for both energy and used cars and trucks.
Ultimately, these data triggered a short squeeze on government bonds, which had a positive impact on the stock market. Currently, on the daily timeframe (1D) of the SPDR S&P 500 ETF Trust, a gap has formed in the price range from $441 to $446, which, according to our estimates, will be closed in the next 1-2 weeks.
On a more global scale
Thanks to positive macroeconomic data released by government agencies in the US and European Union and lower oil prices in recent weeks, the likelihood of the Fed cutting interest rates in early 2024 has increased sharply.
We believe that the decline in 2-year Treasury yield will continue in the near future, which will also support the continued momentum of the SPDR S&P 500 ETF Trust. Moreover, financial market participants should pay closer attention to changes in the yield curve, which is becoming increasingly important and one of the most accurate fundamental tools for predicting changes in sentiment on Wall Street.
As soon as the 2-year Treasury rate approaches the 10-year Treasury rate, this will provoke investors and traders to exit long positions in bonds and more aggressively buy ETFs, shares of technology and pharmaceutical companies.
Conclusion
We believe the pace of the US economic recovery will continue to accelerate and expect the SPDR S&P 500 ETF Trust to reach $463-$464 by the end of 2024.
Analyst’s Disclosure:
This article may not take into account all the risks and catalysts for the stocks described in it. Any part of this analytical article is provided for informational purposes only, does not constitute an individual investment recommendation, investment idea, advice, offer to buy or sell securities, or other financial instruments. The completeness and accuracy of the information in the analytical article are not guaranteed. If any fundamental criteria or events change in the future, I do not assume any obligation to update this article.

SPX SPY SP500 updateExited my bottom snipe 450 calls. 900% in 2-3 weeks. Not bad. Had to take profit.
Following the same plan as outlined in this chart. Waiting for pull back here or close to here. Then calls again.
SPY WEEKLY 13th NOV,2023This is my weekly analysis for spy. I am not bullish or bearish, we need to wait.
NOTE:WAIT FOR THE RIGHT TRADE

Active SPY Weekly outlook. 3rd WK NOV 2023TOP PICKS & Tier 1. New Weekly Market Forecasts for 3WK NOV. 2023 are published.
Active SPY Weekly outlook. 3rd WK NOV 2023
> BULLISH 📈
Closed Price: 440.61
Target Price: 444.22
Upper Range: 452.51
Lower Range: 435.92

Trouble lies aheadAs the Chinese stocks are starting to show signs of weakness after a few days of upside movement, we expect the same scenario to play out in the U.S. market. With that said, the setup we introduced in a previous article remains valid. To support a thesis about a bearish reversal, we want to see MACD fail at breaking into the bullish zone on the daily chart; in addition to that, we want to see RSI and Stochastic continue declining.
Illustration 1.01
Illustration 1.01 shows two Chinese stock market indices we are paying close attention to.
Illustration 1.02
The picture above shows the weekly chart of MACD. A breakout below the midpoint is something to watch in the following weeks. If MACD succeeds in breaking below zero points, it will be very bearish.
Technical analysis gauge
Daily time frame = Slightly bearish
Weekly time frame = Bearish
*The gauge does not necessarily indicate where the market will head. Instead, it reflects the constellation of RSI, MACD, Stochastic, DM+-, ADX, and moving averages.
Please feel free to express your ideas and thoughts in the comment section.
DISCLAIMER: This analysis is not intended to encourage any buying or selling of any particular securities. Furthermore, it should not be a basis for taking any trade action by an individual investor. Therefore, your own due diligence is highly advised before entering a trade.

Expired SPY Weekly outlook. 2nd WK NOV 2023Expired SPY Weekly outlook. 2nd WK NOV 2023
> BULLISH 📈 CORRECT
Closed Price: 434.69
Target Price: 438.91 | Relative Strike Price: 438.47 NOV9
Upper Range: 457.23
Lower Range: 420.59

SPY LIVE NOV 9TH,2023This is my live analysis for spy and $439+ is on the way. watch it carefully . This is a swing trade.
NOTE:SL MEANS SL &TARGET MEANS BOOK YOUR PROFIT

SPYtrade read notes 8th nov,2023 SPY
entry-$435.25
target-$438.50
sl-$434.20
sl means sl& taget means target
This is a swing trade

SPY 6th Nov,2023 LIVEThis is my live analysis of SPY and if you have any questions let me know.
NOTE:MARKET IS TRYING TO TAKE A DIRECTION

ES 4H Analysis ES experienced a remarkable surge in the past week. However, we've returned to the crucial breakout and retest range of 4400-4430. For the rally to persist, it would be ideal for ES to have a moderate retracement and maintain demand in the vicinity of 4325-4340. While the price might continue its upward trajectory without a pullback, a measured retracement would be a positive sign. It's essential to remember that we remain in a declining channel and are approaching a vital zone characterized by the breakout, retest, and trendline resistance. Anticipate inconsistent and sluggish price movements (cooling period) before either a continuation or a reversal.
Key levels to monitor:
Resistance: 4400-4430
Support: 4325-4340

SPY WEEKLY|6th NOV,2023This is my weekly analysis for SPY and I am neutral for SPY. I have explained everything very clearly.
If you have any doubts or questions, do let me know.
NOTE:PATIENCE IS THE KEY

SPY LIVE FRIDAY 3rd NOV,2023This is my live analysis for Friday. Make sure to wait for the right opportunity. I have discussed price and value here so make sure that you do understand actual value of price.

"Higher for longer" to stay with usDuring yesterday’s FOMC press conference, Jerome Powell outlined the resiliency of the U.S. economy and labor market. In addition to that, the chairman reiterated the FED’s commitment to fighting inflation and bringing it to the goal of 2%. However, when asked whether the FED is confident about financial conditions being restrictive enough to finish the fight, the chairman answered that they are not confident about this fact and that more rate hikes might be on the table. Furthermore, Powell explained that all the effects of cumulative tightening had not been felt yet, allowing them to pause rate hikes and reassess the situation based on the upcoming data. With that said, we expect the policy of high-interest rates to continue to exert pressure on the economy, slowing it down. Plus, we disagree with FED’s outlook for no recession in 2024.
Technical analysis gauge
Daily time frame = Bearish
Weekly time frame = Bearish
*The gauge does not necessarily indicate where the market will head. Instead, it reflects the constellation of RSI, MACD, Stochastic, DM+-, ADX, and moving averages.
Please feel free to express your ideas and thoughts in the comment section.
DISCLAIMER: This analysis is not intended to encourage any buying or selling of any particular securities. Furthermore, it should not be a basis for taking any trade action by an individual investor. Therefore, your own due diligence is highly advised before entering a trade.

SPY/spx500Hello fellow traders, SPY on charts has a momentum, We might see 439.93 to clear the buyside, or it will just test this high,
Lets see how friday/NFP today, All numbers and price indicated as a reference on charts only.
This is not a financial advice.
Follow for more

SPY RSI+PRICE ACTION 2nd NOV,2023This is my analysis for SPY for coming days and weeks ahead. It is still in downtrend.
I have discussed price action along with RSI in this analysis.
Hope traders can understand the logics .
NOTE:YOU HAVE NOT MISSED ANYTHING

SPY weekly live analysis|1st NOV,2023Please understand the price action and the trade discussed and then act accordingly. If you don't understand or you are not sure sure feel free to message me.
NOTE:FOCUS ON RISK REWARD

10/31/23 Bullish Day- Outlook for WeekCME_MINI:ES1! AMEX:SPY SP:SPX CME_MINI:ES2! CBOE:XSP
Closed my spreads at 100% today. Another successful day if you read some of my Minds on these symbols. The market is looking for higher prices for the rest of the week short term.
Daily targets: 420-422
See you soon traders.

S&P500: Key Support Level for SPY Bulls to DefendThe S&P 500 been gradually breaking downwards since peaking in July. AMEX:SPY has reached the bottom of this red parallel channel last week. This is a key support level that has been providing strong support, and I think SPY bulls need to defend this price level this week. The RSI is oversold so the conditions are good for a rebound here.
