SPX Daily Harmonic Elliott Wave AnalysisOverview: in the update of yesterday, I mentioned that "As expected, we completed wave (I) and now we are inside wave (II) of c of Z, developing as a zigzag."
Update: the price action is following the specified path perfectly. I see that we have completed a zigzag and a wave x in wave (II), so far. Right now, we are in wave A of y of (II).
Spy500

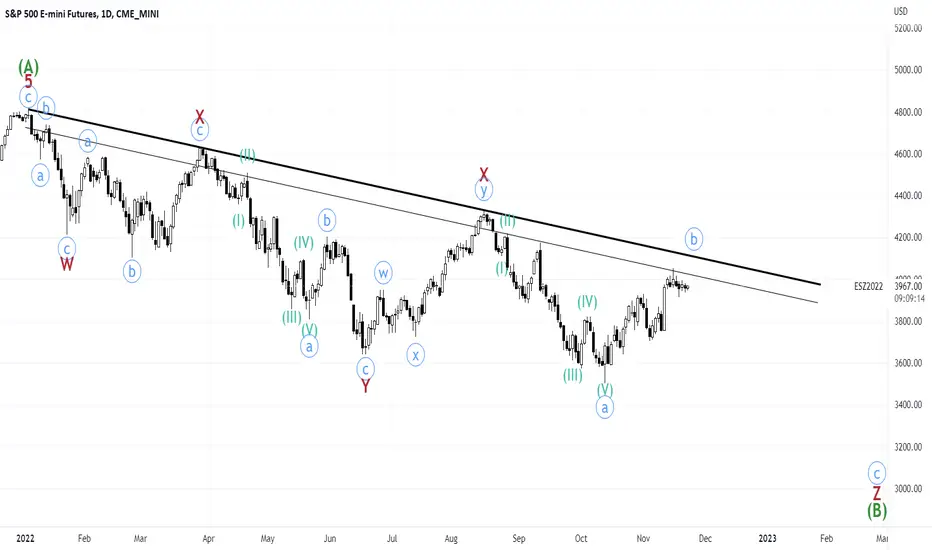
SPY S&P 500 ETF Options Ahead of the CPI ReportIf you haven`t shorted the Bearish Flag Chart Pattern:
The U.S. Bureau of Labor Statistics will release Consumer Price Index ( CPI ) data for the month of November 2022 on December 13, 2022, at 8.30am ET.
The rate of inflation is the most important data that will impact the Fed’s coming rate hike decision.
Now looking at the SPY options chain Ahead of the CPI Report, i would buy the $387 strike price Puts with
2023-1-20 expiration date for about
$8.96 premium.
If the options turn out to be profitable Before the CPI Report, i would sell at least 50%.
Looking forward to read your opinion about it.

SPX Daily Harmonic Elliott Wave AnalysisOverview: it's been a few weeks that the price action has been really tricky to count. Until yesterday, we had the idea that we have peaked for wave b of Z and have started wave c of Z, which was invalidated yesterday.
Update: with the higher high made yesterday, I am considering the following scenario: we have completed a triple zigzag in wave b. One thing that is worth noting is a fact I mentioned on the update of Nov. 14th: I have 4132.75 as the potential target for wave b peak . The peak of yesterday was 4132.22!
Note: A very important challenge for the readers is to prove this statement to practice HEW: the hourly count I published on Dec. 8th and the current hourly count has the exact same structure of subwaves. So, we have basically not changed a lot on the hourly count, just the labels were changed because of the higher high made yesterday.
Note: I repeat a valid point made on my Dec. 1st update: "There is a very important point in this count, as I warned before, this count can turn into an impulsive wave with equal probability and validity, meaning the bottom is in (this is a fact in the Harmonic Elliott wave theory that a triple zigzag can be also an impulsice wave since they both have the same structure of subwaves). How do we know which count is playing out? for now, we don't really care, both counts point to the fact that we should still head higher and get rejected probably mid-December to go lower. The structure and extent of that pullback is what determines the correct scenario."
Note: the broadening triangle on NDQ is a very bearish formation, but it needs breakdown through the lower trendline to confirm.

Tuesday CPI data will determine the direction of the StocksTuesday CPI data will determine the direction of the Stocks. SPY is currently sitting above the 100 SMA and slightly above 50 EMA. I guess, monday it will sell off to 50 EMA and Tuesday CPI data will determine the direction above or below 50 EMA

ES Daily Harmonic Elliott Wave AnalysisOverview: I did not publish an update to the idea of Dec. 6th, as there was really no need for that:
Dec. 6th update:
Actual price action:
Update: price action following the expectations perfectly except that wave 3 completion was a bit late. I see that we are in wave 4 of a of (I) of c of Z developing as a flat and completing very soon and going down for wave 5 of a of (I) today and tomorrow.

$SPY Bullish Trend Testspy cant go much lower if its to hold the upward trend we've been on. breaking this trend will result in a new formation and will possibly look to long near the next support zone unless we turn it into resistance.

ES Daily Harmonic Elliott Wave AnalysisThis is going to be a quick update on ES. I see that we have completed wave b as a triple zigzag and right now, we are in wave 3 of a of (I) of c of Z.

SPY Bearish Flag | Put Options After the Midterm Elections price target was reached:
Now the S&P 500 Etf SPY is ready for a breakdown from the Bearish Flag Chart Pattern highs.
In the light of recent unemployment data reports, i would buy the $387 Puts expiring 2023-1-20 for $4.89 Premium.
Looking forward to read your opinion about it.

Likely Bearish Confluence - S&P500, VIX, DXY & EURUSD
Powells recent remarks gave the S&P the boost it needed to test the weekly bearish trend line and now price action is also at a strong horizontal area of resistance. Other indices such as the FTSE have retraced most of the drawdown from when markets started falling at the start of the year. The S&P also is currently testing its Weekly 50ema.
The VIX, which is the volatility index of the S&P is also heavily oversold and is sitting right back in a large area of support, as would be expected from the S&P moving higher in recent weeks.
DXY, which has seen a pretty strong pullback after the recent bear market equity rally is now back at Weekly support, which coincides with getting very close to its Weekly 50ema.
The confluence seen is also reflected in EURUSD, which is retesting its Weekly 50ema and a weekly horizontal resistance level.
At current the confluence in the markets is pretty clean. Powell seemed to suggest that next months rate increase would be 50 basis points and the markets seemed to really bounce from that news. However, Powell was hardly dovish. If anything it seems to me that the recent rally after Powells comments enabled the markets to move up to a good area for bearish positioning.
Short S&P, Long VIX, Short EURUSD and Long DXY.

ES Daily Harmonic Elliott Wave AnalysisOverview: let's review the expectations on the previous update:
Completed wave c of (x) as expected and now we should head higher to form the last zigzag and complete wave b.
Update: the price action followed the expected path precisely.
Now, based on the structure, I see that we should still go higher. Wave 5 of a of (z) of b will form today, then we will have a pullback to test the broken descending trendline as wave b of (z) of b and again rally higher to complete wave (z).
What are points of interest to consider as wave (z) peak? (~4217-4253) since the update of Nov. 14th, we had 4132.75 as a potential target, which now I think is going to be surpassed.
Based on the pullback of wave a of Z, we get these points: 4208.75, 4245, 4253.
Based on the volume profile of wave a of Z, we have 4276 as a previous POC and 4217 as the VAH.
There is a very important point in this count, as I warned before, this count can turn into an impulsive wave with equal probability and validity, meaning the bottom is in (this is a fact in the Harmonic Elliott wave theory that a triple zigzag can be also an impulsice wave since they both have the same structure of subwaves). How do we know which count is playing out? for now, we don't really care, both counts point to the fact that we should still head higher and get rejected probably mid-December to go lower. The structure and extent of that pullback is what determines the correct scenario.

ES Daily Harmonic Elliott Wave AnalysisOverview: let's review the expectations of the previous update:
Developing wave b as a triple zigzag
Second wave (x) is a flat with its wave 5 of c still missing.
Wave b can be complete as a double zigzag and the confirmation for that is if we break the ascending trendline on the hourly chart.
Update: not much to update. We completed wave c of (x) as expected and now we should head higher to form the last zigzag and complete wave b. Again, don't forget that it is possible that we have peaked: we wait for the breakdown through the ascending trendline to confirm that.

ES Daily Harmonic Elliott Wave AnalysisOverview: in the last update, I expected that we are in wave 4 of c of (y) of b. So the basic idea was that we needed a pullback followed by a final push higher.
Update: I am still having the same idea, but with a little bit of relabeling to my hourly count: I think we are developing wave b as a triple zigzag and right now, the second wave (x) is developing as a flat with its wave 5 of c still missing.
Note that wave b can be complete as a double zigzag and the confirmation for that is if we break the ascending trendline on the hourly chart.

ESParty will end soon based off chart here..
Believe top of trend line comes in around 4150-4160 range.
Will be interesting to see if this is where resistance really comes in, retail has to be spooked to buy in at this point, watch for FOMO move to upside in coming days and then downside to follow towards the start of the year or maybe a little prior!

What a recession could look like.This is what I see if/when the recession kicks in completely and we reach that 2008 recession bear market. 50% pullback still leaves about 30% or so left from here to the downside.

ES Daily Harmonic Elliott Wave AnalysisOverview: let's review the expectation of the previous update:
"we are in wave (B) of 3 of c of (y) of b and today we should continue higher to complete wave 3 of c of (y)."
Update: price action following the expectations perfectly. We are in wave 4 of c of (y).

ES Daily Harmonic Elliott Wave AnalysisOverview: in the update of yesterday, our expectation was that we are in wave 3 of c of (y) of b.
Update: price action is following the expected path. I think we are in wave (B) of 3 of c of (y) of b and today we should continue higher to complete wave 3 of c of (y).

$SPYThe Trust seeks to achieve its investment objective by holding a portfolio of the common stocks that are included in the index (the “Portfolio”), with the weight of each stock in the Portfolio substantially corresponding to the weight of such stock in the index.

ES Daily Harmonic Elliott Wave AnalysisOverview: since the last update, we have not made any notable move.
Update: based on the structure, I am doing a minor relabeling to the hourly chart, but not any change to the general outlook that we need another higher high before reversal. To be honest, it is very tricky to count this low-volume low-volatility structure.
I think we are in wave 3 of c of (y) of b.
Short term drop before another leg up SPX500Looking for SPY to drop to demand (on Wednesday Nov 23rd, FOMC meeting ) and ill go long targeting the previous high.

SPY S&P 500 ETF Bearish FlagIf you haven`t noticed, our Midterm Elections price target was reached:
Now besides the technical bearish flag chart pattern, if i look at the SPY S&P 500 ETF options chain, i would buy the $376 strike price Puts with
2023-1-20 expiration date for about
$7.56 premium.
If the options turn out to be profitable Before the earnings release, i would sell at least 50%.
Looking forward to read your opinion about it.

ES Daily Harmonic Elliott Wave AnalysisOverview: the hourly count that I published yesterday was the bearish case that we have peaked for wave b, with a very short wave V of (c) of b. However, we did not see any follow through on the bear side and the move down from the Nov. 15th high is not impulsive. Now, I am reconsidering the same hourly count as before.
Update: we are in wave V of (c) of b. I have the same target as before: 4132.75...note that this market is so fragile that any news can through it on a different path, aka bearish count.

ES Daily Harmonic Elliott Wave AnalysisThis is going to be a very quick update. It seems we had a very short wave V of (c) of b and the peak is in. Right now, we are in wave 3 of a of (I) of c of Z of B.
I will elaborate more on targets and confirmation signals on the evening update of today.

SPY Looking bullish - Buy buy buyCup and Handle has formed on daily with SPY and it's looking good
7>21 but <200 - Almost perfect MAs
RSI broken out of its downtrend divergence and is showing buy territory
Bullish bias
