$SPX: Meltup to $6k in 2022?? No, Meltdown: $2.7k-$3.5k There's been a lot of people that have been conditioned to buy the dip over the last two years, because every time that's happened, it's led to higher prices. There's people making bold calls that after this "small dip" we're going to turn around and meltup to $6k. I don't buy it.
Looking at the structure of the chart, price action already looks bearish on lower timeframes but is starting to show bearish signs on higher timeframes (both the 2W and 1M timeframes). We just broke down out of this large upward channel, Heikin Ashi candles are showing a bearish trend forming on high timeframes and ichimoku is showing a wide separation of the tenkan and kijun on the monthly timeframe indicating that price needs to snap back to find a balance. 3 indications to me that price is going to move much further down.
If you were to look at historical price action on this chart, you'd see that anytime there's been a wide separation of the tenkan and kijun, price as retraced. The widest separation came before the March 2020 crash. The spread between the two lines now is far greater than during that period indicating to me that the snap back down could be a violent one.
My base case is that we fall somewhere between 20%-40% from these levels before continuing a move to the upside. I think this downside move is likely to take place this year 2022, and that we will bottom either later this year or in Q1 in next year.
I've marked out key months for pivots in price action on the chart. Will update my views if I see things change.
Spy500

$SPY longs over 394.46 look goodWatching $SPY over 394.46 for long entries with a target at 400.05. The bulls have defended support nicely up to this point.

$SPYThe investment seeks to provide investment results that, before expenses, correspond generally to the price and yield performance of the S&P 500 Index. The Trust seeks to achieve its investment objective by holding a portfolio of the common stocks that are included in the index (the "Portfolio"), with the weight of each stock in the Portfolio substantially corresponding to the weight of such stock in the index.

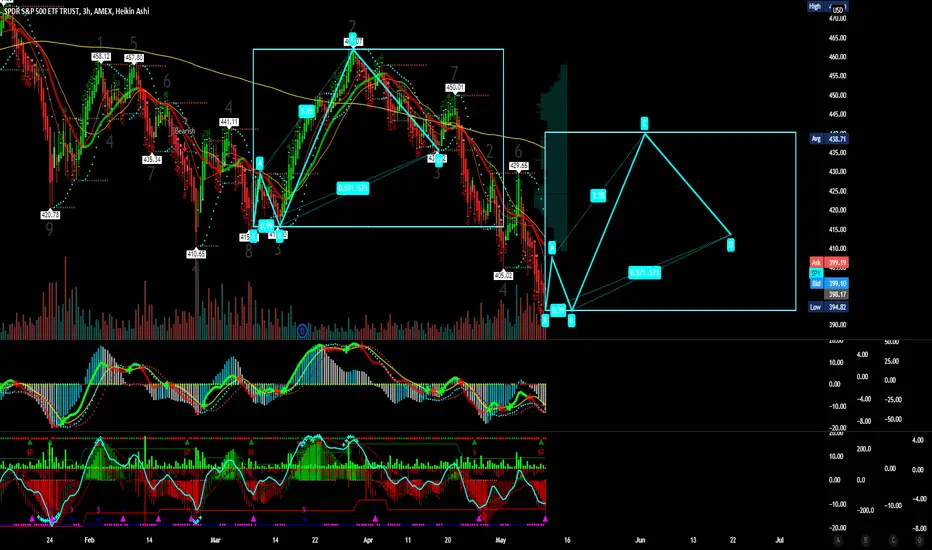
SPY POTENTIAL LONG SQUEEZE!Hey everyone,
Here is a demonstration on a long squeeze for the SPY. Given we have overall bearish momentum, this move is an institutional trap for retail traders who believe they are trading a break of resistance. Always trade the trend.
Peace, Seb.

$SPY breakout in progressLooking for the retest of 410.64 daily level. Over 410.64, expect 416 in extension.

410.64 re-test is on the table410.64 is a key daily/weekly support that turned resistance so a re-test would be expected at some point.
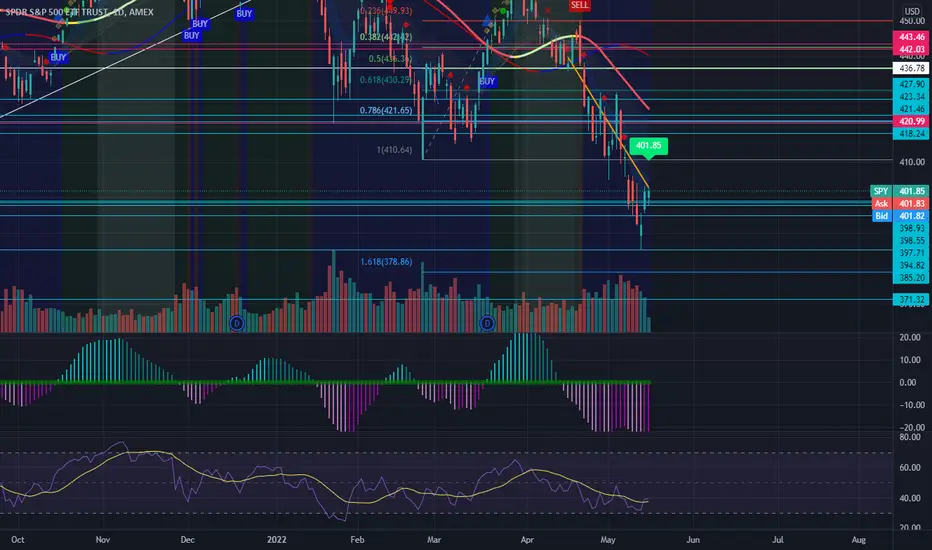
30m SR Levels: $SPY & VIXVIX: 28.78 support or 30.23 resistance. $SPY 402.55 resistance or 397.18 support. These are levels to watch this morning

RSI slight positive divergence on 1D RSI slight positive divergence on 1D with a nice looking reversal. Early Monday/Tuesday will be watching for bulls to look for continuation to retest the daily $410.64 support level that is now our resistance.

$SPY at a very important spot$SPY - Over 403.18 expect re-test of 410.64 daily support now turned resistance. Alternatively, Under 395.65 expect 4h 385.15 support test.

Not really know what I'm doing... Not really know what I'm doing...
Disclaimer: I'm not a financial advisor nor an experienced trader.

SPY Game Plan for May 13, 2022
Make sure to observe the 392.50 area as spy resistance for now. If that resistance breaks, we must wait and have patience, then go long and never chase. Overall, spy daily RSI at 30. Significant consideration note to take. But still, plenty of room to go down as RSI is calculated and first, down to 30 can be a fakeout, then 50, fall again back to 30 RSI, which means price movement will be way different and can go down far beyond imagination.
Two Scenario for tomorrow:
First one: Observe the market from 7:00 am-9:30 am EST. If we see a sell of pre-market, then for sure, on market hours, we can touch the resistance of 392.50. then back down again.
Second: If the resistance gets destroyed, wait for the cool off previous resistance to become support and go long from 392-394.
OPTIONS
Look at May 20, 2022, 380 puts if 392.50 area gets rejected and go long when resistance gets denied, then play with May 20, 2022, 405 calls.

SHORT | SPYAMEX:SPY
Possible Scenario: SHORT
Evidence: Price Action, Bearish Catalysts, Inflation and FED new policy, Geo-Political conflicts between Russia-Ukraine, H&S pattern on Weekly chart.
TP1: 420$
TP2: 400$
*Instead of SPY PUT options, I prefer short positions in AAPL, MSFT the premiums are still cheap if you compare it with indices.
*This is my idea and could be wrong 100%

SPY 2008 dailys vs current daily with Burry tweet bout Nadir 180Two questions I had:
how low will this go? I have no idea, so I used Burry's tweet suggestion.
how many years will it take to recover SPY to the current level? I have no idea, so stretched out the pattern based on Burry's tweet suggestion.
I still suck at charting, so don't use this. I actually thought we had one more last bounce, but looks like it's already dropping already.
For this chart:
I took a bigger picture view (curious how long it took for 2008 crash to recover to the same level as current pattern.
Biggest assumption here is using Burry's recent tweet, which said something about Nadir being 10% below the most recent market crash.'
The most recent crash was March 23 2020 (wonderful Covid lockdown times) when Spy was about 220 to 230
So 10-15% below (based on Burry's hypothesis) puts the bottom around 180.
So, I used the same bars pattern to make the very bottom at 180, and then it gave the timeframe.
Don't trade on this, it's just a hypothesis/theory, and I still am new to charting.

SPY 2008 dailys vs current daily with Burry tweet bout Nadir 180I still suck at charting, so don't use this. I actually thought we had one more last bounce, but looks like it's already dropping already.
For this chart:
I took a bigger picture view (curious how long it took for 2008 crash to recover to the same level as current pattern.
Biggest assumption here is using Burry's recent tweet, which said something about Nadir being 10% below the most recent market crash.'
The most recent crash was March 23 2020 (wonderful Covid times) when Spy was about 220 to 230
So 10-15% below (based on his hypothesis) puts the bottom around 180.
So, I used the same bars pattern to make the very bottom at 180, and then it gave the timeframe.
Don't trade on this, it's just a hypothesis/theory, and I still am new to charting.

DXY, And general market view [11May2022]Hello, I've been gone for some time now. busy with my job and backtesting and improving our code. Suffice to say, we saw a massive improvement in our backtest and also ability to capture psuedo-macro cycles, pretty stoked about that. Let's get over the boring stuff.
Our algo was pretty efficient at capturing dollar moves and as of today, dollar (DXY) became green again.
It had consolidation period for last week and current upper range is 106, which is pretty massive. Either the code is bugged or we are in for some pain.
When DXY is making these big moves, the associated pairs such as EURUSD and USDJPY are also showing some incoming big moves.
1. EURUSD is bearish short term and long term, and currently at the top end of its today's range
2. USDJPY is bullish short term and long term, currently almost at the low end of its today's range, but volatility is still a bit high for y liking's
3. USDMXN however is mild bearish, probably MXN still remains as one of the safe haven like in the 90s? I don't know, but I will not be buying USD against MXN
4. Micron (MU), our analyst actually likes this a lot, but currently it has a strong short term bearish trend to 62, short it if you want.
5. JD.com is short term bearish and long term bearish too
6. SPY and QQQ are also bearish at the moment, expect a bounce or a straight up drop. I will not be touching them for now
7. Crude oil is bullish at the moment with top end at 115 and low at 92, do with that what you will.
We have few more ideas for today, I'm just lazy to type them.
If you want some insight on our crypto plan, please hit follow I will be posting our idea for crypto for this year soon.

$SPY April 2022 CPI data are scheduled to be released on 5112022The investment seeks to provide investment results that, before expenses, correspond generally to the price and yield performance of the S&P 500 Index. The Trust seeks to achieve its investment objective by holding a portfolio of the common stocks that are included in the index (the "Portfolio"), with the weight of each stock in the Portfolio substantially corresponding to the weight of such stock in the index.
SCENARIO 2 FOR A POLKADOT BOTTOMPls visit our last Polkadot analysis for better context.
As we know DOT was inside an ascending triangle pattern ( bullish ), however price has fallen out of that pattern for a much larger wave 2 correction.
Should price fail to close back inside the triangle and i think it wil fail due to bitcoin's vacation, we will have ourselves in play, a regular flat correction for wave 2, comprising of a large ABC correction with the C wave being a 5 way impulse move marking a 100% retracement of our Wave AB and aligns perfectly with the downward trend channel price seems to have created.
Make sure to apply proper risk management.
Goodluck

$SPY 1D Linear Regression Channel$SPY testing the bottom of the 1D Linear Regression Channel into the market close today. Price has held the channel so far and we are keeping a close eye.

Big Volatile Day... Black Monday for S&P ?It seems ti is going to be big gap down and highly volatile monday for S&P 500... be careful and cautious.. VIX is already 13 % up.

SPYSPY is trying hard to go up as it bounces back from the support and has seen the 405 level twice. This area should be considered in high demand for now. Looking at the futures right now, they are already down -0.50%.
Two more things to consider:
1. MACD is trying to cool off as well with RSI.
2. If we see a bounce back from here and break the downtrend, we might see a reversal, but if the 425-430 area gets destroyed.
I'm going to play with calls tomorrow because on May 11, there might be a sell-off considering the CPI report.

SPYToday, we saw a massive sell-off after yesterday's massive rally, but there was an enormous volume at the end of the 15 minutes of the trading session. I see two scenarios tomorrow.
Scenario 1- we might see a dump at the beginning and then upward correction in which the spy will touch the 417-418 area and then back down again.
Scenario 2- We might see a sideway trend as well. 417-418 area, then back down to 410-411 area.
I'm bearish here because the pump didn't last even for a day and nobody bought the dip today. I'm looking for a 340-360 area to go long.

SPY Inverse Head and Shoulders PatternI think SPY is forming an Inverse Head and Shoulders Bullish Chart Pattern with a target of $480 by the end of the year.
Today the Contrarian Investing is a good idea: "Buy When There's Blood in the Street"!
looking forward to read your opinion about it.

$SPY on 30min Potential Cup and Handle Formation and Gap Fill $SPY on 30min Potential Cup and Handle Formation and Gap Fill
SPY has been all over the place but this looks like a cup and handle jump to me! $418 here we come :)
Not financial Advice.
What are your thoughts?
Thanks,
Kelly
